
Gold & Precious Metals

 Last November, OPEC orchestrated an impressive feat: corralling all (or nearly all) of its members to sign on to relatively aggressive production cut deal, and then actually convincing everyone to follow through on those reductions beginning in January. OPEC’s estimated 94 percent compliance rate defied the cartel’s own history of cheating and mistrust, and OPEC has taken around 1 million barrels of oil production per day off the market.
They were initially rewarded for this. Oil prices rallied more than 20 percent in the month after the deal was announced and investors and analysts have been mostly bullish on crude prices ever since. But the cuts were not all that they seemed to be for two reasons:
….related:

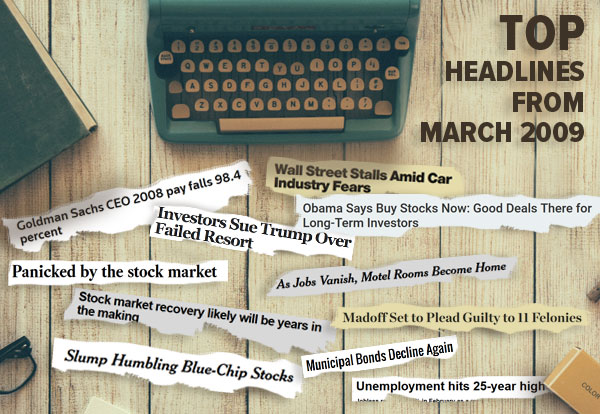
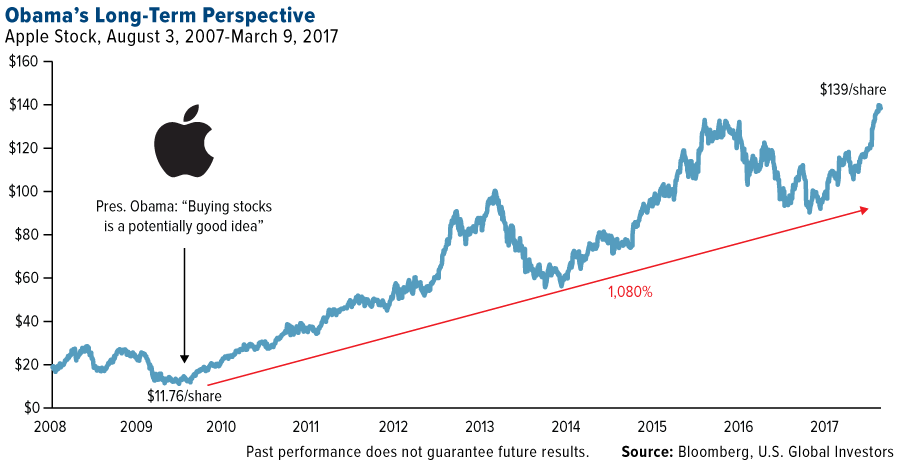
Eight years ago last week, President Barack Obama gave investors a surprisingly hot trading tip. In office less than two months, he commented that we were at “the point where buying stocks is a potentially good deal if you’ve got a long-term perspective.”
Obama couldn’t have known then how accurate his call was. The market found a bottom that very week, and investors who took the president’s advice managed to get in on the absolute ground floor.
At the time, investor sentiment was at or near record lows. The number of S&P 500 Index stocks trading below $10 a share had grown tenfold since the end of 2007. The New York Stock Exchange, in fact, had to temporarily suspend its requirement that equities trade at more than $1 a share. Giant companies such as Citigroup and General Motors—a share of which cost little more than a pocketful of spare change—were at risk of being delisted.
Today, many of those bullish investors have seen some spectacular gains. Since its low of 666 in March 2009, the S&P 500 has climbed a whopping 260 percent, with not a single year of losses. The average annual return has been over 15.7 percent, based on Bloomberg data. With dividends reinvested, it’s closer to 18 percent.
Just take a look at Apple, which has surged more than 1,080 percent as it introduced or expanded its line of got-to-have, now-ubiquitous products, from the iPhone to iPad.
To show you just how far we’ve come, I put together a few comparisons of several indices and economic factors between March 2009 and now.
| March 2009 | Most Recent Data, March 2017 | Percent Change | |
|---|---|---|---|
| S&P 500 Index | 666.79 (intraday low, March 6) | 2,400.98 (intraday high, March 1) | 260% |
| Dow Jones Industrial Average | 6,440.08 (intraday low, March 9) | 21,169.11 (intraday high, March 1) | 228% |
| University of Michigan Consumer Sentiment Index | 69.5 | 96.3 | 38% |
| U.S. ISM Manufacturing Purchasing Managers’ Index (PMI) | 35.8 | 57.7 (February) | 61% |
| Housing Starts | 505,000 | 1,290,000 | 155% |
| Light Vehicle Sales | 9,552,000 | 17,465,000 | 83% |
| Unemployment | 8.7% | 4.7% (February) | -45% |
| Gold | $885 (intraday low, March 18) | $1,248.30 (intraday high, March 1) | 41% |
| Sources: S&P Dow Jones Indices, Bureau of Economic Analysis, University of Michigan, Bureau of Labor Statistics, Census Bureau, ISM, IBA | |||
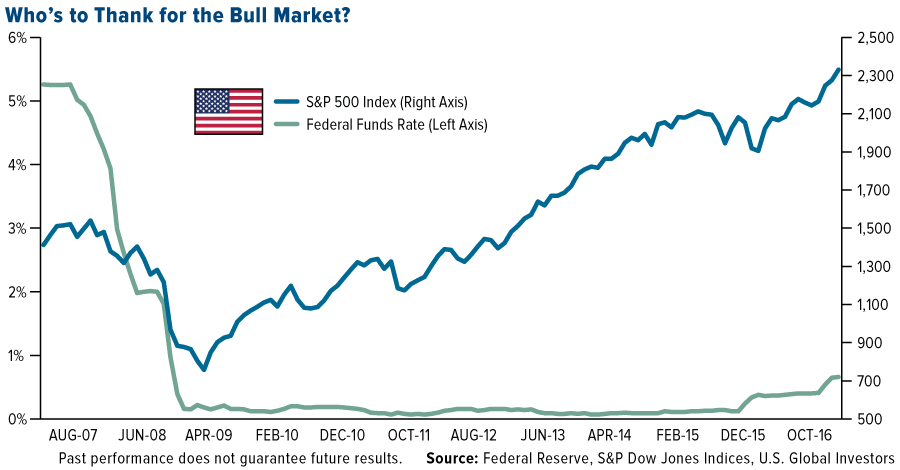
Of course, there have been market skeptics. As others have pointed out, this particular bull run—the second-longest in U.S. history—has arguably been the least loved, with many investors calling it artificial and arguing that it’s been driven not by fundamentals but the Federal Reserve’s policy of record-low interest rates.
Now there are those who wonder how much longer this bull run can last. And if it ends, will it be with a bang or a whimper?
“Trump Rally” Could Have Further Room to Grow
It’s important to keep in mind the old investing adage, “Bull markets don’t die of old age.” Bear markets have been incited by everything from geopolitical conflicts to stagflation to oil price shocks to financial crises. Although no one can say with all certainty that age is irrelevant in a market’s longevity, there are signs that the current eight-year-old run has further room to grow, at least in the short term.
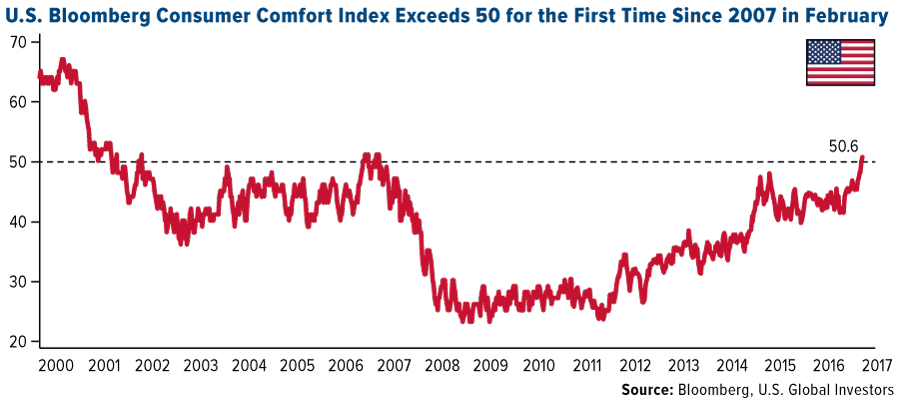
President Donald Trump’s pro-growth policy proposals, including lower corporate taxes, deregulation and infrastructure spending, have jolted many people’s “animal spirits,” with several indices already hitting near-record highs. In January, the Index of Small Business Optimism posted a reading unseen since 2004, as I shared with you earlier. More recently, the Bloomberg Consumer Comfort Index, which measures American consumers’ views on the U.S. economy and their personal finances, climbed to 50.6, the first time it’s exceeded 50 in a decade. Note how few times it’s risen above that level in the past 17 years.
And of course there’s the booming jobs market. Following the record 75 straight months of jobs creation under Obama, employers continue to ramp up their rate of hiring even more, indicating a rosy financial and economic outlook. Despite candidate Trump’s tendency to question the validity of encouraging jobs reports before the election, President Trump now has much to brag about in his first full month in office.
According to the Bureau of Labor Statistics (BLS), the U.S. added a phenomenal 235,000 jobs in February, with gains made in construction, manufacturing, mining, educational services and health care. The report indicated that mining added 8,000 positions during the month, 20,000 in total since a recent low in October, just before the election. This shows executives’ confidence in Trump, who pledged to revive the industry by eliminating job-killing regulations.
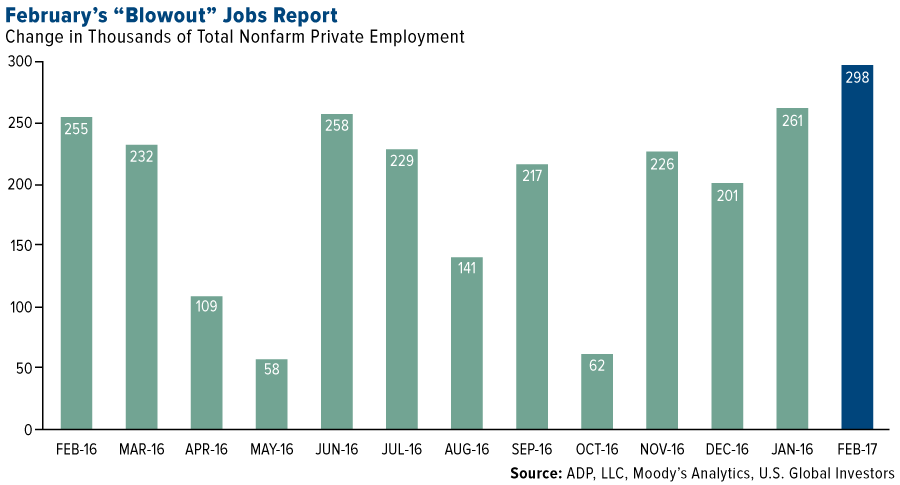
Another recent report was even more generous than the BLS. The ADP National Employment Report showed U.S. employment increasing by nearly 300,000 from January to February. Medium-size businesses—those with between 50 and 499 employees—expanded the most, adding 122,000 positions.
Gold historically has fallen on better-than-expected jobs reports, but I was happy to see that it actually gained on Friday after eight days of losses. The yellow metal held above $1,200 an ounce, even as it becomes more and more certain that interest rates will be hiked this month.
Valuations High, but Good Deals Can Still Be Found
Some investors right now might be discouraged by high stock valuations. Although it’s true certain sectors are beginning to look expensive—information technology is currently trading at more than 23 times earnings, real estate at 43 times earnings and energy at a whopping 113 times earnings—there are still some attractive deals.
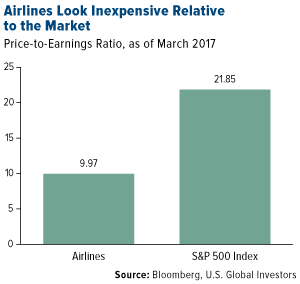 |
Among them is the airlines industry, which as of today has a very reasonable price-to-earnings ratio of 9.97. At 21.85, the S&P 500 is more than twice as expensive.
This is one of the many reasons why billionaire investor Warren Buffett is bullish on airlines, which he once called a “death trap” for investors. Not only did his holding company Berkshire Hathaway purchase shares of the four big domestic carriers—American, United, Delta and Southwest—but it dramatically expanded those holdings in the fourth quarter, according to regulatory filings. Now there’s even speculation that Buffett and Berkshire Hathaway could be planning to acquire one of these four carriers outright, with Morgan Stanley’s Rajeev Lalwani writing that Southwest’s “domestic focus, robust and sustainable free cash flow, range of growth opportunities, defensible cost structure and more tenured management team” make it a logical candidate.
Some links above may be directed to third-party websites. U.S. Global Investors does not endorse all information supplied by these websites and is not responsible for their content. All opinions expressed and data provided are subject to change without notice. Some of these opinions may not be appropriate to every invest.
The Dow Jones Industrial Average is a price-weighted average of 30 blue chip stocks that are generally leaders in their industry. The S&P 500 Stock Index is a widely recognized capitalization-weighted index of 500 common stock prices in U.S. companies. The University of Michigan Confidence Index is a survey of consumer confidence conducted by the University of Michigan. The report, released on the tenth of each month, gives a snapshot of whether or not consumers are willing to spend money. The ISM manufacturing composite index is a diffusion index calculated from five of the eight sub-components of a monthly survey of purchasing managers at roughly 300 manufacturing firms from 21 industries in all 50 states. The Small Business Optimism Index is compiled from a survey that is conducted each month by the National Federation of Independent Business (NFIB) of its members. The Bloomberg Consumer Comfort Index is a weekly, random-sample survey tracking Americans’ views on the condition of the U.S. economy, their personal finances and the buying climate.
Holdings may change daily. Holdings are reported as of the most recent quarter-end. The following securities mentioned in the article were held by one or more accounts managed by U.S. Global Investors as of 12/31/2016: American Airlines, United Continental Holdings, Delta Air Lines, Southwest Airlines.

 As I presume you know by now, Larry Edelson passed away on March 2, leaving all of us in shock and mourning.
But this past week, I had the privilege of spending quality time with Larry’s cycle forecasting protégé, Mike Burnick.
Mike has worked closely with Larry since he joined our firm nearly two decades ago. He is steeped in cycle analysis. And he has used it to make an important contribution to the team’s amazingly accurate forecasts, especially regarding gold and stocks.
Gold Forecasts
October – November, 1999: “19-year bear market in gold is OVER. Finished, Kaput. We’re entering a bull market the likes of which you haven’t seen since the great glory days for gold in the 1970s. But don’t expect gold to shoot straight up. There are bound to be pullbacks, especially during the early stages.” Shortly thereafter, they warn gold will slide to the $250 level before beginning its long-term rise.
The price of gold hits rock bottom at $255, and moves up from there. It ultimately reaches an all-time peak of $1,921 in 2011.
November 2000: Major new “buy” signal for gold and gold shares. “Start scooping up bullion coins and … mining shares.”
Result: Investors acting on this signal have the opportunity to buy gold-mining shares close to their lowest prices in decades.
August 2011: Major “sell” signal for gold and gold shares.
Result: Between their buy signal of 2000 and their sell signal of 2011, investors have the chance to make a total return of 850% on Agnico Eagle, 878% on Kinross, 1,059% on Newcrest, 1,248% on Goldcorp and 2,958% on Royal Gold.
May 2016. “More and more investors will get trapped in the precious metals’ first leg up … And those investors will be badly crushed under tens of billions of losses when gold, silver, platinum, palladium — and especially mining shares — collapse back down to near their record lows of late last year.”
Result: At first, as gold continues to move higher, their subscribers are frustrated with this forecast. But beginning in early July, the price of gold sinks by $200 per ounce, providing a much better buying opportunity, and subscribers cheer.
Stock Market Forecasts
April 2012. “The Dow Jones average will hit 20,000 by the year 2016.”
At the time, the Dow is trading near 13,000. In Europe, a major sovereign debt crisis rages. In the U.S., pundits are deeply concerned about “the weakest economic recovery in history.” Even friends and family say Dow 20,000 is “unbelievable.” But four years and eight months later, on December 20 of last year, the Dow hits an intraday high of 19,988, just 12 points below their target of 20,000. And on January 25, 2017, just a few weeks beyond the target year, the Dow bursts through the 20,000 barrier.
Moreover, they don’t make this forecast just once. They repeat it in March 2013, June 2013, October 2013, December 2013 and every year thereafter.
Nor do just a handful of people see it. The original forecast of Dow 20,000 by 2016 is sent to 392,140 subscribers to Money and Markets, 37,291 subscribers to Real Wealth Report, and at least two million investors who receive the same forecast via advertisements in the mail and on the Web.
They are equally accurate in timing and predicting stock market crashes going all the way back to Larry’s forecast of the Crash of 1987!
How do you do it?
So as you may suspect, when I met with Mike last week, my obvious and urgent question was “precisely how did you do it?”
 “I assume you’re referring to ‘you’ in the plural,” he responded, “because I cannot take more than my share of the credit. Larry was the one who taught me cycles analysis and who was our mentor throughout these years. But before I answer your question, may I ask you one of my own? March 2017 is a major anniversary that no one seems to be talking about. Care to guess why that date was so important?”
I recalled: “The eight-year anniversary of this bull market, which began in March of 2009.”
“Well yes, that too,” Mike said with a chuckle. “But what I’m referring to is something that happened on March 11, 2011. This week is the six-year anniversary of the great tsunami that struck Northeast Japan. It came on the heels of a massive 9.1 undersea earthquake, the most powerful earthquake ever recorded in Japan. It triggered a tremendous wave of up to 133 feet. That’s 12 stories high! Imagine how it felt to confront a mass of water as tall as a 12-floor building coming straight at you! Imagine the destruction in its wake!”
I was silent for a moment, recalling the horror I felt that morning when I first saw the headline in the Los Angeles Times, and immediately thought about our son, Anthony, who lives in Tokyo. Thankfully, I soon discovered that Anthony was not among the victims because, coincidentally, that same L.A. Times story included a statement from the first American witness quoted from Japan, Anthony Weiss.
“How does that relate to our topic today?” I asked as I exited my daydream.
“It’s a perfect metaphor for our forecasting methodology,” Mike responded. “We track the great cyclical waves of history, and right now, the biggest, most enduring, consequence of those cycles is the Global Money Tsunami — the massive waves of flight capital from overseas that are driving our market higher. You know that. We write about it all the time. But now let me tell you about the powerful cyclical forces behind that tsunami.”
“That’s exactly what I want to talk about.”
While pulling out a series of charts stretching back for decades (and in one case, for centuries!), Mike promptly proceeded to rattle off four major cycles with a high level of precision and certainty:
The Kondratieff wave (K-wave), ranging from 40 to 60 years. Close students of this cycle could have foreseen, well ahead of time
- A decline in the 1860s and a bottom in the 1870s, accurately predicting the economic crisis surrounding the U.S. Civil War and Reconstruction.
- A rise into the late 1800s and early 1900s, accurately forecasting America’s Gilded Age.
- A peak in the 1920s, predicting the great bull market of the Roaring ’20s.
- A big bottom in the 1930s, predicting the Great Depression. Plus, more recently …
- Another big bottom in the 2000s, predicting the 2000-03 Tech Wreck, 2008 Debt Crisis and Great Recession.
- A steep rise beginning in 2009, clearly showing the path toward today’s 8-year bull market (so far), AND predicting a continuing bull market through approximately 2020.
Juglar and Kuznets cycles, approximately 9- and 18-year cycles, respectively. Again, those following these cycles could have foreseen …
- A panic bottom in the stock market in 1932.
- A decline in the U.S. economy and stock market in the early 1950s (associated with the Korean War).
- The stock market decline and recession resulting from the Nixon Shock of 1971 and Arab Oil Embargo of 1973.
- The stock market crash of 1987 (which we predicted practically to the day) and the Russian debt default crisis of 1989.
- The crises of 2007-2009, and …
- The current bull market in stocks, projected to continue until 2020 or possibly longer.
Cycle of Innovation, the 50-year cycle of business innovation discovered by Joseph Schumpeter. Predicts periods of “creative disruption” and entrepreneurship, along with political upheavals that can often accompany rapid technological change. Cycle is now still very high and holding, but targeting a bottom after 2020.
War Cycle, ramping up through 2020. Not just armed battles, but also trade wars, currency wars, and cyberwars. Not merely between nations, but also domestic civil unrest, revolutions and escalating repression or asset confiscation by governments against their citizens.
“Anyone who truly knows cycles,” Mike concluded, “should be well versed in precisely when these are likely to peak and bottom. However, what many cycle analysts don’t know so well is two things: How to track them closely to determine when they may be hitting somewhat earlier or later than originally projected. And most important of all, how, during very rare historical periods like today’s, these cycles can CONVERGE into one time and place.”
“Convergence! That’s where Larry and team really hit a home run, isn’t it?” I asked.
“Yes, it certainly is. And in this decade, we have the most powerful convergence of the cycles since the 1930s. I say that not to focus on the Great Depression, but rather to focus on the massive up-wave that ensued after the Great Depression and World War II. It started in gold. Then came the postwar boom in stocks. And finally, the greatest bull market and economic expansion in all human history. Not without big recessions and disasters in-between, of course. But in hindsight, all of those — especially the stock market crashes of 1987, 2000-2003 and 2008 — were historic buying opportunities. What’s most important of all is that, with the foresight that careful cycle analysis can give you, all of those cycle bottoms were predictable and predicted.”
Mike and I were silent as we reflected on the enormity of these historical forces and the important contribution Larry Edelson made to the world by helping to bring them to light. “Now that Larry is gone,” I queried, “what is your vision going forward? What are your forecasts for the next few years?”
“The same vision as before. The same forecasts we have already published repeatedly, from the same exact body of knowledge: The long-term cycles I’ve just told you about, seen through Larry’s telescopic lens that I’ve inherited, for which I will be forever grateful.”
“Don’t understate your own analytical powers,” I cautioned.
“Thank you for that. But you asked for our forecasts. The first forecast is that gold will surge to $5,000 per ounce, or higher. In the current phase of that bull move, it’s driven primarily by the same global money tsunami we discussed at the outset. That comes with both ebbs and flows. So beware of corrections, such as the one that just started last month. But this will be a wonderful long-term buying opportunity. That’s because, as inflation picks up steam, the latter stages of the move in gold could be parabolic, much as you saw in the late 1970s, when the price of gold doubled in just one year.
“Forecast number two: The Dow will explode to 45,000. I know that may sound unbelievable. But in 1999, we saw the Nasdaq double in just one year. And the time frame we’re talking about is much longer than that. If we didn’t know better, we’d throw our hats in the ring with all those pundits who still say the economy is not strong enough and interest rates are rising, so the Dow must crash. But, if you understand the four cycles we talked about … if you understand the Global Money Tsunami that will flow to the U.S. from a sinking Europe and later, a sinking Japan … you will also understand how to make a fortune over the next few years with select stocks that deliver life-changing profits.
“Forecast number three: Sovereign bond market will collapse. And that collapse will emerge as another driver of funds that rush into stocks. Why? Because solid private-sector assets, such as the shares of U.S.-based blue-chip companies, will actually be seen as safer than bonds. Because the governments of Europe, Japan and, ultimately, the U.S. are essentially bankrupt. There’s simply no way they’ll ever make good on their outstanding debts — not to mention their promises for retirement pensions (such as Social Security), healthcare, and more.
“Forecast number four is the collapse of the European Union and the euro. Many think the European Union will survive. Many hope that, because Germany’s economy is hanging in there, the European sovereign debt crisis is done and over. That view is dead wrong. That’s why we have long predicted that the biggest surprise of all will be not only the decline, but also the demise of the EU and the euro. Now, as you can plainly see, that day is much closer.
“Hitch your wagon to these cycles, and you will win. Ignore them, fight them, or simply drop out, and you will lose. I’m all in. I trust you are too.”
I thanked Mike for sharing these insights. He promised to provide many more in the weeks to come.
Good luck and God bless!
Martin

Briefly: In our opinion, speculative short positions are favored (with stop-loss at 2,410, and profit target at 2,200, S&P 500 index).
Our intraday outlook is bearish, and our short-term outlook is bearish. Our medium-term outlook remains neutral, following S&P 500 index breakout above last year’s all-time high:
Intraday outlook (next 24 hours): bearish
Short-term outlook (next 1-2 weeks): bearish
Medium-term outlook (next 1-3 months): neutral
Long-term outlook (next year): neutral
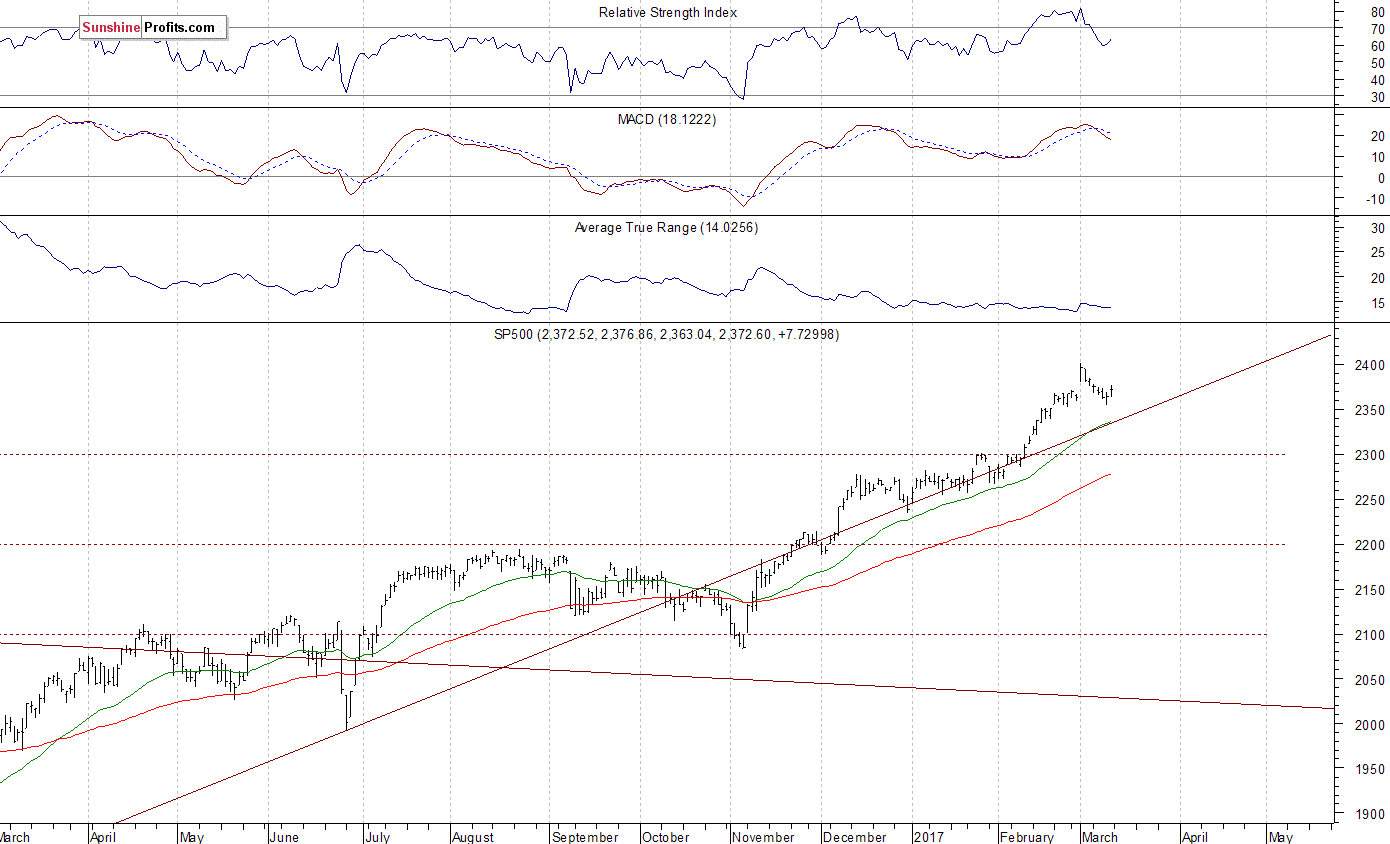
The main U.S. stock market indexes gained between 0.2% and 0.4% on Friday, retracing some of their recent move down, as investors reacted to better-than-expected monthly jobs data release, among others. The S&P 500 index has bounced off support level of 2,350 on Thursday. The broad stock market index remains relatively close to its all-time high of 2,400.98. The Dow Jones Industrial Average closed slightly above 20,900 mark on Friday, and the technology Nasdaq Composite index got closer to the level of 5,900 again. All three major stock market indexes continue to trade relatively close to their early March new record highs. The nearest important level of support of the S&P 500 index is at around 2,350-2,360, marked by previous short-term consolidation and the February 21 daily gap up of 2,351.16-2,354.91. The support level is also at around 2,320. On the other hand, the nearest important level of resistance is at around 2,380, marked by some short-term local highs, and the next resistance level is at 2,390-2,400, marked by all-time high. Will the market extend its year-long medium-term uptrend even further before some more meaningful downward correction? We can see some short-term volatility following four-month-long rally off last year’s November low at around 2,100. Is this a topping pattern before downward reversal? The uptrend accelerated on Wednesday, March 1 and it looked like a blow-off top pattern accompanied by some buying frenzy. The S&P 500 index continues to trade above its over year-long medium-term upward trend line, as we can see on the daily chart:
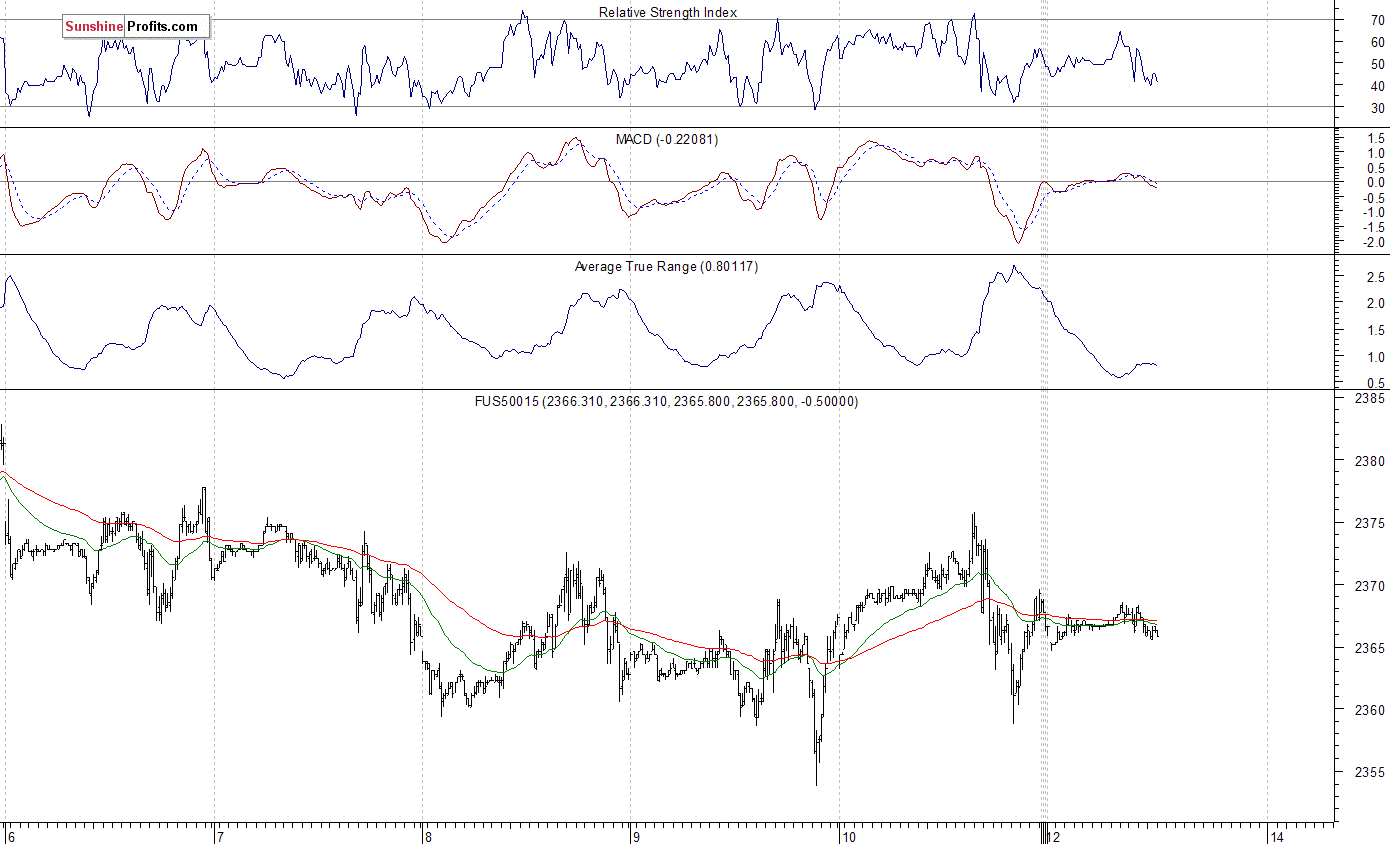
Expectations before the opening of today’s trading session are virtually flat, with index futures currently between -0.05% and 0.0%. The European stock market indexes have gained 0.1-0.2% so far. Investors will wait for Tomorrow’s and Wednesday’s economic data releases – consumer and producer inflation numbers, FOMC Interest Rate Decision. The S&P 500 futures contract trades within an intraday consolidation, as it fluctuates following its late last week’s rebound off support level. The nearest important level of resistance is at around 2,370-2,375, marked by short-term local highs. The next resistance level is at 2,390-2,400, marked by record high. On the other hand, level of support remains at 2,350-2,360, marked by short-term local lows, among others. The market continues to trade within a short-term consolidation following recent rally. There have been no confirmed negative signals so far. For now, it looks like relatively flat correction within an uptrend:
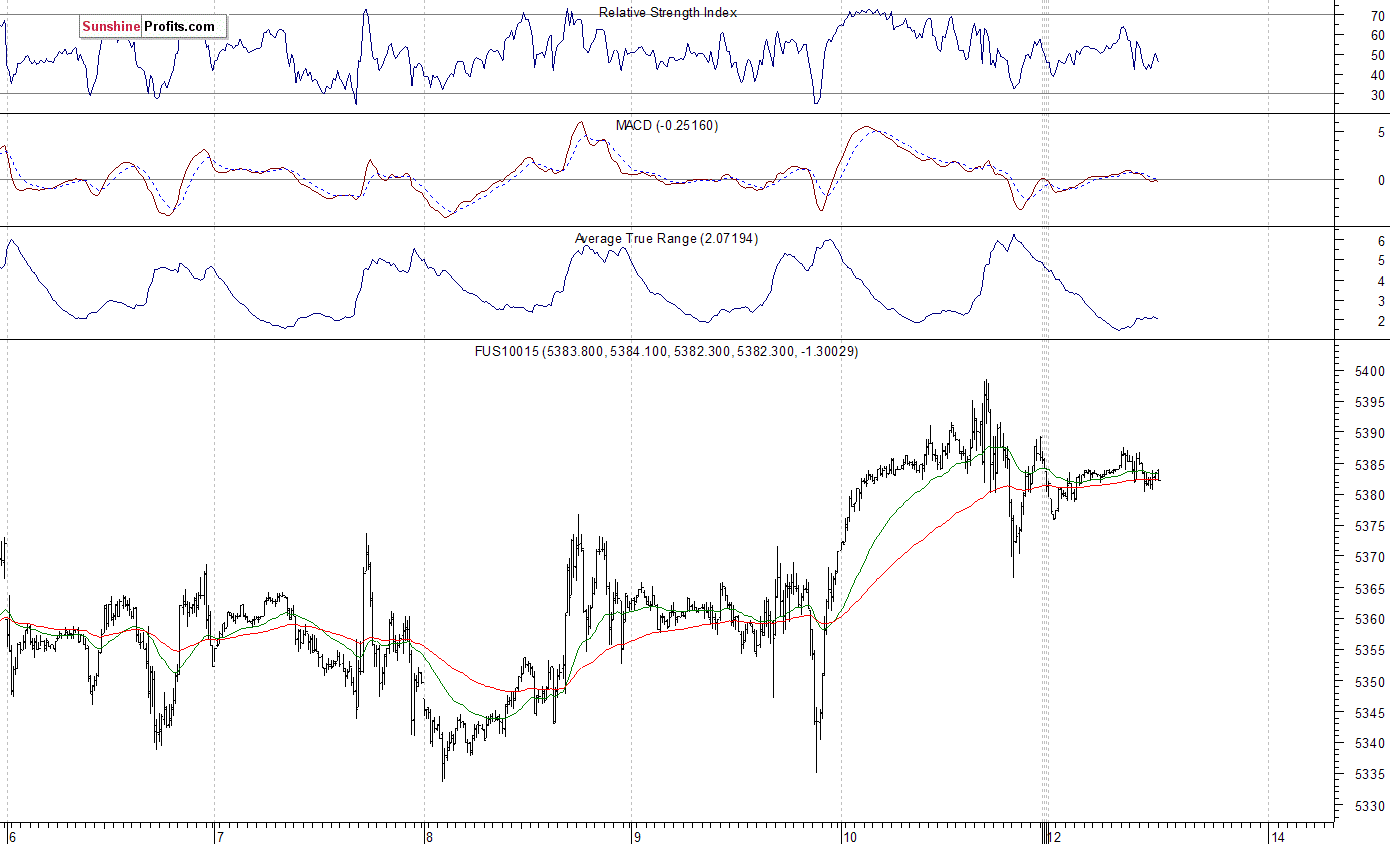
The technology Nasdaq 100 futures contract is relatively stronger than the broad stock market, as it currently trades close to record high at around 5,400 mark. It remains within an intraday consolidation following Friday’s advance. The market has bounced off support level of 5,330-5,340 on Thursday. The nearest important level of resistance is at 5,400, marked by all-time high. On the other hand, support level is at 5,370, marked by recent fluctuations, as the 15-minute chart shows:
Concluding, the broad stock market retraced some of its recent decline on Friday, as the S&P 500 continued its Thursday’s rebound. Expectations before the opening of today’s trading session are virtually flat, following Friday’s better-than-expected monthly jobs data release. Will the market resume its uptrend? There have been no confirmed negative signals so far. However, we still can see medium-term overbought conditions accompanied by negative technical divergences. Therefore, we continue to maintain our speculative short position (opened on Wednesday, February 15 at 2,335.58 – opening price of the S&P 500 index). Stop-loss level is at 2,410 and potential profit target is at 2,200 (S&P 500 index). You can trade S&P 500 index using futures contracts (S&P 500 futures contract – SP, E-mini S&P 500 futures contract – ES) or an ETF like the SPDR S&P 500 ETF – SPY. It is always important to set some exit price level in case some events cause the price to move in the unlikely direction. Having safety measures in place helps limit potential losses while letting the gains grow.
To summarize: short position in S&P 500 index is justified from the risk/reward perspective with the following entry prices, stop-loss orders and profit target price levels:
S&P 500 index – short position: profit target level: 2,200; stop-loss level: 2,410
S&P 500 futures contract (March) – short position: profit target level: 2,197; stop-loss level: 2,407
SPY ETF (SPDR S&P 500, not leveraged) – short position: profit target level: $220; stop-loss level: $241
SDS ETF (ProShares UltraShort S&P500, leveraged: -2x) – long position: profit target level: $15.47; stop-loss level: $12.98
Thank you.


-
I know Mike is a very solid investor and respect his opinions very much. So if he says pay attention to this or that - I will.
~ Dale G.
-
I've started managing my own investments so view Michael's site as a one-stop shop from which to get information and perspectives.
~ Dave E.
-
Michael offers easy reading, honest, common sense information that anyone can use in a practical manner.
~ der_al.
-
A sane voice in a scrambled investment world.
~ Ed R.
Inside Edge Pro Contributors

Greg Weldon

Josef Schachter

Tyler Bollhorn

Ryan Irvine

Paul Beattie

Martin Straith

Patrick Ceresna

Mark Leibovit

James Thorne

Victor Adair