
Personal Finance
 “I think here we’re going to go down 20 percent from the recent top at 1,470. The technical position of the market is poor and the corporate earnings are worsening. And I believe that if the statistics were precise – which they aren’t – (…) I think there’s hardly any growth,” Faber said.
Four months ago, Faber turned his attention to European stock markets, attracted by the low valuations.
“Greece, Italy, Spain, France, Portugal, they were four months ago at the 2009 lows or even lower,” he said.
Faber recommended buying European stocks at the time and for the first time in his life bought them himself.
“I did it simply because the valuations were low. Since then, Greece is up 65 percent,” he said.
He would no longer buy European stocks, he said. “I expect a correction but no new lows,” Faber said.
Now he is focusing on Asia.
“In Asia, Thailand from the 2009 lows is up 250 percent. Other markets like the Philippines, Indonesia, Malaysia, Singapore, are up by a similar amount,” he said. The Chinese benchmark index on the other hand was at 6,000 in 2007, now it is at 2,000.
“I think China and Japan could have a rebound here. If Greece could rebound by 65 percent the greatest garbage could rebound by 65 percent,” Faber said.
Faber: Reduce Government by 50%
The debt burden in the U.S. and other Western countries will continue to increase, Marc Faber, author of the Gloom, Boom and Doom report told CNBC on Monday, leading to a “colossal mess” within the next five to 10 year
“I think the regimes will try to keep the system alive as it is for as long as possible, which means there’s no “fiscal cliff,” there’s a fiscal grand canyon,” Faber told CNBC’s“Squawk Box.”
Faber argued that the political systems in place in the West would allow the debt burden to continue to expand. Under such a scenario of never-ending deficits, the Western world would rack up huge deficits.
One day, the system would break, he said.
“Eventually, you have either huge changes occurring in a peaceful fashion through reforms, or, usually, through revolutions,” he said. The U.S. is getting closer to such a revolution, he said, as is Europe.
“I think the timeframe would be within five to ten years you have a colossal mess … everywhere in the Western world,” Faber said. “I think the deficit here (in the U.S.) — irrespective of who is in the White House — will stay above a trillion dollars per annum for at least as far as the eye can see“.
Bureaucracies in the U.S., as well as Europe, are far too big, he said, and are a burden on the economy.
“My medicine for the U.S. is: Reduce government by minimum 50 percent,” he said. “The impact would be immediately an improvement in the economy.”

The $1800 per ounce level continues to be a major technical resistance area for gold. After hovering near $1800 recently, gold moved sharply away from that level last week to close at $1735 an ounce.
Despite that, more fund managers and analysts continue to point to a bright long-term future for gold prices. John Hathaway of the Tocqueville Gold Fund says gold will reach new highs within a year. He based his forecast, like many others, on the fact that negative real interest rates look likely to persist as Ben Bernanke and the Federal Reserve continue to print money.
Believe it or not, some mainstream analysts are also touting gold’s potential. Merrill Lynch analysts point to the correlation (discussed in a previous article) between the price of gold and the expansion of the Federal Reserve’s balance sheet since the start of QE1 in early 2009.
Based on the current path of the Fed’s balance sheet expansion, Merrill Lynch came up with two longer-term targets for the price of gold. They project gold to hit $2,000 an ounce next summer and to hit $2,400 an ounce by the end of 2014.
Another way to look at gold and the Fed is the so-called gold coverage ratio. That is the amount of gold on deposit at the Federal Reserve versus the total money supply. According to Guggenheim Partners, the gold coverage ratio is at an all-time low of 17%. The historical average is about 40%, meaning that gold would to more than double to reach the average.
Looking at the Fed’s balance sheet is a new and interesting way to look at and forecast gold prices. In the past, the conventional wisdom was that gold was merely an anti-dollar play: U.S. dollar down, gold up and vice versa. But that seems to be changing…..
Reuters had some interesting data. The value of the U.S. dollar net short position fell to $6.43 billion for the week ended October 9. This is substantially down from the previous week’s net short position of $16.3 billion. At the same time, the “managed money” net long gold position in gold futures rose to its highest level since August 2011. That was the time when gold hit its record high of $1,920 an ounce.
So much for conventional wisdom. Both currency and gold traders are seeing this long-term relationship between gold and the U.S. dollar breaking down into a “new normal” of direct central bank intervention into financial markets. Gold seems increasingly to be turning into more of a safe haven play than an anti-dollar one. It seems that more investors are worried about all fiat currencies that are burdened by huge debt loads.
The Technical Take…
Below is a daily chart of gold futures. Looking at the price levels and analysis you can see that a bounce or bottom could form at any time now. Price of gold has pulled back in a mini five wave correction touching both our first Fibonacci retracement level of 38% and the 50 day simple moving average. This is the type of pullback that longer term investors like to add to their long gold position. While gold does have the potential to fall all the way down to $1625, in the long run it should continue to rise for the long term investor.
From a trader point of view, it may be worth a stab to get long gold with a very tight stop, but until we see a real panic selling day in gold where volume is high I don’t think the final bottom is in yet.

You can get my weekly trading analysis and trade ideas here: www.TheGoldAndOilGuy.com
Chris Vermeulen

 Excuse me if I sound like a pessimist today. I’m not. I’m actually an optimist about our country’s future. I’m also optimistic for the future of the global economy.
But I’m also a realist.
No matter who wins the U.S. presidential election come November 6 ― there is simply no way our country will ever make good on its gargantuan debts and pile of IOUs that now total as much as $212 trillion.
Washington could raise taxes to 100% of your income, and the debt still wouldn’t be paid off. They could slash spending to zero, and the debt would not be paid off.
The same applies to Europe. It’s drowning in debt and there is simply no combination of tax increases and austerity measures that will fix its problems, either.
So what’s the solution then? It’s actually very simple.
The world needs a new monetary system. New “rules of the game,” as central bankers like to call them.
Or a “new financial architecture” — the term used by many academics. A new “Bretton Woods.”
Thing is, that’s where we’re headed. Toward a new monetary system. But getting there won’t be easy.
Right now, for instance, the world is mostly caught up in competitive currency devaluations. No country wants a currency that’s too strong for fear it will hurt exports and aggravate deleveraging and deflation.
So the Fed prints money. Ditto for the European Central Bank. In fact, almost all major central banks are now printing money. They all think that money-printing will inflate away debt, cheapen their currency, revive exports and fix unemployment.
But the fact of the matter is that no amount of money-printing will solve any of those problems.
It’s not going to solve unemployment in the U.S. or in Europe. It’s not going to get rid of unpayable debts. It’s not going to fix unfunded pensions, Social Security, Medicare.
It’s not going to rescue Europe’s zombie banks and governments.
And it’s not going to build real wealth for anyone.
At best, all it will do is artificially inflate asset prices.
Meanwhile, the massive debts our country — and Europe — has will continue to mount. The cost of servicing the rising debt will become more and more burdensome.
And this will go on until the entire house of cards on both sides of the Atlantic comes crashing down.
We’ve already seen the first phase hit, and pass. We’re now in the middle of the eye of the storm, where there’s relative calm. But soon, the next phase, the next wave of the storm will hit.
It will be the worst phase of this great financial crisis. It will tear apart everything you thought you knew about the world, about your world, about your wealth, your children’s future, your grandchildren’s future.
It’s where gold will soar to well over $5,000 per troy ounce. Silver to over $150. Oil to near $200. Food prices to the moon. Interest rates surging. And more.
And then, when the house of cards finally comes crashing down, world leaders will finally get together to change the world’s monetary system to wipe out and forgive bad debts and to start anew with a fresh balance sheet.
I’ve discussed this before in a previous Uncommon Wisdom column and in my Real Wealth Report, and where the ideas I set forth went viral on the Internet, even appearing on Rep. Ron Paul’s (R-Texas) website.
I will reiterate them here: In the end, when it finally becomes apparent that no amount of money-printing, tax hikes or austerity measures will fix the sovereign-debt problems of Europe and the United States, world leaders will meet and agree to two basic steps for the foundation of a new world monetary system …
![]() Monetize most, if not all, of the Western world’s debt (temporarily sending gold to well over $5,000 an ounce).
Monetize most, if not all, of the Western world’s debt (temporarily sending gold to well over $5,000 an ounce).
![]() Create a new world reserve currency, tied to a commodity basket and administered by the International Monetary Fund.
Create a new world reserve currency, tied to a commodity basket and administered by the International Monetary Fund.
I also suspect that at some point, as far-fetched as it may sound, world leaders will also consider a debt-free banking system. One that mimics, at least in part, the Islamic banking system where Sharia law forbids usury and interest and, instead, works on the basis of “Profit-Loss Sharing,” or PLS. Put another way, the bank becomes your partner in your home or your business, instead of a lender.
We have a long road ahead of us. But as I said at the outset, I believe the crisis the world is going through will eventually give birth to a better world for all of us.
It just won’t be easy getting there. It will be a trip through hell.
Right now, most markets are still consolidating and looking like they will retest important support levels, as I have been expecting. Gold is starting to slide; so are silver, oil and many other commodities.
So while downside is still present, and there are opportunities to make money on the downside, never forget that there is one asset — bar none — that you should own for the longer term.
It’s gold. There is nothing better than gold. If you own gold already, hold, and wait for my signals to add more gold. If you don’t own gold, get ready to buy — either on a decline back to major support levels, or a full-blown breakout to the upside above $1,823.
Best wishes,
Larry
P.S. If you truly want to be positioned correctly in gold for its next lift-off to $5,000-plus, I strongly recommend you consider a membership to my Real Wealth Report. That’s where you will get every one of my timing signals to buy gold, silver, mining shares, resource-based income investments and more.
The price: A mere $89 year. Peanuts in the scheme of things. To join, simply click here now.
About Uncommon Wisdom
For more information and archived issues, visit //www.gliq.com/cgi-bin/click?weiss_uwd+0117202-7+UWD1172+vgbb@shaw.ca+%20%20%20%20%20%20%20%20++1+4422655++“>http://www.uncommonwisdomdaily.com
Uncommon Wisdom (UWD) is a free daily investment newsletter published by Weiss Research, Inc. This publication does not provide individual, customized investment or trading advice. All information is based upon data whose accuracy is deemed reliable, but not guaranteed. Performance returns cited are derived from our best estimates, but hypothetical as we do not track actual prices of customer purchases and sales. We cannot guarantee the accuracy of third party advertisements or sponsors, and these ads do not necessarily express the viewpoints of Uncommon Wisdom or its editors. For more information, see our//www.gliq.com/cgi-bin/click?weiss_uwd+0117202-10+UWD1172+vgbb@shaw.ca+%20%20%20%20%20%20%20%20++1+4422655++“>Terms and Conditions. View our //www.gliq.com/cgi-bin/click?weiss_uwd+0117202-11+UWD1172+vgbb@shaw.ca+%20%20%20%20%20%20%20%20++1+4422655++“>Privacy Policy. Would you like to //www.gliq.com/cgi-bin/click?weiss_uwd+0117202-13+UWD1172+vgbb@shaw.ca+%20%20%20%20%20%20%20%20++1+4422655++“>unsubscribe from our mailing list? To make sure you don’t miss our urgent updates, just follow these simple steps to //www.gliq.com/cgi-bin/click?weiss_uwd+0117202-12+UWD1172+vgbb@shaw.ca+%20%20%20%20%20%20%20%20++1+4422655++“>add Weiss Research to your address book.
Attention editors and publishers! Uncommon Wisdom content may be republished with a link to the full story onUncommonWisdomDaily.com. Such republication must include attribution with a link to the Uncommon Wisdom home page as follows: “Source: http://www.uncommonwisdomdaily.com“

The entry point for the seasonal trade in North American equity markets (on Average during the past 61 years: October 28th) either was reached at the beginning of last week or will appear this week. Preferred strategy is to accumulate equities and Exchange Traded Funds with favourable seasonality at this time of year that already are showing technical signs of performing with or better than the market (i.e. S&P 500 for U.S. equity markets and TSX Composite for Canadian equity markets). Sectors include agriculture, forest products, transportation, industrials, steel consumer discretionary, China and Europe.
Interesting Charts
The S&P 500 Index added 4.60 points (0.32%) last week. Intermediate trend is down. The index fell below its 20 and 50 day moving averages on Friday. Short term support at 1,425.53 is being tested. Short term momentum indicators have recovered to neutral levels.
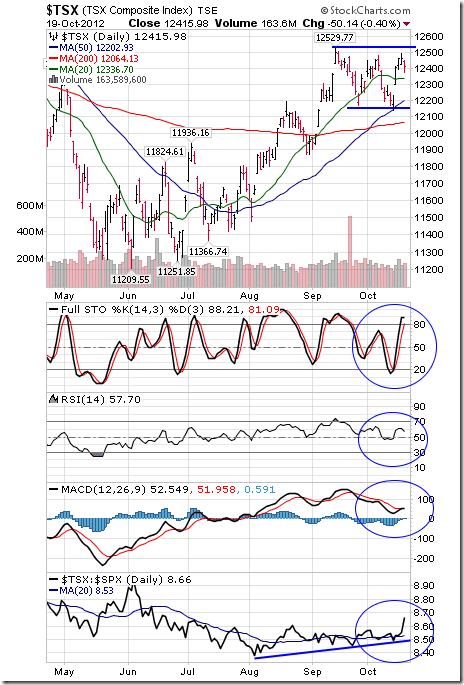
The TSX Composite Index gained 213.94 points (1.75%) last week. Intermediate trend is neutral. Short term support is forming at 12,137.18 and resistance exists at 12,529.77. The Index bounced nicely from near its 50 day moving average and moved above its 20 day moving average. Short term momentum indicators are trending higher despite the decline on Friday. Strength relative to the S&P 500 Index has changed from neutral to positive.
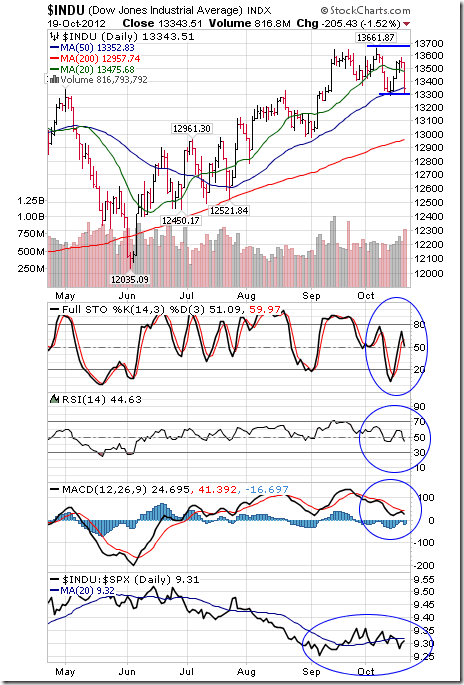
The Dow Jones Industrial Average added 15.46 points (0.12%) last week despite the fall last week. Intermediate trend is neutral. Resistance is at 13,661.87 and short term support at 13,296.43 is being tested. The Average fell below its 20 and 50 day moving averages on Friday. Short term momentum indicators have recovered to neutral levels. Strength relative to the S&P 500 Index remains neutral.
….Don has 50 more charts and so much more on his Great Monday Report HERE
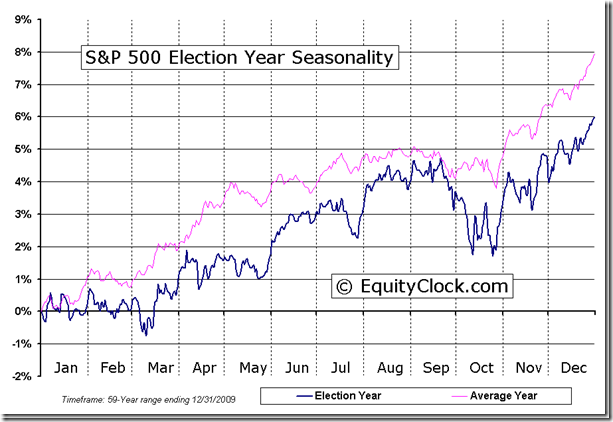
The recovery is happening at an interesting time, just before the U.S. Presidential election when equity markets typically start an intermediate upside move lasting until at least Inauguration Day in the third week in January.
A word of caution about individual equities! Responses to third quarter reports released yesterday were exceptional, particularly by stocks reporting after the close. Most companies are reporting slightly higher than consensus earnings. However, many are missing consensus revenue estimates. Of companies that reported before the close yesterday, State Street gained 2.0% and Johnson & Johnson improved 1.4%. However, Goldman Sachs fell 1.3% and UnitedHealth Group slipped 0.6%. Responses to reports released after the close were downright scary. CSX added 1.7%. However, IBM plunged 3.5%, Intel dropped 2.2%, Linear Technology fell 4.0%, Apollo plunged 7.6% and Intuitive Surgical gave up 4.8%. Today and tomorrow are the days when the most S&P 500 companies are reporting third quarter results. Look for lots of volatility.
About the Great Author of this Daily Report – Don Vialoux
Don Vialoux has 37 years of experience in the Investment Industry. He is a past president of the Canadian Society of Technical Analysts (www.csta.org) and a former technical analyst at RBC Investments. Don earned his Chartered Market Technician (CMT) designation from the Market Technician Association in 1995. His CMT paper entitled “Seasonality in Canadian Equity Markets” was published in the Spring-Summer 1996 edition of the MTA Journal. Don also has extensive experience with Exchange Traded Funds (also know as Index Participation Units) as well as conservative option strategies. In 1990 he wrote a report that was released in the International Federation of Technical Analyst Journal entitled “Profiting from a Combination of Technical and Fundamental Analysis”. The report introduced ” The Eight Phases of the Stock Market Cycle”, an investment concept that continues to identify profitable entry and exit points for North American equity markets. He is currently a member of the Toronto Society of Fundamental Analyst’s Derivatives Committee. Now he is the author of a daily letter on equity markets available free on the internet. The reports can be accessed daily right here at www.dvtechtalk.com.

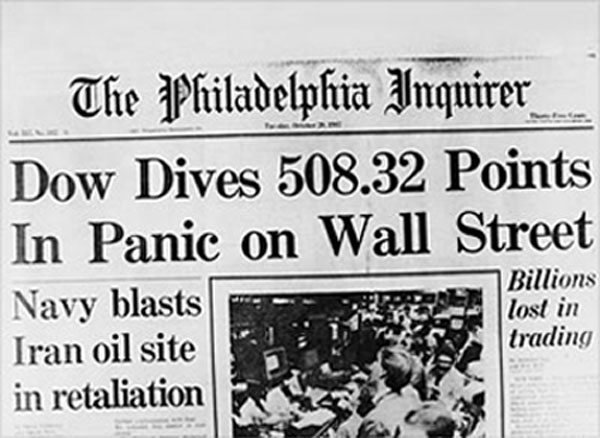 On Monday October 19, 1987, I was in Toronto attending a financial conference while the stock market crashed. I desperately wished I had been in my office to witness the events of the day…the best I could do was join the growing mob gathered around the only Reuters machine in the hotel and watch the action. I had bought out-of-the-money bond call options on Friday thinking that the sharp tumble in bond prices (rising yields) had gone far enough…but as the stock market crashed on Monday the bond market fell limit down…I was glad I was only long calls instead of long futures…but the crash, with the Dow down over 500 points on huge volume, was unbelievable. After the close the only thing on everybody’s mind was, “What’s going to happen tomorrow?”
From January to August 1987 the Dow had gained about 40%. The bull market that had begun 5 years earlier in the summer of 1982 had seen the Dow triple and, of course, it was such a strong bull market that everything, including the junk, was going up. There was little fear in the market and anyone who counseled caution was laughed at. But the market peaked in late August and began to slide. There was a currency crisis brewing, and interest rates were rising. The week before the crash the Dow fell a record 240 points, and then the dam broke on October 19.
The market opened higher Tuesday morning but quickly sold off and made new lows…everybody held their breath…but then it turned around and the Dow was up 100 points on the day…on even bigger volume than Monday…and the worst was over, although at the time you couldn’t be sure of that. Two years later, in August 1989, the Dow finally traded above its pre-crash highs.
I gave my scheduled speech to a shell-shocked audience on Tuesday afternoon and took a cab to the airport. I was scheduled to fly to Chicago for business meetings but the crash had so unnerved me that I was afraid to go…I imagined the market crashing further…social order breaking down…being trapped in Chicago as the city went dark…and I decided that it would be safer to fly back home to Vancouver. I called the over-night desk and sold my bond calls for 10 times what I had paid for them on Friday but there was little joy in the trade. My world had been changed forever…my naïve assumptions about the level of risk in the market had been shattered…and forevermore I would truly understand that you could lose everything in an instant.
I think it was the speed of the crash that stunned everyone. The Dow fell 770 points (30%) in 4 days after rallying for 5 years…confidence had turned to fear and panic in a heartbeat…where a few days earlier everything looked rosy now everything was suspect.
We’ve had a few scary crashes since 1987…the summer of 98, 9/11, 2002, 2008, even the summer of 2011…and each time I got that awful feeling that maybe this time we were really going to take a hit. The big crash in 1987 made me forever skeptical of bullish enthusiasm…I’ve seen confidence turn to panic in a heartbeat…I’ve seen the illusion of market savvy proved to be a very dangerous thing…I’ve seen the market do something that was beyond anyone’s wildest dreams…and I suspect that I’ll see something like that again. Be careful out there.
Current market views:
This week’s action in stocks, commodities, currencies and interest rates has strengthened my view that we had a “blow-off top” in the risk-on trades following the global round of “Q.” I’m trading accordingly, and I think there is a decent risk that we could get some downside momentum.
Victor Adair
Victor Adair is a Senior Vice President and Derivatives Portfolio Manager at PI Financial Corp. Victor began trading financial markets over 40 years ago and has held a number of senior positions during his long career as a commodity and stockbroker. He provides daily market commentary on CKNW AM 980 radio Vancouver and is nationally syndicated on Mike Campbell’s weekly Moneytalks radio show. Victor’s trading focus is primarily on the currency, precious metal, interest rate and stock index markets and his clients are high net worth individuals and corporations.
by
Victor Adair
Victor Adair is a Senior Vice President and Derivatives Portfolio Manager at PI Financial Corp. Victor began trading financial markets over 40 years ago and has held a number of senior positions during his long career as a commodity and stockbroker. He is nationally syndicated on Mike Campbell’s weekly Moneytalks radio show. Victor’s trading focus is primarily on the currency, precious metal, interest rate and stock index markets and his clients are high net worth individuals and corporations. You can reach Victor Adair at: 604 664 2889 or vadair@pifinancial.com
Article provided by:
Drew Zimmerman
Investment Advisor
PI Financial Corp. | Vancouver, BC
Tel: 604 664 2842
Email: dzimmerman@pifinancial.com
Web: /www.pifinancialcorp.com

-
I know Mike is a very solid investor and respect his opinions very much. So if he says pay attention to this or that - I will.
~ Dale G.
-
I've started managing my own investments so view Michael's site as a one-stop shop from which to get information and perspectives.
~ Dave E.
-
Michael offers easy reading, honest, common sense information that anyone can use in a practical manner.
~ der_al.
-
A sane voice in a scrambled investment world.
~ Ed R.
Inside Edge Pro Contributors

Greg Weldon

Josef Schachter

Tyler Bollhorn

Ryan Irvine

Paul Beattie

Martin Straith

Patrick Ceresna

Mark Leibovit

James Thorne

Victor Adair