
Timing & trends
Four observations seem warranted based on available information – and they range from the certain to the highly uncertain.
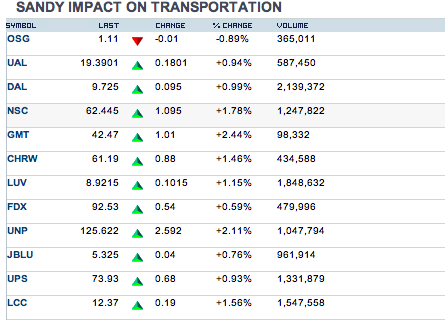
First, the greatest impact is in individual sectors where we may see distinct winners and losers.

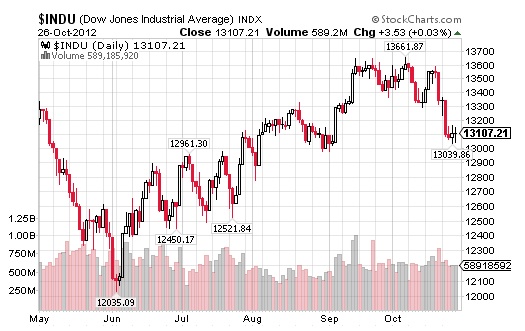
“It looks to me as though some kind of a large top has formed during late-September and October. But the mystery (there’s always a mystery) — what could this “top” mean? We see the breakdown to 13,039. Ah, and here’s the fascinating part of it. What could the market be telling us?”
Is the Frankenstorm symbolically hinting of our future?
So what should we, as investors, do about it? My oft expressed answer is that we don’t have to do anything about it. The strategy that I have chosen is to sit on the sidelines with a portfolio clean of stocks. Or maybe for those who have strong stomachs and an urge for excitement, limited positions in GDX and GDXJ. The latter on the thesis that gold is acting well, despite general market weakness.
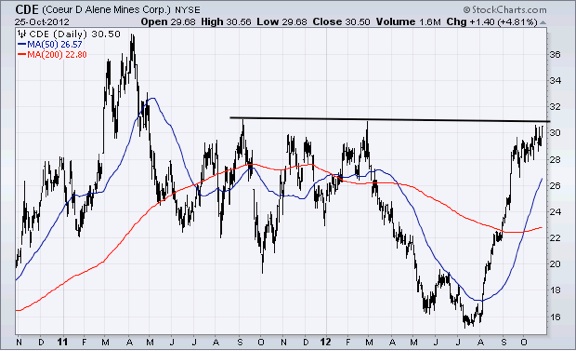
I’ve been so busy moaning about the lagging gold mining stocks that I totally forgot about the silver stocks. I’ve been saying repeatedly that silver is “dirt cheap” but I neglected to look at the silver stocks that were selling at prices that were cheaper than dirt.
But wait — why have silver stocks been rocketing higher? Some shrewd operators must believe that silver is about to make a big move skyward. And if silver is going to surge, then the silver move should rub off on gold. One ounce of gold now buys a fat 53.4 ounces of silver.
Silver is still selling on the bargain table, and the silver stocks were selling below bargain table prices. But look at the silver stocks now. Something BIG could be brewing. Maybe it’s time to buy GDX and GDXJ or even SLV. Silver, the “forgotten” commodity, is coming into its own. How do we know that? The silver stocks are telling us so.
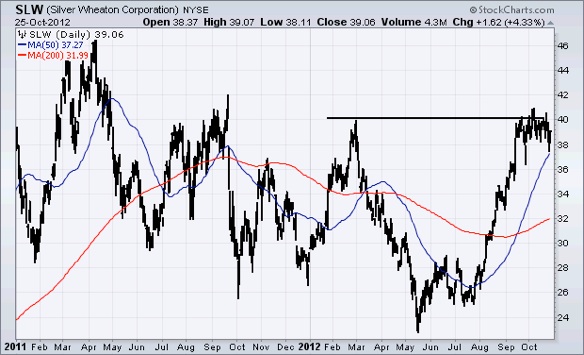
And here’s Silver Wheaton, having moved nicely from around 2 to 40. Lesson — Buy ’em when they’re dead, and when nobody wants ’em.
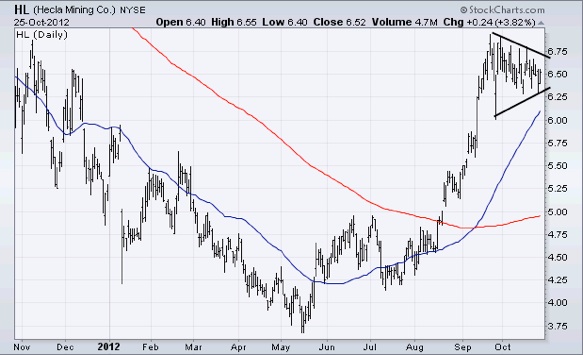
Below is Hecla — in a symmetrical triangle, which should soon break out to the north.
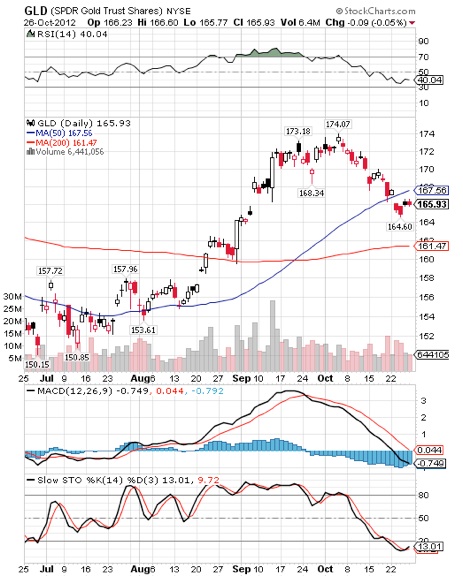
Below — GLD, my proxy for gold. Moving averages are on a bullish “golden cross” with the histograms for MACD in the process of turning up. Slow stochastics, just off the bottom are in the process of turning up.
To subscribe to Richard Russell’s Dow Theory Letters CLICK HERE.

Most important gold peaks of the past 40 years occurred well after the monetary backdrop had turned gold-bearish
In the October 1st weekly update, we described three signs that will likely be seen at around the time of, or just prior to, gold’s ultimate price top. First, we said that by the time the ultimate top of gold’s bull market is close at hand the general public will have given up on the idea that returning to economic health requires more money-printing, more government spending and more debt. The purveyors of such economic quackery will still have their fans, but they will most definitely be in the minority. Second, we reiterated the historical fact that the most important gold peaks of the past 40 years occurred well after the monetary backdrop had turned gold-bearish. We then said that as a consequence of gold’s tendency to follow major changes in the monetary situation, gold probably won’t reach its ultimate top until well after the Fed stops trying to ‘stimulate’ the economy using cheap credit and money-pumping. Third, we cited the strong tendency observed under the current monetary system for long-term bull markets to go to absurd extremes and culminate in spectacular upside blow-offs during their final 12 months.
Not one of these three signs has been evident during the past few years. Furthermore, based on the time it would take for the above-mentioned signs to appear it is reasonable to conclude that gold’s ultimate price top lies a minimum of two years into the future.
We are revisiting this topic today because our October 1st commentary omitted an important indicator of a gold top. It’s an indicator we’ve included in many TSI commentaries over the past 10 years that for some unknown reason escaped our most recent discussion of what to look for when trying to determine if gold’s bull market is nearing its end. We are referring to the relationship between gold and the U.S. stock market. The relationship is illustrated below and can be expressed as follows: Secular trends in the Dow Industrials Index relative to gold go hand-in-hand with secular trends in stock market valuation (represented on the following chart by the S&P 500’s price-to-peak-earnings ratio, also known as the Hussman P/E). Due to this relationship, gold probably won’t be close to a major peak relative to the Dow until after the SPX’s Hussman P/E makes a prolonged move to single digits. To put it more succinctly, near a major gold top the U.S. stock market will be very under-valued.
Note that the relationship between gold and the stock market isn’t just a coincidence. It stems from gold being the world’s most durable, transportable and widely accepted store of value. As other investments fall out of favour (as indicated, for example, by a long-term downward trend in the U.S. stock market’s P/E ratio) there is an increase in demand for the store-of-value function that gold has provided with great success for thousands of years.

The U.S. stock market is not remotely close to being undervalued at this time. Therefore, the link between gold and the U.S. stock market’s valuation is sending the same signal as the other indicators of a major gold top, which is that a major gold top is probably still years away.
Regular financial market forecasts and analyses are provided at our website:
http://www.speculative-investor.com/new/index.html
We aren’t offering a free trial subscription at this time, but free samples of our work (excerpts from our regular commentaries) can be viewed at: http://www.speculative-investor.com/new/freesamples.html

In the aftermath of Hurricane Sandy, President Obama declared Washington, DC a “disaster area.” But I think we knew that already. Marc Faber provides the details below…In the aftermath of Hurricane Sandy, President Obama declared Washington, DC a “disaster area.” But I think we knew that already. Marc Faber provides the details below…..
Disaster Area
by Marc Faber
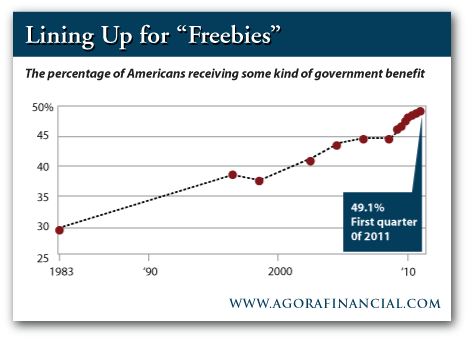
In order to exercise control over the population, governments throughout history have made people dependent on government largess. A government can make an increasing number of people dependent on its generosity by providing more and more benefits to a larger and larger share of the population.
Because of these “freebies,” people will go along with the government’s enlargement as a percent of the economy. The masses believe in their free lunch and because the business elite knows it can profit from the growth in government.
However, there comes a point at which the “nanny state” becomes unviable. Raising taxes to pay for the freebies become problematic. Fortunately for the governments, they have a Treasury and/or a central bank that can print money and monetize the government’s debts.
As Ludwig von Mises observed in Human Action:
Credit expansion is the government’s foremost tool in their struggle against the market economy. In their hands is the magic wand designed to conjure away the scarcity of capital goods, to lower the rate of interest or to abolish it altogether, to finance lavish government spending, to expropriate the capitalists, to contrive everlasting booms, and to make everybody prosperous.
Therefore, the broad population, whose attention will be distracted by the media, won’t realize the negative consequences of large fiscal deficits. They will hardly notice their declining standard of living due to the loss of purchasing power of the currency. In the meantime, the media will bombard them with further immaterial news, such as which Hollywood star is divorcing whom, which team will win the Super Bowl, and abortion rights and gay marriage issues.
The government will also become involved in larger distractions, such as arguing for the need to eliminate continuously new (usually invented) threats or foes arising from ethnic or religious minorities, communists, socialists, terrorists, spies, or, as is now the case in the US, the “vicious” 1% of the population that lives well.
A political system controlled by an ignorant electorate that is manipulated by a dishonest and controlled media that dispenses propaganda on behalf of a corrupt political establishment can hardly be the path to lasting prosperity.
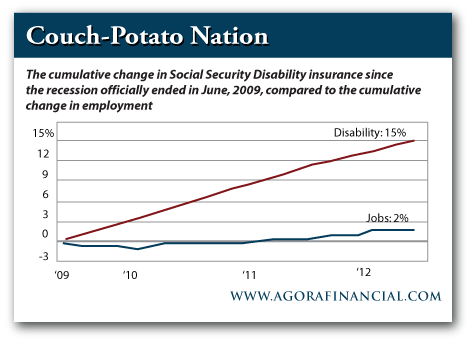
In fact, I am surprised that economists continue to discuss GDP growth (usually in real terms), when they should be focusing on sustainable growth. Let me explain. Since 2000, US government debt has increased from US$5 trillion to over US$16 trillion. Over the same period, nominal GDP is up from approximately US$9.5 trillion to US$15.5 trillion.
In my opinion, an adjustment to GDP should be made for the increase in government as well as household debt, because both inflate GDP figures, but are not sustainable in the long run, as we now know from some peripheral European countries. I mention this because Eric Fry, writing for The Daily Reckoning, points out the following:
During the last four years, the number of Americans on food stamps has soared by more than 17 million, while the number of employed Americans has dropped by more than 3 million. In percentage terms, the number of Americans on food stamps has soared 60% in four years!… In fact, according to the “Outreach” section of the USDA [US Department of Agriculture] website, the soaring number of food stamp recipients is an absolutely fantastic success story: “SNAP (i.e. food stamps) is the only public benefit program which also serves as an economic stimulus, creating an economic boost that ripples throughout the economy when new SNAP benefits are redeemed. By generating business at local grocery stores, new SNAP benefits trigger labor and production demand, ultimately increasing household income and triggering additional spending.”
There you have it. The government increases its borrowings (through fiscal deficits) in order to pay for, among other things, food stamps. In turn, the food stamp recipients go and spend the money in stores (mostly at Wal-Mart), which boosts GDP. But is this real, sustainable GDP growth?
So, not only do fiscal deficits allow the government to expand useless and unproductive programs and expenditures that artificially boost GDP, but they also increase the number of bureaucrats who implement the new regulations that stifle business. To the neo- Keynesians, I can only say: “Well done.”
Regards,
Dr. Marc Faber
for The Daily Reckoning
More Articles at The Daily Reckoning:
- Fracking Regulation And Its Impact On America’s Energy Boom
- Storm Economics in One Lesson
- What a Stunning Comeback!
Here at The Daily Reckoning, we value your questions and comments. If you would like to send us a few thoughts of your own, please address them to your managing editor at joel@dailyreckoning.com” target=”_blank”>joel@dailyreckoning.com
“Watch then as gold trades toward $1,700 and toward 1,300 (euros), for we fear that under there shall be severe stop losses that shall be touched off…sufficient to send gold perhaps to $1,625-$1,635 and toward 1,245-1,255 (eruos)/oz”.
NEW YORK (Commodity Online): Investor and newsletter writer Dennis Gartman suspects that a large number of sell stops in gold are likely building below $1,700 and 1,300 euros per ounce.
Stops are pre-placed orders to buy or sell when certain chart points are hit, often used by traders to exit trades that are going against them.
Gartman describes himself as currently holding a “core” position in gold rather than being aggressively long. He looks for central banks to remain buyers during periods of weakness but not to chase the market higher.
Global gold prices are higher in trading early on Wednesday. Some bargain hunters have stepped in to buy the dip, and some short covering is also seen. The major storm shut down most of the U.S. eastern seaboard, including New York City, that had traders all over the world waiting for the New York markets to reopen.
At 1:16 EST or 10:16 PST December gold last traded up $12.80 at $1724.9 an ounce on the Comex division of the New York Mercantile Exchange. December Comex silver last traded up $0.54 at $32.35 an ounce.
Mark Leibovit Midday Update (9:38 PST)
PRECIOUS METALS (Spot prices):
The overall strategy here is to be looking for a significant long entry trading entry point sometime between now or just after the election based on seasonal studies.
Gold is up today 14.10 at 1723.10.
Silver is up .59 today at 32.34.
Platinum is up 21.00 at 1567.00.
Palladium is up 11.00 at 605.00.
Should weakness resume (gold under 1697.20 and silver under 31.44) into early November, theoretical retracement levels in gold are now 1676 and 1642 with 31.27, 30.05, 29.63, 28.96 and 28.50 outstanding in silver.
That said, we are long CEF, GDX and GDXJ here anyway.
If you don’t own the precious metals, anytime is a good time to buy them. The expression goes: ‘Don’t wait to buy gold – buy gold and wait’!
Do you subscribe to the Leibovit VR Gold Letter? I hope so. Here is the link:
www.vrgoldletter.com The October 26 edition has been sent to subscribers this morning. New subscribers receive a 50% discount during the first month.
Leibovit’s CANADIAN NEWS:
The TSX is up 66.27 at 12,443.72 or +0.54% and the TSX Venture is up 7.51 at 1,210.43 or +0.58%. The Canadian Dollar (using FXC) is down .23 at 99.43or -0.23%, trading as high as 102.96 on September 14. The U.S. Dollar Index is up .006 at 79.937. Its recent low was posted on September 14th at 78.601. I’ve been of the view that we’re going to see a new low in the Dollar Index, following the October correction or after the Presidential Election.
Canada’s economy slipped into reverse in August, the first decline in six months, led lower by the manufacturing and energy sectors, Statistics Canada said Wednesday. Gross domestic product contracted by 0.1% during the month, following a 0.2% gain in July. Economists had expected the economy to match that growth in August. August marked the first monthly decline since February, and lends credence to the view that higher interest rates are a long way off. Canada’s economic growth remains on track for the year despite unexpectedly weak gross domestic product data for August, Finance Minister Jim Flaherty said Wednesday. The Bank of Canada, in its quarterly Monetary Policy Report released last week, was still predicting growth of 2.2% for all of 2012. The central bank’s outlook for next year is 2.3% and 2.4% in 2014.
Bulletin
WATCH THE MOVIE: 2016 HERE! A must see!
VRTRADER.COM Trial Signup: Use this month to kick our tires. Pay 50% for the first 30 days (No refund) and sample our Silver or Platinum service and then decide what works best for you. Just send an email to mark.vrtrader@gmail.com” or call 928-282-1275
IF YOU HAVE NOT SIGNED UP FOR THE LEIBOVIT VR GOLD LETTER, HERE IS YOUR CHANCE. THE October 5th EDITION IS HOT OFF THE PRESS. HERE IS THE LINK: WWW.VRGOLDLETTER.COM. YOU GET A 50% DISCOUNT FOR THE FIRST MONTH.


-
I know Mike is a very solid investor and respect his opinions very much. So if he says pay attention to this or that - I will.
~ Dale G.
-
I've started managing my own investments so view Michael's site as a one-stop shop from which to get information and perspectives.
~ Dave E.
-
Michael offers easy reading, honest, common sense information that anyone can use in a practical manner.
~ der_al.
-
A sane voice in a scrambled investment world.
~ Ed R.
Inside Edge Pro Contributors

Greg Weldon

Josef Schachter

Tyler Bollhorn

Ryan Irvine

Paul Beattie

Martin Straith

Patrick Ceresna

Mark Leibovit

James Thorne

Victor Adair