
Bonds & Interest Rates
Investing to beat the coming blow up in the bond markets and you are not going to get a warning first!
It’s instructive to read that legendary bond investor Jeffrey Gundlach is predicting a blow up in global bond markets in a lengthy interview on Bloomberg this weekend (click here).
You don’t need to be a genius to spot the greatest boom of several centuries in bonds. Interest rates paid on bonds are at an all-time low, so that means the value of the bonds that pay them is at an all-time high.
Gundlach, who correctly predicted the subprime mortgage disaster, has a proven record as a prognosticator — and the performance numbers to go with it. At his former firm, TCW Group Inc., his Total Return Bond Fund earned an annual average of 7.9 percent in the decade ended in November 2009, according to data compiled by Bloomberg.
His flagship $35.8 billion DoubleLine Total Return Bond Fund (DBLTX) gained an annual average of 13.2 percent from its inception in April 2010 through Nov. 28, topping the performance of Gundlach’s more famous neighbor to the south, Bill Gross.
The Bond Bubble

….read more HERE


Most equity markets in the world and major sectors are recovering from oversold lows set on November 16th. Sectors with favourable seasonality are responding, but currently are slightly overbought. Preferred strategy is to accumulate favoured sectors on weakness for a recovery rally that is likely to last at least until Inauguration Day.
The earnings focus this week is on Canada’s banks. Royal Bank kicked off the period with better than expected fiscal fourth quarter results.
Economic news this week is expected to be mildly bearish for equity markets. Most data points will show weakness relative to October results mainly due to Hurricane Sandy.
Short term momentum indicators for most equity and sector indices are overbought, but have yet to show signs of peaking.
Negotiations to resolve the Fiscal Cliff will continue to have a significant impact on equity markets. Parameters for a settlement are being set. Obama’s opening gambit is to play hardball with the Republicans. A deal was almost completed in the summer of 2011 when a $800 billion revenue increase and a three for one spending cut to revenue increase was reached. Now, Obama is asking for a $1.6 trillion revenue increase, a possible $400 billion spending cut in the future and an immediate $50 billion spending increase as well as a suspension on the debate on the government deficit limit. Look for lots of stock market volatility as each party proclaims their changing position as December 31st approaches. Time is running out. Congress is scheduled to start its Christmas break at the end of next week. Chances are high that an interim agreement will be reached, but with a promise to tackle the major issues after the next Congress is installed following Inauguration in the third week in January.
The spending of large cash positions held by corporations has started. As of Friday, 173 listed companies had declared either a special dividend or an early quarterly dividend payable before the end of the year. The move is designed to reduce tax liability on dividends in anticipation of a much higher tax rate next year than the current15% rate. If dividend income becomes entirely taxable income, the rate (including the Obamacare surcharge on investment income) can go as high as 41% for investor in the top tax rate. More disturbing is the action by some companies who declared large one time dividend distributions. Instead of investing in infrastructure that will generate corporate growth, companies are choosing to avoid increasing regulation, taxation, judicial proceeding, environmental restrictions and general corporate naysaying by the Obama administration by distributing their cash. The trickle of cash spending could become a flood after terms of the Fiscal Cliff are known. Corporations do not respond well to unstable corporate environments. Anything other than a “grand plan” designed to encourage corporate growth within a clearly defined regulatory environment will not be accepted well by equity markets beyond the short term. In the short term equity prices are responding favourably to the cash distributions (e.g. Costco) and likely will continue to do so before year-end.
North American equity markets have a history of moving higher between U.S. Thanksgiving and the end of the year. Average gain per period since 1928 is 1.8%. The trade has been profitable 80% of the time. The month of December historically has been one of the strongest months of the year. Most of the gains have been recorded in the second half of the month (i.e. Santa Claus rally) after tax loss pressures have been relieved. More information on equity markets in December will be offered in tomorrow’s Tech Talk.
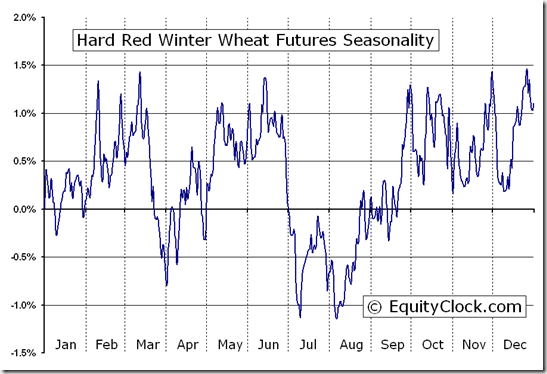
Sectors with positive seasonality at this time of year are outperforming the S&P 500 Index including agriculture, forest products, industrials, home builders, technology, semiconductor, biotech and Europe.
The TSX Composite Index added 26.12 points (0.21%) last week. Intermediate trend is down. Support is at 11,761.34. The Index remains above its 20 and 200 day moving averages and below its 50 day moving average. Short term momentum indicators are trending up. Stochastics already are overbought, but have yet to show signs of peaking. Strength relative to the S&P 500 Index has changed from neutral to negative.

The S&P 500 Index gained 7.03 points (0.50%) last week. Intermediate trend is down. Support is at 1,343.35. The Index remains above its 20 and 200 day moving averages. Short term momentum indicators are trending up. Stochastics are overbought, but have yet to show signs of peaking.
The AMEX Gold Bug Index fell 12.68 points (2.74%) last week. Intermediate trend is down. Support is at 430.69. The Index remains below its 20, 50 and 200 day moving averages. Short term momentum indicators are mixed. Strength relative to gold is negative, but showing early signs of change.

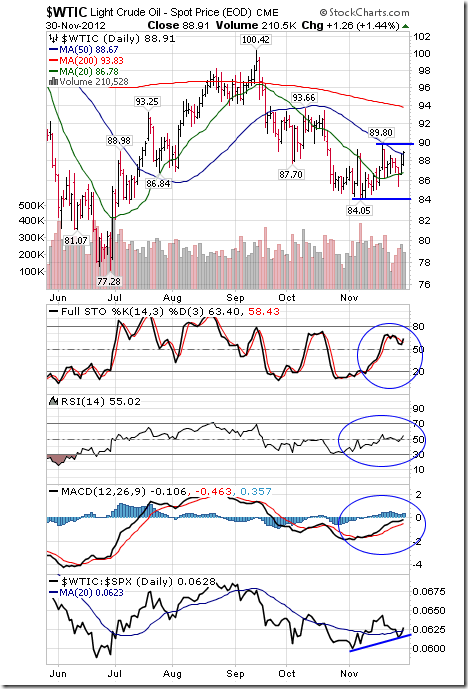
Crude Oil added $0.63 (0.71%) last week. Intermediate trend is neutral. Support is at 84.05 and resistance is at 89.90. Crude remains above its 20 day moving average and moved above its 50 day moving average on Friday. Short term momentum indicators are trending up. Strength relative to the S&P 500 Index remains positive.
The U.S. Dollar slipped 0.04 (0.05%) last week. Support is at 78.60 and resistance is forming at 81.46. The Dollar remains below its 20 and 200 day moving averages and above its 50 day moving average. Short term momentum indicators are trending down. Stochastics are oversold, but have yet to show signs of bottoming.

……many more charts and commentary HERE

Before I get to my analysis of the key markets, today I want to digress a bit and discuss what I call the “idiocy of raising taxes.”
Especially taxes on dividends. It offers a great example of how raising taxes can backfire, and how Washington’s bureaucrats don’t have a clue about what they’re doing.
Consider the various economic gurus who say raising taxes on dividends and capital gains won’t impact investor behavior or the economy. That’s pure hogwash.
To see why, just consider the companies that are busy cashing out their investments ahead of a tax hike January 1 …
Costco (COST), the giant wholesaler, announced Wednesday that it will pay a special dividend of $7 a share — or $3 billion in total cash — before the end of the year. As a result, Costco shareholders will only pay the current 15% tax on dividends, rather than the 39.6% rate scheduled to kick in next year.
That represents a tax savings of $738 million for Costco shareholders, 24.6% less taxes they have to pay on the $3 billion payout.
Or put another way, it’s $738 million the U.S. Treasury will NOT get.
Costco isn’t the only company cashing out before year-end. According to the Wall Street Journal, as of last Wednesday, 173 companies had announced special dividends, compared to only 72 in the same period a year ago.
n the Russell 3000 Stock Index, from just September to mid-November, 59 companies declared one-time special dividends, four times last year’s pace.
Howard Silverblatt of S&P Dow Jones Indices stated, “I find no precedent like this at all going all the way back to the 1950s.”
Wal-Mart (WMT) did the same thing last week, moving up its expected $1.34 billion dividend payout next year to this year. That’s another $319 million the Treasury won’t get.
And mind you, the figures above don’t even include the 3.8% ObamaCare surcharge that households making more than $250,000 next year will save by getting their dividends this year.
You can bet that many more companies will be doing the same in the days and weeks ahead, accelerating next year’s dividend payouts to this year.
And it’s all money the U.S. Treasury will NOT get as a result.
Moreover, the long-term consequences of a higher dividend tax starting in January will be that fewer and fewer companies will pay dividends at all, while others will reduce their payouts.
Which again, all translates into less money for the U.S. Treasury, precisely the opposite of what it wants.
Consider history. According to the Wall Street Journal, dividend payouts rose only modestly in the 1980s and 1990s when they were taxed as ordinary income.
But when the Bush tax cut chopped the rate to 15% on January 1, 2003, dividends reported on tax returns nearly doubled to $196 billion in 2003 from $103 billion in 2002.
By 2006, reported dividend income hit $337 billion — more than three times the pre-tax-cut level.
In other words, when tax rates were cut, the Treasury received more tax income. If they are raised, the Treasury will get LESS tax receipts.
You don’t need to be a rocket scientist to figure it out. Raising taxes, in any form in my opinion, is pure idiocy.
It also applies to capital gains.
When the capital gains rate last rose, to 28% from 20% as part of the 1986 tax reform, investors also cashed in before the higher rate took effect.
Tax revenue from capital gains in 1986 soared to $52.9 billion, then plunged to $33.7 billion in 1987 and stayed largely flat for nearly a decade. It boomed again after Bill Clinton and Newt Gingrich agreed to return the rate to 20% in 1997.
Again, it’s a simple formula: When government raises taxes on dividends and capital gains, it lowers the after-tax return on stocks.
 That in turn reduces the wealth in the private economy. And not just among the rich. It will affect almost everyone.
It’s also why I remain largely bearish most markets in the short- to intermediate-term.
The Dow is hovering below important resistance at the 13,400 level, and looking like it’s about to break down. Ditto for the S&P 500.

Gold is starting to weaken again, unable to take out resistance at the $1,755 to $1,760 level. A break of the $1,700 level should lead to new lows.

Oil is having trouble at the $90 level. Look for it to top out soon and head back down.

Silver is going to hit a stiff wall of resistance at the $34 to $35 level and a plunge down to $26 — and lower — is still in the cards.

Bottom line: Don’t be surprised when you see Washington’s tax receipts plummet next year and the deficit widen and the national debt get worse. The idiots in Washington, again, just simply do not have a clue what they are doing.
ALL of this virtually guarantees that 2013 will be the wildest ride any of us has ever seen.
That’s why it’s so important you join us today for our urgent online conference, America’s Date with Destiny: 11 Shocking Forecasts for 2013!
About 15 minutes before 2 p.m. Eastern today, click this link to check your browser’s compatibility and connection.
If you have trouble accessing the link above, please copy and paste this link into your Internet browser. The link may span two lines, so be sure to copy the entire URL with no spaces into your browser: http://www.gliq.com/cgi-bin/click?weiss_martin+2013-TWE-countdown+++g446+5384161
Then, simply make sure your computer speakers are turned up. America’s Date with Destiny: 11 Shocking Forecasts for 2013 will begin promptly at 2 p.m. Eastern Time (11 a.m. Pacific; 7 p.m. GMT).
I look forward to seeing you there!
Stay safe, and best wishes,
Larry

We don’t hear much about gold and silver anymore on the news. This time last year you could not go 5 minutes without a TV or radio station talking about them. Why is this? Simple really, precious metals have been building a Stage 1 Basing Pattern for the last 12 months. This boring sideways trading range is how the market gets most of those long holders out of an investment before it starts another move up. The saying is “If the market doesn’t shake you out, it will wait you out”.
We all know time in money so the above statement makes a lot of sense doesn’t it? Instead of having your money sitting in an investment that has clearly displayed a large sideways range with month and possibly years before any significant breakout will occur, why would you want their money in it doing nothing? There are other opportunities which you could be putting your money into that could generate more gains until the precious metals sector sets up with a high probability trading pattern.
The good news is that gold, silver and precious metal miner stocks are forming a very large Stage 1 Accumulation pattern on the weekly chart. This points to a multi month rally in prices if they breakout above our resistance levels.
Gold & Gold Miner Stocks Weekly Analysis:
The chart below shows a lot of analysis and to the untrained eye this may look messy and confusing, so take your time to review it. In short, what I am showing are sideways price patterns using the previous highs and lows for support and resistance levels. The analysis shows the shift in prices from bearish (down), to Neutral (sideways). The exciting part about this pattern is that a new bull market should emerge if my analysis is correct. Now, I’m not talking about 5 -10% move here, I’m talking about a multi month and possibly a yearlong rally in precious metals that could allow some individuals to retire early if played properly…
A break above our red dotted resistance lines should trigger aggressive buying in gold miners along with physical gold bullion.

In the past month I have been giving out some of my Stage 1 trading ideas which have generated some decent gains for those who follow along. All but one have generated gains with FSLR 12.5%, FB 12%, RIMM 54%, AAPL 5%, TLT 2.5%, XLU 1.5%, and KOL down -5.2%. Keep in mind that you can follow my trading charts live for free and get some of my stock and ETF trading ideas here:https://stockcharts.com/public/1992897
Silver & Silver Miner Stocks Weekly Analysis:
This chart of silver and silver miner stocks (SIL), shows a very similar pattern to that of its big shiny sister (Yellow Gold). Silver carries a lot more risk because of its industrial usage. Also this commodity is thinly traded and can move very quickly on a daily basis compared to gold. Because of these quick price movements it has attracted a lot of speculative money which also has increased the volatility. More often than not silver will move 2-3 times more on a percentage bases than that of yellow gold.

Battle of the Miner ETFs Weekly Performance:
This chart compares three precious metals miner ETFS (GDX – Gold Miners, SIL – Silver Miners, NUGT 3x Leveraged Gold Miners).
Silver miners have held up the best because the herd saw how big the move was a year ago and are front running the next potential rally. But, depending on how you read the charts and sentiment it may be pointing to the dormant gold miners for a bigger than expected rally. But debating which one will breakout and run the most is a conversation/debate of its own and even I can argue both sides. The safe play is that even if gold miners (GDX & GDXJ) underperform the silver miners (SIL), the NUGT which is 3x leveraged gold miners should be the same if not outperform silver miners.

Precious Metals & Miners Trading Conclusion:
In short, I favor trading the miners over physical bullion simply because the charts show much more profit potential than if one was to buy the bullion exchange traded funds GLD and SLV.
The market seems to be setting up for some very large moves in 2013 and members of my trading newsletter should do very well. Be sure to join and follow along at www.GoldAndOilGuy.com
Chris Vermeulen


-
I know Mike is a very solid investor and respect his opinions very much. So if he says pay attention to this or that - I will.
~ Dale G.
-
I've started managing my own investments so view Michael's site as a one-stop shop from which to get information and perspectives.
~ Dave E.
-
Michael offers easy reading, honest, common sense information that anyone can use in a practical manner.
~ der_al.
-
A sane voice in a scrambled investment world.
~ Ed R.
Inside Edge Pro Contributors

Greg Weldon

Josef Schachter

Tyler Bollhorn

Ryan Irvine

Paul Beattie

Martin Straith

Patrick Ceresna

Mark Leibovit

James Thorne

Victor Adair