
Energy & Commodities
It’s been a big week for natural gas, which means one thing: big opportunity for you!
Two telling reports have dropped out of the stork’s mouth and landed on your editor’s desk.
Both have to do with the future of natural gas. And both also lead to an all-but-guaranteed way to profit from the cheap and abundant fuel source…
If you’ve been looking for a 5-year price forecast in natural gas — you’ll want to take note of the Energy Information Administration’s 2013 Annual Energy Outlook (early-release.)
“With increasing natural gas production, reflecting continued success in tapping the nation’s extensive shale gas resource, Henry Hub spot natural gas prices remain below $4 per million Btu (2011 dollars) through 2018” the report portends.
From my perch this seems to be the most realistic estimate for prices ($3-5 in the next 5 years) — especially considering we’ve barely scratched the surface of our natural gas riches. Take a look at it in chart form:

……read more HERE

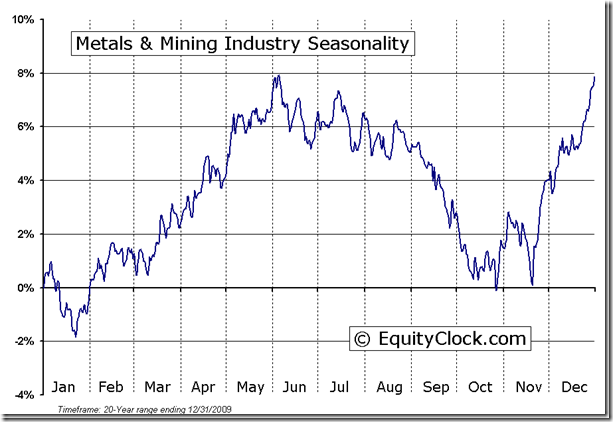
Important Continuous Contract Seasonality & also Technical Analysis for the following:
Gold Futures, Silver Futures, S&P 500 & TSE Composite Index, Bond Market Futures, Oil Market Futures, Wheat Market Futures & Metals and Mining Industry Seasonality
Note: Under each Seasonal Study is a Technical Analysis Study contributed by Don Vialoux of Timing the Market. Seasonality is a useful analytical tool. Trades based on seasonality alone are profitable in say seven or eight times out of 10, but are unprofitable in two or three times out of ten. Better to use in conjunction with technical analysis and/or Fundamental analysis to again improve the odds.
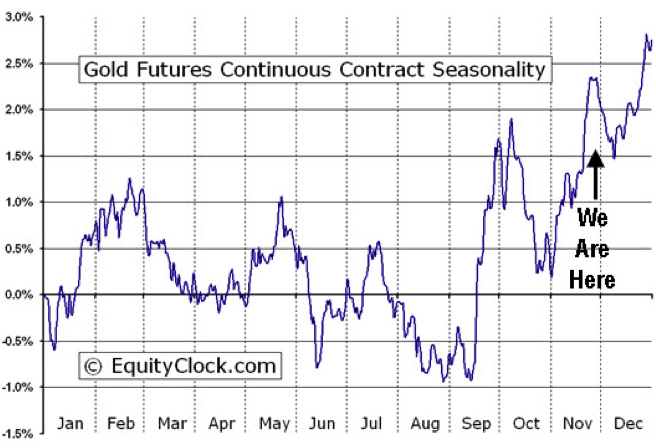
The above chart represents the seasonality for Gold Futures (GC) Continuous Contract for the past 20 years
Analysis has revealed that with a buy date of September 13 and a sell date of May 23, investors have benefited from a total return of 183.61% over the last 10 years. This scenario has shown positive results in 9 of those periods.
Conversely, the best return over the maximum number of positive periods reveals a buy date of September 16 and a sell date of May 20, producing a total return over the same 10-year range of 159.82% with positive results in 10 of those periods.
The buy and hold return for the past 10 years was 125.11%.
**Results shown are compounded
Technical Analysis of Gold
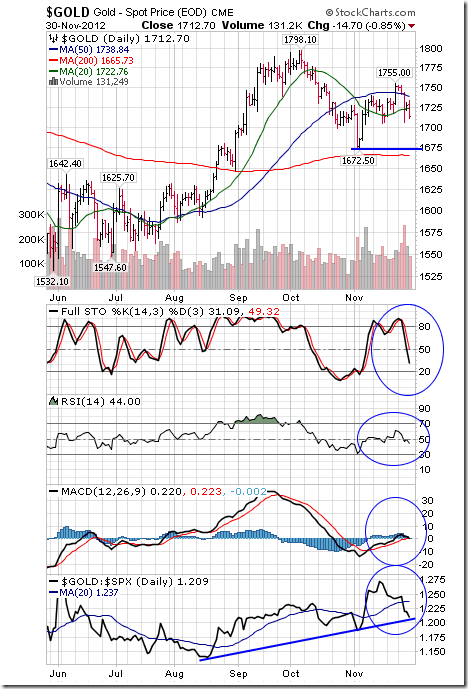
Gold fell $38.70 per ounce (2.21%) last week. Intermediate trend is up. Support is at $1,704.50. Gold remains above its 200 day moving average, but fell below its 20 and 50 day moving averages. Short term momentum indicators have rolled over and are trending down. Strength relative to the S&P 500 Index is positive, but showing signs of change.
Silver Futures Seasonality
The above chart represents the seasonality for Silver Futures (SI) Continuous Contract for the past 20 years.
Analysis has revealed that with a buy date of September 16 and a sell date of April 11, investors have benefited from a total return of 314.85% over the last 10 years. This scenario has shown positive results in 7 of those periods.
Conversely, the best return over the maximum number of positive periods reveals a buy date of September 14 and a sell date of September 23, producing a total return over the same 10-year range of 55.36% with positive results in 10 of those periods.
The buy and hold return for the past 10 years was 105.43%.
**Results shown are compounded
Technical Analysis of Silver
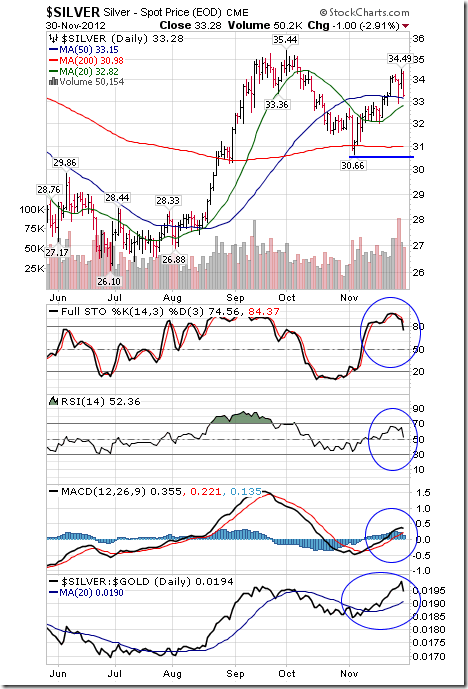
Silver fell $1.84 (5.39%) last week. Intermediate trend is neutral. Support is at $30.66. Silver remains above its 20, 50 and 200 day moving averages. Short term momentum indicators are overbought and showing early signs of rolling over. Strength relative to gold remains positive.
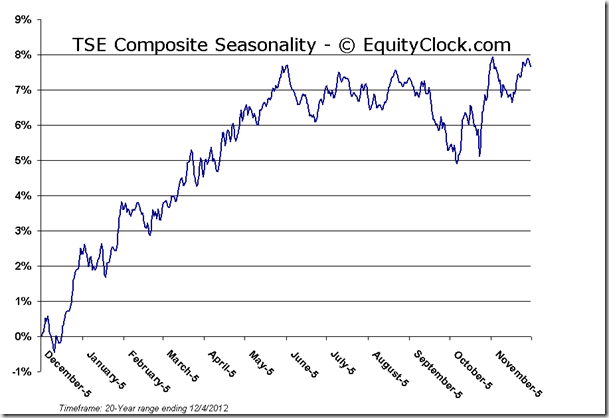
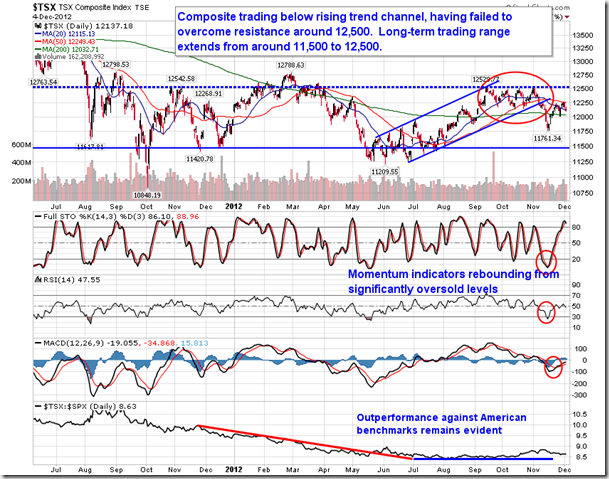
Seasonality & Technical Analysis of the TSE Composite
S&P 500 Index Seasonality
Analysis has revealed that with a buy date of March 9 and a sell date of June 4, investors have benefited from a total return of 85.05% over the last 10 years. This scenario has shown positive results in 7 of those periods.
Conversely, the best return over the maximum number of positive periods reveals a buy date of March 12 and a sell date of June 1, producing a total return over the same 10-year range of 79.65% with positive results in 9 of those periods.
**Results shown are compounded
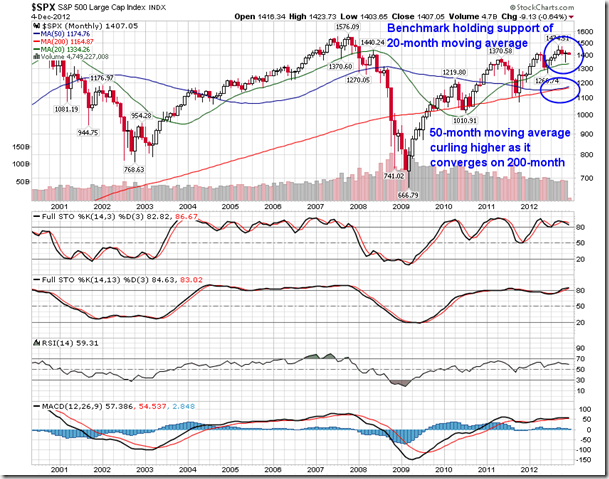
Technical Analysis of the S&P 500
With little new to report on the daily chart of the S&P 500, we turn to the monthly chart to highlight the longer-term patterns. The large cap index is holding support at the 20-month moving average, having tested that level mid-November. The 20-month moving average continues to trend higher, although the slope of the curve is flattening. More interesting is the relation of the 50-month moving average compared to the 200-month moving average. The 50-month has been showing signs converging on the 200-month all year in what would amount to a bearish crossover should the two cross. The 50—month has been recently showing signs of curling higher precisely at the 200-month in a stubborn attempt to avoid what many are calling “the ultimate death cross.” A monthly death cross is extremely rare with the first and last having been recorded in 1934. The large cap benchmark subsequently produced a golden cross in 1946 with the 50-month moving average crossing above the 200-month and has remained so ever since. The two averages came close to crossing in 1978 during the 1966 to 1982 secular bear market. The S&P 500 hit a low of 87.45 at the beginning of 1978 around the time the two averages were about to converge and rallied higher by over 60% in the three years that followed to 140.52 by the end of 1980. Will this be another close cross followed by a rally higher? Only time will tell.
10 Year U.S. T-Note Bonds Futures Continuous Contract Seasonality
The above chart represents the seasonality for the CBOE Interest Rate 10-Year T-Note (^TNX) for the past 20 years. The values presented above are level figures, and as such should be viewed inversely to that of a regular seasonal chart. In this case, the peaks represent higher yields as a result of lower prices, and the troughs represent lower yields as a result of higher prices. The investment approach under these circumstances would be to invest at an indicated peak in yields when prices are low, and sell when the yields have bottomed.
Technical Analysis of the US 10 Year Bond
The yield on 10 year Treasuries fell 8.7 basis points (5.14%) last week. Its five month range remains between 1.548% and 1.892%. Short term momentum indicators are neutral.
Crude Oil Futures Continuous Contract (CL) Seasonality
The above chart represents the seasonality for Crude Oil Futures Continuous Contract (CL) for the past 20 years.
Crude Oil Futures Continuous Contract (CL) Seasonality
Analysis has revealed that with a buy date of December 24 and a sell date of August 21, investors have benefited from a total return of 344.86% over the last 10 years. This scenario has shown positive results in 9 of those periods.
Conversely, the best return over the maximum number of positive periods reveals a buy date of December 24 and a sell date of August 30, producing a total return over the same 10-year range of 331.05% with positive results in 10 of those periods.
The buy and hold return for the past 10 years was 60.62%.
**Results shown are compounded
Technical Analysis of Oil
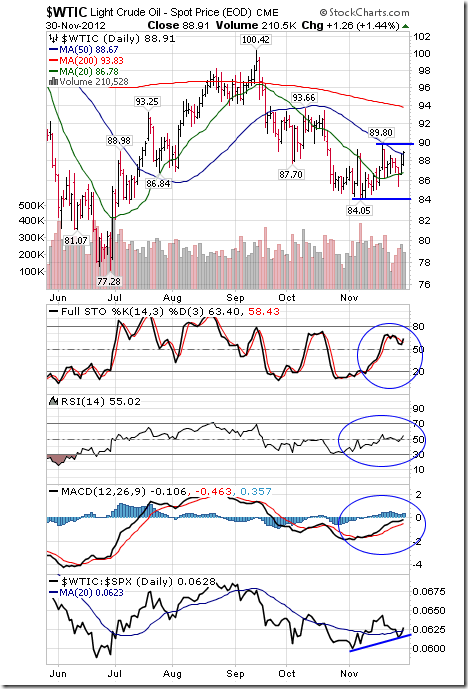
Crude Oil added $0.63 (0.71%) last week. Intermediate trend is neutral. Support is at 84.05 and resistance is at 89.90. Crude remains above its 20 day moving average and moved above its 50 day moving average on Friday. Short term momentum indicators are trending up. Strength relative to the S&P 500 Index remains positive.
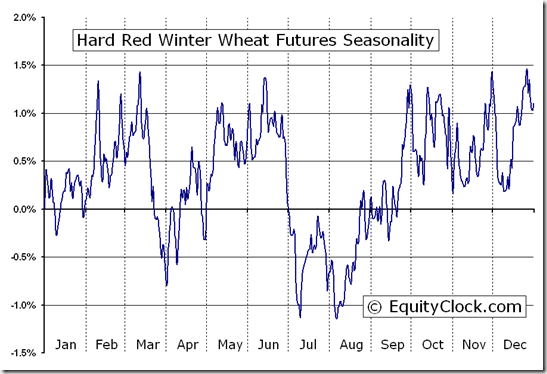
Wheat Futures Continuous Contract Seasonality
The above chart represents the seasonality for Wheat Futures (W) Continuous Contract for the past 20 years
Analysis has revealed that with a buy date of December 6 and a sell date of March 12, investors have benefited from a total return of 37.4% over the last 10 years. This scenario has shown positive results in 5 of those periods.
Conversely, the best return over the maximum number of positive periods reveals a buy date of December 6 and a sell date of January 2, producing a total return over the same 10-year range of 29.69% with positive results in 8 of those periods.
The buy and hold return for the past 10 years was -40.4%.
**Results shown are compounded
Technical Analysis of Wheat
Ed Note: I could not find an up to date Technical Analysis of Wheat. Will update as soon as I find it. This is what I could find:
The Agriculture ETF added $0.42 (0.81%) last week. Intermediate trend changed from down to neutral on a break above resistance at $51.93. Units remain above their 20, 50 and 200 day moving averages. Short term momentum indicators are trending up. Stochastics already are overbought, but have yet to show signs of peaking. Strength relative to the S&P 500 Index remains positive.
Special Free Services available through www.equityclock.com
Equityclock.com is offering free access to a data base showing seasonal studies on individual stocks and sectors. The data base holds seasonality studies on over 1000 big and moderate cap securities and indices.
To login, simply go to http://www.equityclock.com/charts/
Following is an example:
About Equity Clock
Equity Clock is a division of the Tech Talk Financial Network, a market analysis company that provides technical, fundamental and seasonality analysis on a daily basis via TimingTheMarkets.com and EquityClock.com. Equity Clock’s mission is to identify periods of reoccurring strength among individual equities in the market using methodologies presented by some of the top analysts in the industry, including that of Don Vialoux, author of TimingTheMarkets.com.
Feel free to use any of the content or seasonality studies (charts, timelines, or otherwise) presented as long as a link-back to this site at EquityClock.com is provided.
For further information on indicators used in reports presented on this site, please visit our reference page.

 Choose from conference tickets, investment videos or subscriptions. We have everything you need to survive the debt crisis – which is on its way!
In The Next Five Years There Will Be Big Losers and Big Winners – Which One Will You Be?
Make no mistake about it. There is going to be a ton of money lost in the next five years but there will also be huge opportunities and we think the first half of 2013 will be the time to position yourself.
The 2013 World Outlook Financial Conference, Feb 1 & 2, 2013 in Vancouver features top analysts from the English speaking world giving their forecasts for gold, the US and Canadian dollars, the stock markets, real estate, interest rates and the bond market. These analysts spend literally thousands of hours in preparation to be able to answer the one question they’ll all be asked: Where is the best place to make money in 2013 and beyond?
Order your ticket or before December 14th and we will include:
A Do-It-Yourself Portfolio Course (60-90 mins.) conducted by Aaron Dunn, BComm, CIM, CFA, Senior Analyst, KeyStone Financial
Equity (Stock) Allocation:
Core Income Stock Component:
Specific Stock Recommendations for 2013:
Kickstart your 2013 DIY Stock Portfolio with a couple top recommendations in each category.
CLICK HERE to order your tickets today


Conference “Get away” Special
Turn your ticket to the World Outlook Conference into a weekend get away in Vancouver at the Westin Bayshore.
The Westin Bayshore offers guests the best of both worlds: the activities and cultural events of Vancouver, as well as a relaxing resort experience. This unique duality is just one of the features that allowed The Westin Bayshore, Vancouver to be named to Condé Nast Traveler’s Gold List. Enjoy views of the coastline, distant mountains, and Stanley Park from this beautiful downtown Vancouver hotel.
 |
 |
 |
Just book your ticket for the Conference and then click on the Accomodation link to book your guest room at the Westin Bayshore.
The World Outlook Conference group block allows attendees to secure a reduced room rate that is:
- Fully refundable until 24 hours prior to check in day, with no penalty.
- Available from January 31st to Feb 4th(subject to availability), for those looking for a longer stay in the city and to sightsee.
- Includes complimentary internet (value of $14.95/day)
- Complimentary access to the Health Club
Want a REAL TREAT???? – Consider upgrading yourself to a suite and take some time to enjoy the spa. For $100 more a night, you could spend the evening in a suite, just ask about their special “upgrade rates”
 |
 |
 |
And…. if that’s not enticing enough…. Anyone who books their ticket and their accommodation at the Bayshore THIS WEEKEND will receive a “Welcome Gift” from us at the World Outlook Conference. A little decadent treat to help turn your weekend into something more than profitable.

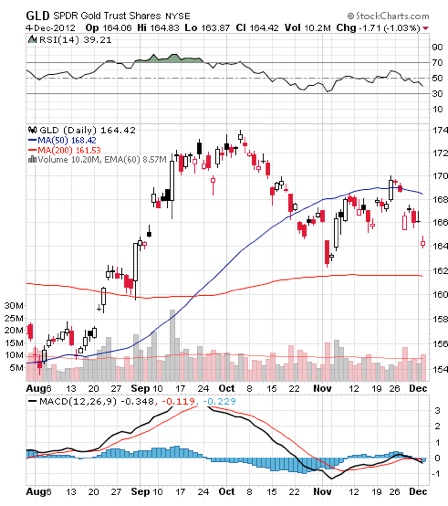
“Gold is higher in the year 2012 for its 12th year in a row (up 9% this year, so far). This year investors have fed almost $8 billion into the most popular gold ETF — GLD. One advantage for gold is that interest rates are historically low, which makes the carrying cost of gold very low and attractive.”
“In fact, compared with the inflation rate, interest rates are in the negative column, and the Fed promises to keep rates super-low for the next two years or so.
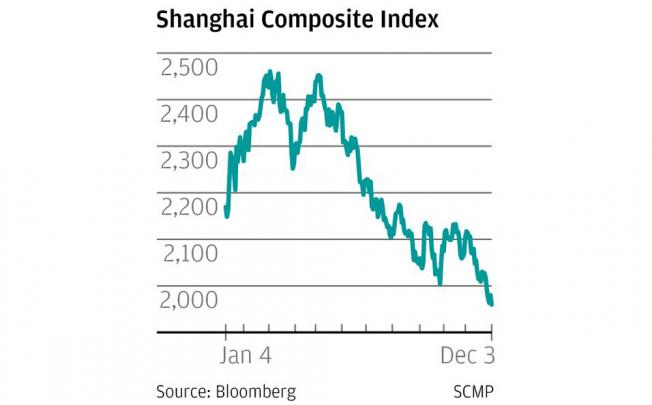
China is the great unknown as far as gold is concerned. China is on the path to make the yuan a competitive world reserve currency. I’ve long felt that China will back its currency with part-gold. But gold today represents only 2% of China’s sovereign resources. To be a reserve currency, China needs two items: (1) lots of gold, and (2) a mighty military.
Below the important Shanghai index is semi-crashing.
I’ll just hang on to my gold, and as the various junk fiat currencies fade into history, gold will shimmer and shine brighter. In its long 12-year bull market history, gold has provided we “gold-bugs” with plenty of scares, but right now I’m more worried about the Yankee Dollar than I am about gold. As I write this morning, gold (not GLD) is down only 2.00 to 1693.80. It was down further earlier, but it may now be trying to base. We’ll see how it closes. The gold mining stocks have been a constant drag on gold. Unfortunately, the gold stocks tend to go with the general market.
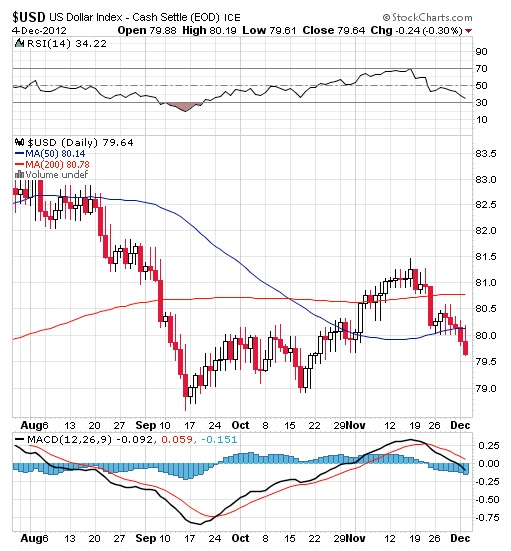
Do you like to read charts? Below is the safe-haven US dollar. I dunno, if it was a stock, I don’t think I’d buy it. Look, it just closed below its 50-day moving average. That should have been support. MACD doesn’t look that good, either. I’d swap the darn paper for gold.
At the tender age of 88, it seems that I have, at last, found God. This means that I am learning to live in the present — minus all my worries about the future. And I can tell you, it’s a huge relief to be living without all my worries.
This way of thinking and acting has taken a huge strain off me. It will probably add ten years to my life. I no longer worry about a brutal depression that “may” lie just around the corner. I live in the present, and in the present I am aware and calm and dealing with the here and now. And right now there is no depression. If a depression or some other catastrophe arrives, I’ll deal with it then.”
Richard Russell
To subscribe to Richard Russell’s Dow Theory Letters CLICK HERE.
About Richard Russell
Russell began publishing Dow Theory Letters in 1958, and he has been writing the Letters ever since (never once having skipped a Letter). Dow Theory Letters is the oldest service continuously written by one person in the business.
Russell gained wide recognition via a series of over 30 Dow Theory and technical articles that he wrote for Barron’s during the late-’50s through the ’90s. Through Barron’s and via word of mouth, he gained a wide following. Russell was the first (in 1960) to recommend gold stocks. He called the top of the 1949-’66 bull market. And almost to the day he called the bottom of the great 1972-’74 bear market, and the beginning of the great bull market which started in December 1974.
The Letters, published every three weeks, cover the US stock market, foreign markets, bonds, precious metals, commodities, economics –plus Russell’s widely-followed comments and observations and stock market philosophy.
In 1989 Russell took over Julian Snyder’s well-known advisory service, “International Moneyline”, a service which Mr. Synder ran from Switzerland. Then, in 1998 Russell took over the Zweig Forecast from famed market analyst, Martin Zweig. Russell has written articles and been quoted in such publications as Bloomberg magazine, Barron’s, Time, Newsweek, Money Magazine, the Wall Street Journal, the New York Times, Reuters, and others. Subscribers to Dow Theory Letters number over 12,000, hailing from all 50 states and dozens of overseas counties.
A native New Yorker (born in 1924) Russell has lived through depressions and booms, through good times and bad, through war and peace. He was educated at Rutgers and received his BA at NYU. Russell flew as a combat bombardier on B-25 Mitchell Bombers with the 12th Air Force during World War II.
One of the favorite features of the Letter is Russell’s daily Primary Trend Index (PTI), which is a proprietary index which has been included in the Letters since 1971. The PTI has been an amazingly accurate and useful guide to the trend of the market, and it often actually differs with Russell’s opinions. But Russell always defers to his PTI. Says Russell, “The PTI is a lot smarter than I am. It’s a great ego-deflator, as far as I’m concerned, and I’ve learned never to fight it.”
Letters are published and mailed every three weeks. We offer a TRIAL (two consecutive up-to-date issues) for $1.00 (same price that was originally charged in 1958). Trials, please one time only. Mail your $1.00 check to: Dow Theory Letters, PO Box 1759, La Jolla, CA 92038 (annual cost of a subscription is $300, tax deductible if ordered through your business).
IMPORTANT: As an added plus for subscribers, the latest Primary Trend Index (PTI) figure for the day will be posted on our web site — posting will take place a few hours after the close of the market. Also included will be Russell’s comments and observations on the day’s action along with critical market data. Each subscriber will be issued a private user name and password for entrance to the members area of the website.
Investors Intelligence is the organization that monitors almost ALL market letters and then releases their widely-followed “percentage of bullish or bearish advisory services.” This is what Investors Intelligence says about Richard Russell’s Dow Theory Letters: “Richard Russell is by far the most interesting writer of all the services we get.” Feb. 19, 1999.
Below are two of the most widely read articles published by Dow Theory Letters over the past 40 years. Request for these pieces have been received from dozens of organizations. Click on the titles to read the articles.
“Rich Man, Poor Man (The Power of Compounding)“

Oil and gas along with their equities have been underperforming for the most part of 2012 and they are still under heavy selling pressure.
I watch the oil futures chart very closely for price and volume action. And the one thing that is clear for oil is that big sellers are still unloading copious amounts of contracts which is keeping the price from moving higher. Oil is trading in a very large range and is trending its way back down the lower reversal zone currently. Once price reverses back up and starts heading towards the $100 and $105 levels it will trigger strong buying across the entire energy sector.
Crude Oil, Energy & Utility Sector Chart – Weekly Time Frame
The chart below shows the light crude oil price along with the energy and utilities sectors. The patterns on the chart are clearly pointing to higher prices but the price of oil must show signs of strength before that will happen. Once XLE & XLU prices break above their upper resistance levels (blue dotted line) they should takeoff and provide double digit returns.

Looking at the XLU utilities sector above I am sure you noticed the steady rise in the price the last couple of years. This was a result in the low interest rates in bond price and a shift from investors looking for higher yields for their money. Utility stocks carry below average risk in the world of equities and pay out a steady and healthy dividend year after year. So this is where long term investment capital has/is being parked for the time being.
Utility Stock Sector – Deeper Look – 2 Hour Candle Chart Time Frame
Last week I covered utility stocks in detail showing you the Stage 1 – Accumulation base which they had formed. The chart below shows the recent price action on the 2 hour candle chart and recent run up. You can learn more about how to take advantage of this sector here:http://www.thegoldandoilguy.com/articles/its-the-season-to-own-utility-stocks/

Oil and Gas Services – Daily Time Frame
This chart shows a very bullish picture for the services along with its relative strength to oil (USO) at the bottom. While the sector looks a little overbought here on the short term chart, overall it’s pointing to much higher prices.

Energy Sector Conclusion:
In short, crude oil looks to be trading in a VERY large range without any sign a breakout above or below its channel lines for several months at the minimum. But if the lower channel line is reached and oil starts to trend up then these energy related sector ETFs should post some very large gains and should not be ignored.
Get These Weekly Trade/Investment Ideas In Your Inbox FREE: www.TheGoldAndOilGuy.com
Chris Vermeulen

-
I know Mike is a very solid investor and respect his opinions very much. So if he says pay attention to this or that - I will.
~ Dale G.
-
I've started managing my own investments so view Michael's site as a one-stop shop from which to get information and perspectives.
~ Dave E.
-
Michael offers easy reading, honest, common sense information that anyone can use in a practical manner.
~ der_al.
-
A sane voice in a scrambled investment world.
~ Ed R.
Inside Edge Pro Contributors

Greg Weldon

Josef Schachter

Tyler Bollhorn

Ryan Irvine

Paul Beattie

Martin Straith

Patrick Ceresna

Mark Leibovit

James Thorne

Victor Adair