

Important Continuous Contract Seasonality & also Technical Analysis for the following:
Gold Futures, Silver Futures, S&P 500 & TSE Composite Index, Bond Market Futures, Oil Market Futures, Wheat Market Futures & Metals and Mining Industry Seasonality
Note: Under each Seasonal Study is a Technical Analysis Study contributed by Don Vialoux of Timing the Market. Seasonality is a useful analytical tool. Trades based on seasonality alone are profitable in say seven or eight times out of 10, but are unprofitable in two or three times out of ten. Better to use in conjunction with technical analysis and/or Fundamental analysis to again improve the odds.
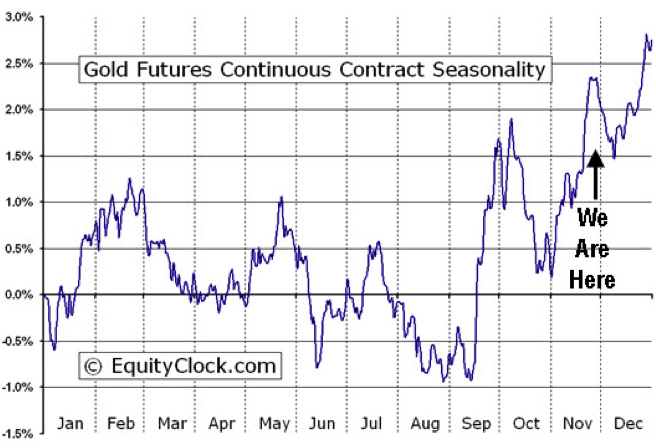
The above chart represents the seasonality for Gold Futures (GC) Continuous Contract for the past 20 years
Analysis has revealed that with a buy date of September 13 and a sell date of May 23, investors have benefited from a total return of 183.61% over the last 10 years. This scenario has shown positive results in 9 of those periods.
Conversely, the best return over the maximum number of positive periods reveals a buy date of September 16 and a sell date of May 20, producing a total return over the same 10-year range of 159.82% with positive results in 10 of those periods.
The buy and hold return for the past 10 years was 125.11%.
**Results shown are compounded
Technical Analysis of Gold
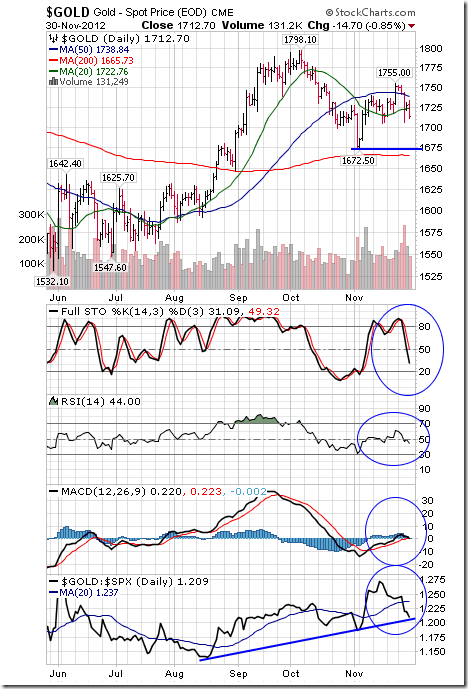
Gold fell $38.70 per ounce (2.21%) last week. Intermediate trend is up. Support is at $1,704.50. Gold remains above its 200 day moving average, but fell below its 20 and 50 day moving averages. Short term momentum indicators have rolled over and are trending down. Strength relative to the S&P 500 Index is positive, but showing signs of change.
Silver Futures Seasonality
The above chart represents the seasonality for Silver Futures (SI) Continuous Contract for the past 20 years.
Analysis has revealed that with a buy date of September 16 and a sell date of April 11, investors have benefited from a total return of 314.85% over the last 10 years. This scenario has shown positive results in 7 of those periods.
Conversely, the best return over the maximum number of positive periods reveals a buy date of September 14 and a sell date of September 23, producing a total return over the same 10-year range of 55.36% with positive results in 10 of those periods.
The buy and hold return for the past 10 years was 105.43%.
**Results shown are compounded
Technical Analysis of Silver
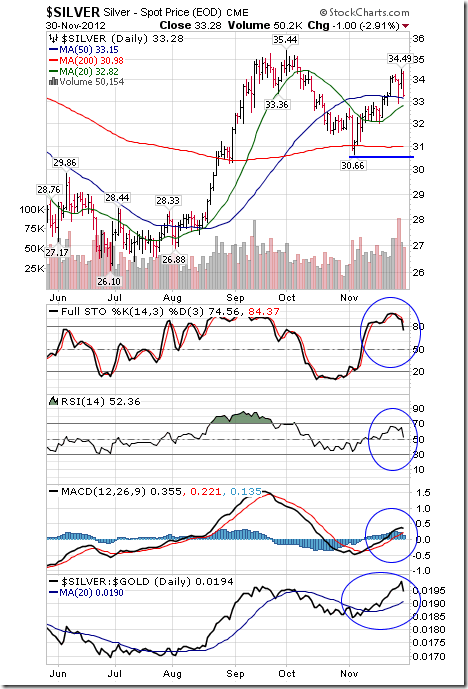
Silver fell $1.84 (5.39%) last week. Intermediate trend is neutral. Support is at $30.66. Silver remains above its 20, 50 and 200 day moving averages. Short term momentum indicators are overbought and showing early signs of rolling over. Strength relative to gold remains positive.
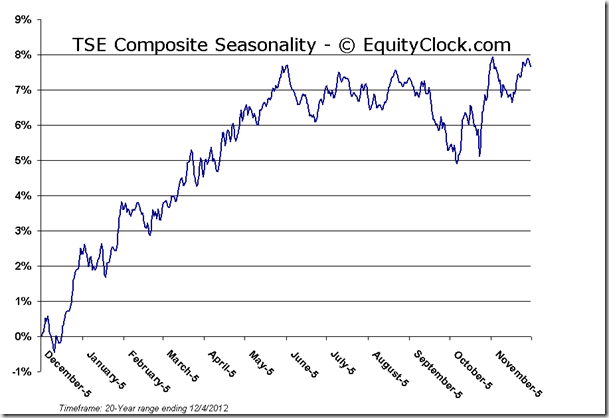
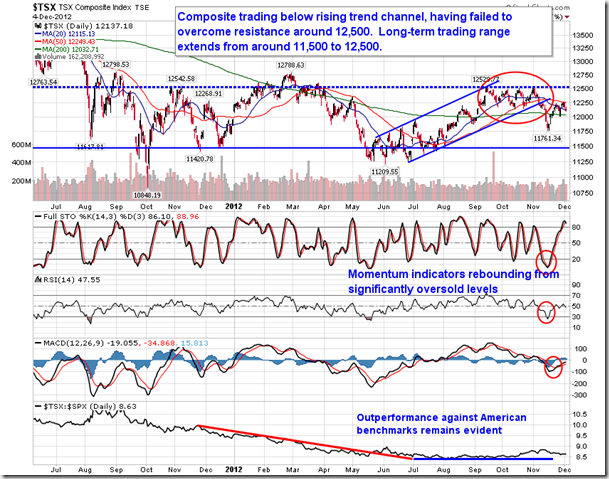
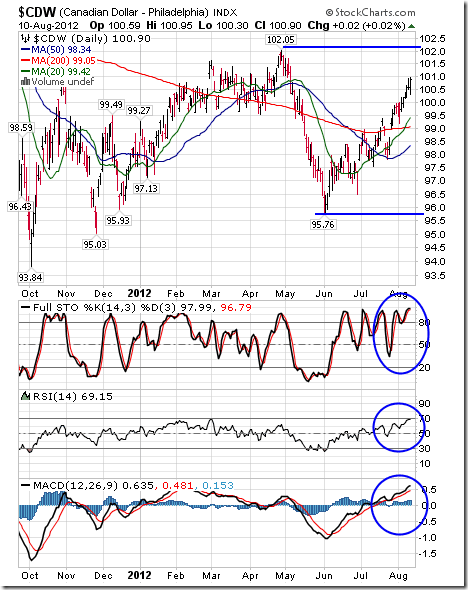
Seasonality & Technical Analysis of the TSE Composite
S&P 500 Index Seasonality
Analysis has revealed that with a buy date of March 9 and a sell date of June 4, investors have benefited from a total return of 85.05% over the last 10 years. This scenario has shown positive results in 7 of those periods.
Conversely, the best return over the maximum number of positive periods reveals a buy date of March 12 and a sell date of June 1, producing a total return over the same 10-year range of 79.65% with positive results in 9 of those periods.
**Results shown are compounded
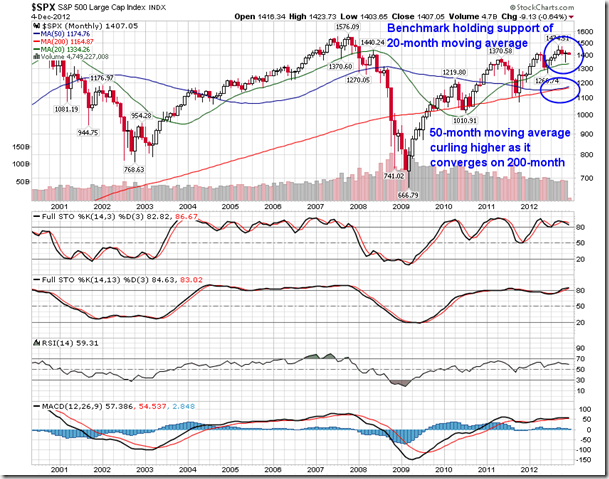
Technical Analysis of the S&P 500
With little new to report on the daily chart of the S&P 500, we turn to the monthly chart to highlight the longer-term patterns. The large cap index is holding support at the 20-month moving average, having tested that level mid-November. The 20-month moving average continues to trend higher, although the slope of the curve is flattening. More interesting is the relation of the 50-month moving average compared to the 200-month moving average. The 50-month has been showing signs converging on the 200-month all year in what would amount to a bearish crossover should the two cross. The 50—month has been recently showing signs of curling higher precisely at the 200-month in a stubborn attempt to avoid what many are calling “the ultimate death cross.” A monthly death cross is extremely rare with the first and last having been recorded in 1934. The large cap benchmark subsequently produced a golden cross in 1946 with the 50-month moving average crossing above the 200-month and has remained so ever since. The two averages came close to crossing in 1978 during the 1966 to 1982 secular bear market. The S&P 500 hit a low of 87.45 at the beginning of 1978 around the time the two averages were about to converge and rallied higher by over 60% in the three years that followed to 140.52 by the end of 1980. Will this be another close cross followed by a rally higher? Only time will tell.
10 Year U.S. T-Note Bonds Futures Continuous Contract Seasonality
The above chart represents the seasonality for the CBOE Interest Rate 10-Year T-Note (^TNX) for the past 20 years. The values presented above are level figures, and as such should be viewed inversely to that of a regular seasonal chart. In this case, the peaks represent higher yields as a result of lower prices, and the troughs represent lower yields as a result of higher prices. The investment approach under these circumstances would be to invest at an indicated peak in yields when prices are low, and sell when the yields have bottomed.
Technical Analysis of the US 10 Year Bond
The yield on 10 year Treasuries fell 8.7 basis points (5.14%) last week. Its five month range remains between 1.548% and 1.892%. Short term momentum indicators are neutral.
Crude Oil Futures Continuous Contract (CL) Seasonality
The above chart represents the seasonality for Crude Oil Futures Continuous Contract (CL) for the past 20 years.
Crude Oil Futures Continuous Contract (CL) Seasonality
Analysis has revealed that with a buy date of December 24 and a sell date of August 21, investors have benefited from a total return of 344.86% over the last 10 years. This scenario has shown positive results in 9 of those periods.
Conversely, the best return over the maximum number of positive periods reveals a buy date of December 24 and a sell date of August 30, producing a total return over the same 10-year range of 331.05% with positive results in 10 of those periods.
The buy and hold return for the past 10 years was 60.62%.
**Results shown are compounded
Technical Analysis of Oil
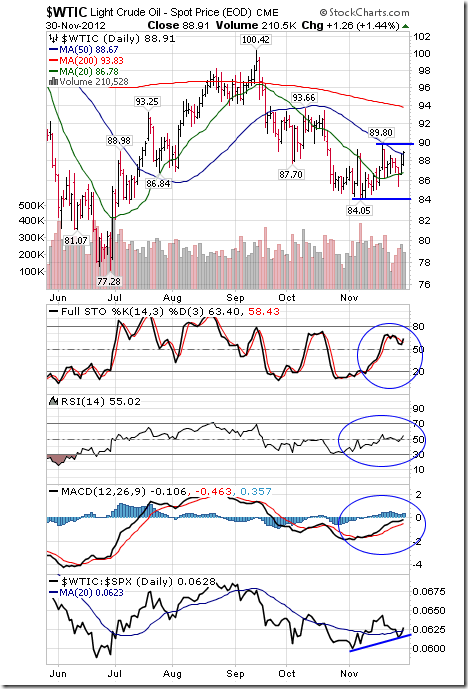
Crude Oil added $0.63 (0.71%) last week. Intermediate trend is neutral. Support is at 84.05 and resistance is at 89.90. Crude remains above its 20 day moving average and moved above its 50 day moving average on Friday. Short term momentum indicators are trending up. Strength relative to the S&P 500 Index remains positive.
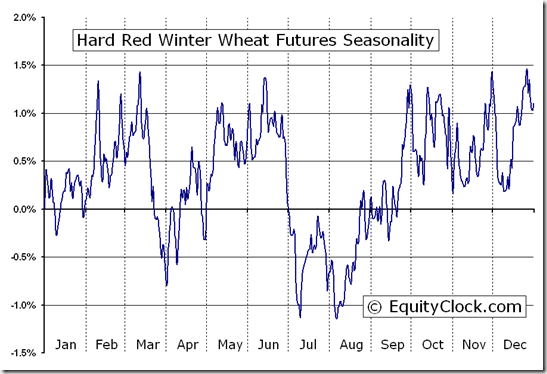
Wheat Futures Continuous Contract Seasonality
The above chart represents the seasonality for Wheat Futures (W) Continuous Contract for the past 20 years
Analysis has revealed that with a buy date of December 6 and a sell date of March 12, investors have benefited from a total return of 37.4% over the last 10 years. This scenario has shown positive results in 5 of those periods.
Conversely, the best return over the maximum number of positive periods reveals a buy date of December 6 and a sell date of January 2, producing a total return over the same 10-year range of 29.69% with positive results in 8 of those periods.
The buy and hold return for the past 10 years was -40.4%.
**Results shown are compounded
Technical Analysis of Wheat
Ed Note: I could not find an up to date Technical Analysis of Wheat. Will update as soon as I find it. This is what I could find:
The Agriculture ETF added $0.42 (0.81%) last week. Intermediate trend changed from down to neutral on a break above resistance at $51.93. Units remain above their 20, 50 and 200 day moving averages. Short term momentum indicators are trending up. Stochastics already are overbought, but have yet to show signs of peaking. Strength relative to the S&P 500 Index remains positive.
Special Free Services available through www.equityclock.com
Equityclock.com is offering free access to a data base showing seasonal studies on individual stocks and sectors. The data base holds seasonality studies on over 1000 big and moderate cap securities and indices.
To login, simply go to http://www.equityclock.com/charts/
Following is an example:
About Equity Clock
Equity Clock is a division of the Tech Talk Financial Network, a market analysis company that provides technical, fundamental and seasonality analysis on a daily basis via TimingTheMarkets.com and EquityClock.com. Equity Clock’s mission is to identify periods of reoccurring strength among individual equities in the market using methodologies presented by some of the top analysts in the industry, including that of Don Vialoux, author of TimingTheMarkets.com.
Feel free to use any of the content or seasonality studies (charts, timelines, or otherwise) presented as long as a link-back to this site at EquityClock.com is provided.
For further information on indicators used in reports presented on this site, please visit our reference page.


