
Stocks & Equities
The International Energy Association (IEA), in their recently published World Energy Outlook, reported some startling data on an oil & gas boom in the United Stated which could have potentially dire consequences for Canadians. For those who are not aware, over the past 2 to 3 years, we have seen a virtual revolution in the technology of recovering oil and gas reserves from tight and previously uneconomic shale deposits. Many people would know of this as fracing. The result of this improved technology cannot be more evident in the natural gas market where supplies have undergone a substantial increase and prices have plummeted in a relatively short period. But unbeknownst to many people is that this advanced fracing technology is also being applied to the production of light crude oil. We have long heard the cries and warning calls of U.S. politicians and business men, the most notable being Boone Pickens, about the economic and political dangers of energy dependence, the foreign and often unfriendly sources of the Middle East and Venezuela. The solution for the United States was a run towards energy independence. For some time Canadians have felt as if we were part of this solution. But that may be presumptuous of us?
Oil production, which had peaked in the U.S. in the early 1970s, has started to grow again….and it is growing fast. The advancement of critical fracing technology has allowed the world’s largest energy consumer to unlock oil & gas reserves in areas that were once considered inaccessible. This has been an occurrence in areas throughout the nation but nowhere is it more evident than in the Bakken region of North Dakota. Not only is the border state at the forefront of the U.S. oil boom but it also lies smack dab in the middle between Canada’s largest oil & gas producer, Alberta, and the U.S. Northeast where the majority of our energy exports end up. Although not a widespread issue yet, there have been cases of North Dakota oil hijacking pipeline capacity that runs through the state and therefore forcing Canadian exporters to pursue more costly transport options. But as we look forward, the cause for concern becomes more alarming with the IEA forecasting that the United States will surpass Saudi Arabia as the world’s largest oil producer by 2025 and that they will be completely energy independent by 2035. The issue for Canada is that 99% of our energy exports are supplied directly to our southern neighbor.
So what does this mean for Canada and Canadians? It means that based on current production trends and forecasts from reputable sources, Canada is at risk of losing its only energy customer within the next 20 to 25 years. This is a far cry from the mentality even 5 years ago when Canada’s oil & gas patch, particularly the oil sands, were considered the nation’s crown jewels and a key source of our recouping from the perils of the global financial crisis. But necessity is the mother of invention and the necessity of increasing economically recoverable oil and gas reserves resulted in a technology which maybe a massively disrupting game changer.
Before we all run for the hills in panic, let’s remember that trends don’t always continue in perpetuity. Just because the IEA forecasts energy independence for the U.S. does not mean that it will be achieved in the estimated time frame or even at all. Fracing is a very controversial technology and highly subject to the risks of regulatory oversight. There are also other considerations such as production decline rate and consumption growth. But what we can say for sure is that the United States (essentially our only energy customer) has become extremely motivated both politically and economically to achieve energy independence. So far, they have been much more successful than anyone thought they would be even two years ago. Should such a trend continue for the next two decades and within the absence of Canada diversifying energy exports to new markets, then the once mighty energy empire may find itself sitting on an ocean of oil & gas but with no one to sell it to.
KeyStone’s Latest Reports Section
11/29/2012
OIL & GAS EQUIPMENT MANUFACTURER POSTS RECORD Q3 2012 WORKING THROUGH RECORD BACKLOG, BALANCE SHEET REMAINS STRONG, SECTOR CAPEX PULL-BACK CREATES NEAR-TERM UNCERTAINTY – RATING CHANGE
11/23/2012
INVESTMENT COMPANY REPORTS RECORD QUARTER OF REVENUE AND FREE CASH FLOW – STOCK ADDED TO FOCUS BUY LIST DESPITE GAINS OF OVER 75% THIS YEAR
11/20/2012
SEPTEMBER 2012 BUY – JUNIOR OIL PRODUCER C&C ENERGIA (CZE:TSX) RECEIVES TAKEOVER BID, SHARES JUMP 18% & POST GAINS OF 36% FOR KEYSTONE CLIENTS IN 2 MONTHS!
11/20/2012
LEADING NORTH AMERICAN ELECTRICAL MANUFACTURER CHARTS SOLID 5-YEAR GROWTH PLAN, TRADING NEAR BOOK VALUE WITH LOW PE & GOOD CASH POSITION + 2% DIVIDEND – INITIATE COVERAGE WITH BUY RATING
11/15/2012
IP PATENT COMPANY POSTS SOLID Q3 2012, BEATS LOWERED GUIDANCE; CASH RICH WITH SOLID VALUATIONS & DIVIDEND, LONG-TERM OPPORTUNITY REMAINS FOR PATIENT INVESTORS ONLY
Track Record
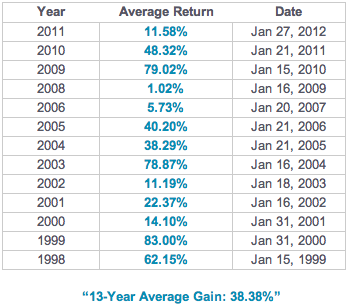
Since 1998, KeyStone Financial has provided its subscribers and institutional clientele with premium independent small-cap stock and now Income/Growth Stock research – it is quite simply coverage you can find nowhere else. Our no-nonsense fundamental approach to analyzing stocks, which focuses on real companies, with strong balance sheets, producing real revenues, earnings, and cash flow, produces real results. We think the numbers speak for themselves.
Small-Cap Stock Research Service Returns
 Find Out More HERE

 Tax is our Biggest Personal Expense, whether its sales taxes, gasoline taxes, income taxes….. the list goes on. Having the right tax information is absolutely key, and no time more important than at the end to the year.
Here’s an End of the Year Checklist for the For Employed, Self Employed & Investors:
{mp3}timcestnick1{/mp3}
Investors
1. Sell losers in your portfolio, particularly if you have Capital Gains to offset within the last 3 years.
2. Consider doing a Debt Swap if you are paying any interest at all that is not deductible for Tax purposes. You won’t increase your Debt but you will make the interest payments deductible.
3. If you are making a donation, donate securities that have gone up in value instead. If you sell them first, you pay a capital gain and donate the same amount of money. If you donate the shares, you pay no taxes nor does the Charity pay any taxes.
Self Employed
1. If you haven’t got any self employed income you really should be thinking about it because it is the Last Great Tax-Shelter out there.
2. You can deduct things that you are paying for anyway – your car, computer costs, part of utilities at home, mortgage and taxes etc.
3. If you want to reduce your income, consider paying family members before the end of the year. By doing this you are really shifting income that would otherwise be taxed in your hands to a family member who may pay no taxes at all.
4. If you were going to buy any Capital Assets in January/13, better to buy them now in December/12 so that you can depreciate them in 2012. Otherwise you won’t be able to depreciate them until next year.
5. If you are selling Capital Assets, wait until January 2013 so that you can get another year of depreciation.
Employee
1. If you can get your employer to go along – Hire your spouse or child as an assistant, you can deduct their assistants income right from your employment income.
2. Talk to your employer about paying for non-taxable benefits for you like courses, gifts, awards etc.
3. See if your employer can lend you money instead of a Bank. Your employer can lend you money for as little as 1% and there is no taxable benefit to you.

 His Total Return Fund gained 11.7 percent over the past year, beating 94 percent of its peers, according to data compiled by Bloomberg. The fund has returned 8.5 percent over five years, outperforming 97 percent of competitors.
Pacific Investment Management Co.’s Bill Gross, manager of the world’s biggest bond fund, said the investment company may reduce its risk profile in 2013 after posting higher-than-average returns this year.
With interest rates so low and corporate spreads so tight, “you have to be leery of prices going the other way,” Gross said in a radio interview on “Bloomberg Surveillance” with Tom Keene.
Gross wrote in his monthly investment outlook released this week that structural headwinds may reduce real economic growth below 2 percent in the U.S. and other developed nations. With globalization, technological and demographic changes restricting growth, investors should seek returns from commodities such as oil and gas, U.S. inflation-protected bonds, high-quality municipal debt and non-dollar emerging market stocks, Gross said, reiterating earlier recommendations.
Long maturity developed country bonds in the U.S., U.K. and Germany should be avoided, as well as high-yield debt and financial stocks of banks and insurance companies, Gross wrote.
Investors should anticipate annual returns of 3 percent to 4 percent from bonds at best and equity returns only a few percentage points higher, Gross wrote.
Gross, the founder of Pimco, raised the proportion of U.S. government and Treasury debt in his flagship $285 billion Total Return Fund to 24 percent of assets in October, the first increase since April, as investors speculated the Federal Reserve would add to stimulus measures through more asset purchases, according to the latest available company data. Mortgages remained the fund’s largest holding at 47 percent.
The Total Return Fund gained 11.7 percent over the past year, beating 94 percent of its peers, according to data compiled by Bloomberg. The fund has returned 8.5 percent over five years, outperforming 97 percent of competitors.
The government bond bubble will burst, warns Charles Biderman, CEO of TrimTabs Investment Research.
The main buyers of government bonds have been large global banks that have to keep buying the bonds because if they don’t, both they and the government will go broke, he maintains.
….read more HERE
TrimTabs’ Biderman: Government-Bond Ponzi Bubble Has to Burst
The government bond bubble will burst, warns Charles Biderman, CEO of TrimTabs Investment Research.
The main buyers of government bonds have been large global banks that have to keep buying the bonds because if they don’t, both they and the government will go broke, he maintains.
The banks buying government bonds were the same institutions that central banks rescued by purchasing their bad loans.
…read more HERE

 It seems these days I spend at least 50% of my time looking at farms for sale in Chile. And with good reason.
I’ve written before at length why agriculture seems like the no-brainer investment of the decade: given the fundamentals of supply and demand, the absolute best-case scenario is rising food prices. The worst-case scenario is shortages.
Owning farmland is comparable to owning physical gold. And I’m buying as much of it as I can, specifically in Chile.
Farmland in Chile is incredibly rich. It’s like Iowa meets California, but at a fraction of the cost. Highly productive farmland here runs anywhere between $2,000 per acre and $6,500 per acre. By comparison, farmland in Iowa and California can cost $10,000 to $12,000 per acre for similar quality.
What’s more, the production yields are typically as strong… and in some cases, even stronger. The UN Food and Agriculture Organization estimates that Chile’s corn production per acre is 20.13% higher than in the US, and 33.57% higher than in Canada, and the numbers are similar for wheat.
My own experiences match these statistics. For example, Michigan is the production leader in the US for ‘highbrush’ blueberry cultivars that we grow here in Chile. Yet, according to the USDA’s National Agricultural Statistics Service, Michigan yielded 3,850 pounds per acre last season. In the same period, my production yield in Chile was 60% greater… and rising.
What’s more, because Chile is in the southern hemisphere, our harvests are counterseasonal to those in the northern hemisphere. Supply is tighter when we harvest, which means the price we fetch is higher.
In 2010, for example, Michigan blueberry farmers were paid $1.23 per pound for their July-August harvest. In Chile, the price paid to farmers for export quality blueberries is around $1.75 per pound… 42% higher.
In addition to better revenue potential, labor costs in Chile are much lower. Laborers in the area near my farm command wages of just 2-3 dollars per hour, and even a seasoned manager with decades of experience will barely register more than $1,000 per month.
In the US, Canada, and UK by comparison, a veteran farm manager can command $60,000 to $80,000 annually.
So in addition to achieving optimal revenues, the operating costs in Chile are much lower. Higher revenues. Lower costs. More profit.
And the tax breaks for agriculture here are spectacular. The government allows what’s called ‘deemed income reporting’ for farmers, which reduces not only the tax liability, but also the time and costs of compliance. It’s incredibly simple.
Plus there’s no insane government regulator breathing down your neck, or big multinational like Monsanto mopping up the entire market.
Even if you don’t want to take any operational risks, you can simply buy property and lease it out to another farmer, achieving yields of between 6% and 11%. Residents of Chile can also obtain low-interest financing, so you can mitigate your risk while generating a superior cash on cash return for doing absolutely nothing.
And for foreigners, it’s incredibly easy to become a resident in order to obtain financing on agricultural property. I’m currently working on a way to borrow in dollars to buy farmland down here… so that I can simultaneously go long agriculture and short the dollar. I can’t think of a better investment.
Bottom line, if you believe that out of control money printing and world population demographics will contribute to significant food price inflation in the coming years, owning farmland is one of the smartest investments you can make.
And, taking into account all the factors– price, production, operating risks, etc., conditions here in Chile are ideal.
Until tomorrow,
Simon Black
Senior Editor, SovereignMan.com
Enter your email HERE to Join 117,239 + Subscribers
Who is Simon Black?
Hi. I’m Simon Black– international investor, entrepreneur, permanent traveler, free man. This free daily e-letter is about using the experiences from my life and travels to help you achieve more freedom.
- You can live a luxurious and worry-free lifestyle overseas that would be unaffordable elsewhere
- You don’t have to be a slave to geography anymore; live where you want, how you want.
- You can take control of your time and spend it how you want, not how others tell you
- You can make money anywhere, whether it’s China, Panama, New Zealand, or online
- You can mix and mingle with the absolute elite
In the last 3 months I’ve traveled to over 20 countries, met with a President and several diplomats, briefed sovereign fund managers, flown an aerobatic stunt plane, started several companies, hitchhiked in Bogota, taken a train across the orient, lectured on entrepreneurship in Eastern Europe, and personally provided venture capital to new start-ups.
I’m a student of the world, and I believe that travel is the greatest teacher. My knowledge is practical, and hopefully of significant use to you. Off the top of my head I could quote you the price of beachfront property in Croatia, where to bank in Dubai, the best place to store gold in Singapore, which cities in Mexico are the safest, which hospitals in Asia are the most cost effective, and how to find condo foreclosure listings in Panama.
I believe that in order to achieve true freedom, you have to be able to make money, control your time, and eliminate the mindset that you are subject to a corrupt government that is bent on degrading your personal liberty.
This blog is dedicated to those principles, and I provide concise, actionable information each day to help you achieve those ends. After all, it’s 2012… which means that it’s time to expand our horizons and consider, quite literally, the world of possibilities out there… all the things that the system told us were impossible, or not for “ordinary” people are, in fact, very much a reality:
Gold fell more than 1 percent on Tuesday hitting its lowest price in nearly a month. The most concerning part about this decline is that it took place with dollar’s simultaneous plunge. We have already touched upon the usual negative correlation between gold and U.S. dollar in the past, and while it is certainly true most of the time, there are periods where precious metals fail to react to dollar’s weakness. There are various hypotheses why this is so this time and one of them is the “fiscal cliff” issue.
Buyers are supposedly waiting on the sidelines because of uncertainty over the “fiscal cliff” – $600 billion in tax hikes and spending cuts that are due to kick in the New Year. Republicans and Democrats dug in on talks Wednesday, with both sides urging quick action but offering no compromises. They seem to be playing “chicken” in a political stare-down that shows no signs of breaking. On Wednesday, President Barack Obama rejected a nascent Republican plan that would have extended the bitter fight over the fiscal cliff into next year.
Some pundits say the fiscal cliff problem will cause the price of gold to soar and there are those who claim the opposite. The arguments go like this. Going over the fiscal cliff will probably send an earthquake through the markets causing fear which could drive investors into gold as a safe haven. In addition, it will weaken the U.S. dollar which is likely to strengthen gold. If politicians are able to avert going over the cliff, markets will continue to focus on the QE Ponzi scheme, the debasement of the dollar and the inevitable inflation, all bullish for gold.
On the other side of the fence are those who say that going over the fiscal cliff will be bad for gold. The U.S. will go into a recession and gold will stumble along with everything else. Not going over the cliff could renew bullish sentiment for equities and decrease the appetite for gold.
We personally believe that the outlook for gold in the medium and long run is bullish and the “fiscal cliff” can do more good than harm to the yellow and other precious metals. We continue to expect the situation to be resolved by printing more money. No politician wants to be blamed for stocks’ and economy’s collapse (even a necessary one). Our best bet is that gold will rally strongly in 2013, perhaps topping close to the $2,500 level. To see what our rationale is, let us move on to today’s technical part with the analysis of the USD Index. We’ll start with the medium-term chart (charts courtesy by http://stockcharts.com.)

In the chart, virtually nothing has changed this week. Again, what was stated in last week’s article is still up-to-date:
A consolidation has been ongoing for over a month, and the index now appears ready to move lower. The decline and consolidation here are a reflection of the upswing and consolidation seen recently in the Euro Index.
Let us now have a look at the U.S. currency from a short-term perspective.

In the chart, we see that a top formed almost right at the cyclical turning point. With about one half of the previous decline corrected, it appears that a period of decline is once again in place here.
One concerning factor is that gold and silver moved lower along with the declines in this index. This is not a sign of strength for the precious metals. It means that the metals declined in terms of other currencies, mainly the euro. Let’s take a closer look at the gold-euro relationship.

On the above chart we see that the 200-day moving average support line has been reached. This level has been above local bottoms many times in the past. More importantly, the RSI has touched 30 and this has usually been quickly followed by rallies (note red arrows in the upper part of the above chart) in the past so the local bottom may already be in here.
The above chart is important not only because of the signals that we can directly see and that we described in the above paragraph. It’s important also because the decline that you can see in the last few weeks is directly linked to the simultaneous decline in the USD Index and the price of gold. Since the decline is likely over (support level being reached, buy signal from the RSI indicator), the same should be the case with the lack of positive reaction in gold to dollar’s weakness. The USD Index declines could now begin to impact gold prices, and they could start to move higher any time now.
The limitation of the above analysis is that it doesn’t have to be precise on a very short-term basis. In fact, it’s based on medium-term price moves. We could see another small move lower that would take the RSI indicator slightly below the 30 level and the above picture would not be invalidated at all – it would become even more bullish based on this factor alone. This was the case in January and December 2011.
Summing up, the situation for the USD Index looks bearish, and this has bullish implications for the precious metals. Since no response was seen this week in gold and silver prices, however, an immediate rally may not be seen based on the above charts. The medium-term picture for gold appears very favorable.
Thank you for reading. Have a great weekend and profitable week!
Sincerely,
Przemyslaw Radomski,
http://www.sunshineprofits.com


-
I know Mike is a very solid investor and respect his opinions very much. So if he says pay attention to this or that - I will.
~ Dale G.
-
I've started managing my own investments so view Michael's site as a one-stop shop from which to get information and perspectives.
~ Dave E.
-
Michael offers easy reading, honest, common sense information that anyone can use in a practical manner.
~ der_al.
-
A sane voice in a scrambled investment world.
~ Ed R.
Inside Edge Pro Contributors

Greg Weldon

Josef Schachter

Tyler Bollhorn

Ryan Irvine

Paul Beattie

Martin Straith

Patrick Ceresna

Mark Leibovit

James Thorne

Victor Adair