
Timing & trends
Most equity markets in the world and major sectors currently are in intermediate uptrends. As the saying goes, “The trend is your friend”. Preferred strategy is to accumulate favoured sectors on weakness for an intermediate rally that is likely to last at least until Inauguration Day in the third week in January.
The Fiscal Cliff remains the top issue influencing equity markets. Most likely scenario is a resolution before the end of the year, but in two steps. The first step will handle issues with a deadline at the end of the year (e.g. tax rates on dividends and capital gains). The second step will focus on the “Grand Plan” that will include Tax Reform on the personal and corporate level as well as entitlements and the debt ceiling. Equity markets will respond favourably when the first step is announced (but not with a big upside move) because short term uncertainties are removed. The second step is by far the most important and is likely to create the greatest volatility in equity markets. Will Obama moved toward the middle of the political spectrum during the second step? If he does, confidence in the corporate community will be at least partially restored and large cash position will start to be employed in ways that will help the U.S. economy. On the other hand, if Obama maintains his current antagonistic attitude against capital enterprise, the large cash positions will be employed in other ways (e.g. share buy backs, employment of capital outside of the U.S.). Unfortunately, some corporations already are starting to choose to employ their large cash positions by issuing special dividends and by announcing share buy backs. The completion of the second step will determine the direction for equity markets in 2013.
Historically, the strongest three week period for North American equity markets is from December 15th to January 7th. According to Thackray’s 2012 Investor’s Guide, average gain during the period since 1950 was 2.0%. The gain by the NASDAQ Composite Index was better. Average gain per period since 1971 was 3.0%. As the book says, “Santa arrives early and leaves late”. One of the reasons for the Santa Claus rally is the end of tax loss selling pressures (particularly in the gold equity sector this year). Other reasons include upbeat reports released by the investment community predicting encouraging prospects for the next year, lower than average institutional volume and a buoyant mood by individual investors during the Christmas holiday period. This year, the first step toward resolution of the Fiscal Cliff provides an extra “kicker”.
Sectors with positive seasonality at this time of year continue to outperform the S&P 500 Index including Agriculture, forest product equities, lumber, industrials, semiconductors, biotech, Europe, base metals, silver equities, platinum and copper.
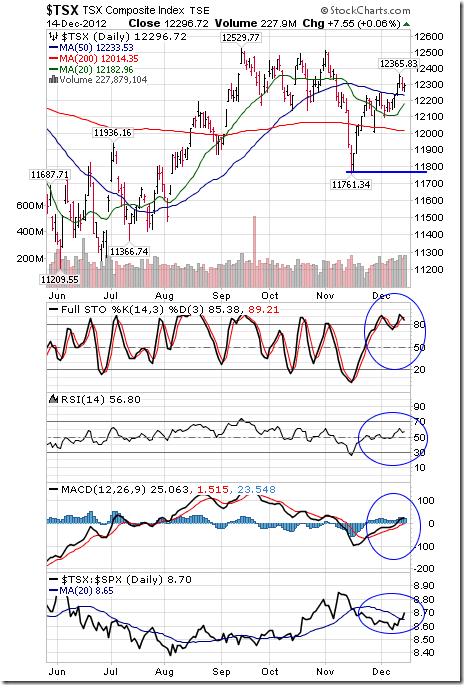
The TSX Composite Index added 137.05 points (1.13%) last week. Intermediate trend changed from down to up on a break above 12,252.27. The Index remained above its 20 and 200 day moving averages and moved above its 50 day moving average. Short term momentum indicators are overbought, but have yet to show signs of peaking. Strength relative to the S&P 500 Index has changed from negative to at least neutral.
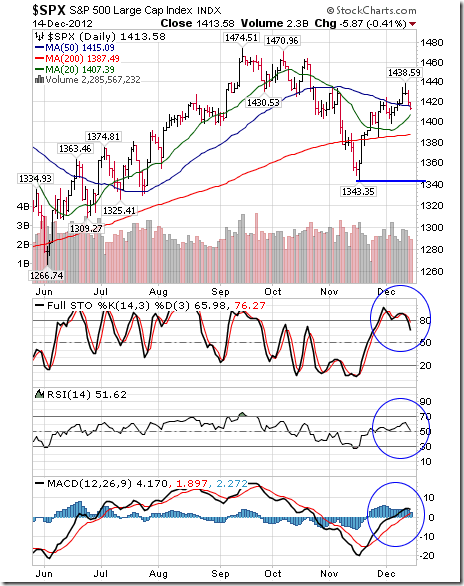
The S&P 500 Index fell 4.49 points (0.32%) last week. Intermediate trend changed from down to neutral on a move above 1,434.27. Next resistance is at 1,470.96. Support is at 1,343.35. The Index remains above its 20, 50 and 200 day moving averages. Short term momentum indicators are overbought and showing signs of rolling over.
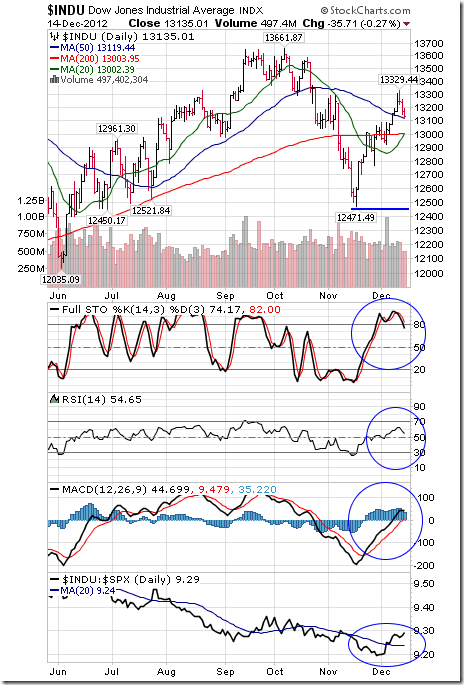
The Dow Jones Industrial Average slipped 20.12 points (0.15%) last week. Intermediate trend changed from down to neutral when the average moved above 13,290.75. Next resistance is at 13,661.87. Support is at 12,471.49. The Average remains above its 20, 50 and 200 day moving averages. Short term momentum indicators are overbought and showing early signs of rolling over. Strength relative to the S&P 500 Index is at least neutral and showing early signs of outperformance.
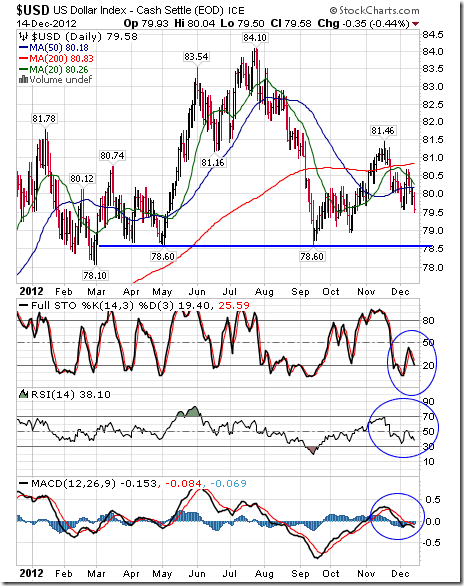
The U.S. Dollar virtually collapsed last week after Congress and the President failed to negotiate a deal on the Fiscal Cliff and after the Federal Reserve unofficially confirmed a Quantitative Easing Infinity program. The Index plunged 90.84 (1.04%). The Index remains below its 200 day moving average and fell below its 20 and 50 day moving averages. Short term momentum indicators are trending down. The Index completes a massive head and shoulders pattern on a break below 78.60.
Crude Oil added $0.73 per barrel (0.85%) last week. Intermediate trend is neutral. Support is at $84.05 and resistance is at $90.33. Response to the OPEC meeting was negligible. Crude remains below its 20, 50 and 200 day moving averages. Short term momentum indicators are trending down. Stochastics already are oversold. Strength relative to the S&P 500 Index remains negative.

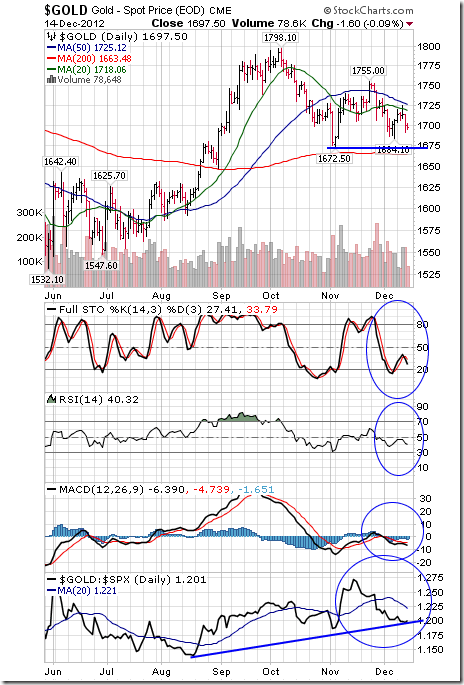
Gold slipped $7.70 per ounce (0.45%) last week despite weakness in the U.S. Dollar. Intermediate trend is neutral. Support is at $1,672.50 and resistance is at 1,755.00. Gold remains below its 20 and 50 day moving averages and above its 200 day moving average. Short term momentum indicators are mixed. Strength relative to the S&P 500 Index remains neutral.
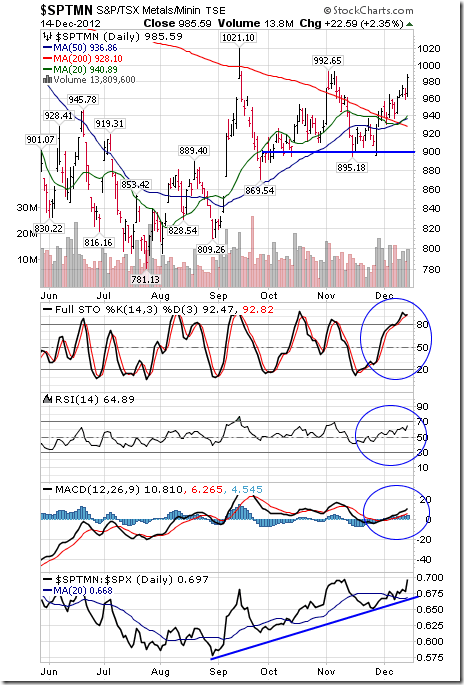
The TSX Global Metals and Mining Index jumped 42.73 points (4.53%) last week. Intermediate trend is neutral. The Index remains above its 20, 50 and 200 day moving averages. Short term momentum indicators are overbought, but have yet to show signs of peaking. Strength relative to the S&P 500 Index remains positive. ‘Tis the season!
…..much more (46 charts and analysis) HERE

In my short term trading accounts I try to benefit from price changes in various markets…trading what the markets are doing…not than what I think they should be doing. I try to align the time frame of my trading with the time frame of my analysis. I read a lot of research and watch a lot of markets. I try to gauge Market Psychology because I see it having a powerful impact on markets…either extending or reversing price trends. I use the term Key Turn Dates (KTD) to identify points in time when changes in Market Psychology, measured across a number of asset classes, causes a significant change in market price trends.
Sept 14 was a KTD and “risk assets” fell from that point…became “oversold” by Nov 16 and bounced…I’ve thought that the bounce was only a correction to the downtrend from Sept 14…I’ve been waiting for a confirmation that the bounce was over before re-shorting some of the “risk assets.”
It’s interesting to notice that “risk assets” may all turn (more or less) on the same KTD but some “assets” move substantially more than others…this could reflect “fundamentals” specific to one market and not to others…it could be a function of “riskier risk assets” having a higher beta than “less risky risk assets”…or other factors…this variance definitely influences my choice of which market to trade when I want to take a position.
In most of the markets I watch the US Dollar is the common denominator…to get a different view (and perhaps a better understanding) of markets I will frequently construct charts where I take the US Dollar out of the equation…for instance, looking at the gold/silver ratio, or the EuroYen chart.
Charts:
The S+P 500 chart really has my attention…I’ve been waiting for the rally off the Nov 16 lows to run out of steam…that may be happening this week…but no real confirmation yet…

The German DAX has had one of the biggest rallies of any of the “risk assets” off the Nov 16 lows…easily taking out the Sept 14 KTD…this has happened in conjunction with a strong rally in the Euro currency as Market Psychology has become less negative on “Europe.”

Silver has been one of the weakest risk assets since the Nov 16 date…silver looks at risk of a breakdown.

The Euro had a Key Weekly Reversal higher this week…a powerful chart pattern. In my comments on the Euro last week I noted that the currency markets get thin and weird this time of the year…that as implausible as it may seem given all the “troubles” in Europe…if the Euro rallies and takes out the triple top going back to the Sept 14 highs then it could run higher into year-end…here we go?

The Japanese Yen has fallen steadily from late September…some analysts have been predicting for the last couple of years that the Yen “had” to fall…it’s been the absolute weakest of the major “assets” since the Sept 14 KTD…huge short positions have been built…the Dec 16 election is expected to give Abe a clear mandate and he has been forceful in calling for the BOJ to ramp –up money printing to stimulate at least 2% inflation…will this be a classic “sell the rumor, buy the fact” story? Will Abe have to tone down his demands once in office to keep Japanese bond yields from rising?

The New Zealand Dollar has been one of the strongest “risk assets” since the Nov 16 lows…like the DAX it has easily taken out the Sept 14 KTD. It has “blown away” its sister COMDOLS the CAD and the AUD. Is this a case of “hot money” pushing up prices as it rushes into a small market…or has something fundamental changed in NZ relative to other risk assets? I’d go with the former…but beware thin year-end conditions in FX markets…note over the years how significant “V” shaped turns in currencies happen around year-end. This currency is definitely on my “watch list”…I may look to short it against the CAD or the AUD rather than the USD…once it gives me a sign that it has stopped rising…

The Japanese Yen against the New Zealand Dollar: this is the chart of the weakest currency (JPY) against the strongest (NZD) since early September…a move of about 12.5% or about 50% annualized. If Market Psychology were to turn negative across asset classes this spread could reverse big time.

The US Long Bond made a low on the Sept 14 KTD as risk assets were making highs…and made a high on Nov 16 just as risk assets were making lows…the US bond market has been the opposite side of the “risk on / risk off” teeter-totter.

Apple: What a chart! Fortunes made and fortunes lost. Note that the All Time High for AAPL was made the week of the Sept 14 KTD…Market Psychology shows up all over the market…


Victor Adair is a Senior Vice President and Derivatives Portfolio Manager at PI Financial Corp. He began trading over 40 years ago and has held a number of senior executive positions during his career…to go to his website go HERE (http://www.victoradair.com)

 Mark Leibovit’s perspective on the Stock Market is that we are in a trading environment rather than an investment environment. Mark’s long term work right now tells him that we could be trading between 8,000 and 14,000 on the Dow for as much as another 5 years. In his opinion an environment similar to that we’ve seen from 2000 to 2012. In short he thinks it is just going to be big big swings back and forh between those two data points and the key to success is going to be catching the mid-term swings back and forth.
Mark thinks that a lot of what we are seeing in the indexes right now is a manipulation by the “Big Boy” money managers trying to hold the market up until they get paid at the end of each quarter and at the end of the year.
One factor in his calculations is that despite the bad news of fiscal cliff negotiations, and Western Governments soaked in debt, the markets are still holding up. A factor which persuades Mark that the market will still be moving a little bit higher through to the end of the year. After that he then expects a more bearish market from the beginning of 2013 through to the end of the first quarter 2013.
Mark looks at history and what he sees is that when Herbert Hoover and Franklin Roosevelt raised taxes back in the 1930’s during the worst of all possible times, the way Obama plans to raise them in 2013, the net result was a significant decline in employment, tax revenue and the stock market. So he sees these things as something that is definitely coming in 2013, but it just doesn’t mean there can’t be a Santa Claus rally beforehand.
The Bottom Line as Mark sees it is that with positive seasonality, money managers wanting to get paid, and the tendency for a Santa Claus rally will keep the markets up until the end of the year. After that rally we will then have to brace ourselves for what could be a big slump into mid-2013. That slump likely followed by a bottoming and another rally into year end 2013.
Again, Mark is not taking an investment point of view. He simply sees big tradable swings back and forth, or big money losing swings if you happen to get on the wrong side of them. In his opinion the key to success will be preservation of capital in this big swing kind of an environment he expects to take place for the next 4 or 5 years while all the negatives are getting washed out. All that has to occur before we will find ourselves in an investment market again, a buy and hold market if you will.
Ed Note: In case you missed our latest special bonus, ticket buyers will receive an exclusive opportunity to read the mid term and long term investment views of Mark Leibovit in his new newsletter, Wall Street Raw.
This will not be available to the public for another four months but World Outlook ticket buyers will immediately receive a weekly copy that Mark is writing exclusively for us.
Conference Details
Where: Westin Bayshore, Coal Harbour, Vancouver
When: Friday evening, February 1 and all-day Saturday, February 2, 2013
To Book: CLICK HERE to order
Cost: $119 for a two day pass or $119 for Video Access
 In case you missed it, we just announced a major coup for the 2013 World Outlook Financial Conference. Earlier this year I made up a dream list of speakers for the event. Frank Guistra, one of the true giants of the investment industry was on that list. I thought it would be fantastic to be able to get the thoughts and specific investment advice from someone who has a legendary Midas touch when it comes to picking investment winners.

 Dennis Gartman is bullish on a whole lot these days, including stocks, gold and, most of all, the USA.
“Dennis Gartman is about as raging a bull as you can find these days. At a time when many investors remain beaten down in the volatile “risk-on/risk-off” aftermath of the crash of 2008, and uncertain about how high taxes will go in 2013, the editor of The Gartman Letter looks at rising crude and natural gas production in the U.S. and sees the makings of the most promising economic circumstances in a long time.
Gartman told IndexUniverse.com Managing Editor Olly Ludwig that he’s not exactly pleased about President Obama’s re-election, but that doesn’t mean he’s wallowing in pessimism about the goings on in Washington, D.C. He reckons that while it may take time and great effort, Democrats and Republicans will do the right thing and cut spending, even as the “leftist” president goes ahead and raises taxes on the wealthiest Americans.
In all his optimism, Gartman is also bullish on gold, but not in the way you might expect. He’s not buying gold because he thinks the economy is going to the dogs and that the Federal Reserve is unhinged. Rather, he says that Ben Bernanke’s Fed is doing a fine job, and that investors should buy gold with a weakening Japanese yen. What’s more, Gartman even has his name on a quartet of funds now in registration that will allow investors to own gold in yen, British pounds and euros”.
Ludwig: Could gold end lower this year?
Gartman: No. It ended last year at $1,566 an ounce. The odds of it closing unchanged on the year, I think, are zero.
Ludwig: I ask because you don’t see gold going through the roof these days, in spite of what the Fed is doing to keep bond yields so low. It has been falling and is now around $1,700.
Gartman: Well, the Fed is buying $40 billion to $45 billion worth of securities every month, but we forget that they’re also allowing about $35 billion to $40 billion—if not more—to mature off on the back end. So the monetary base has actually not grown at all in the course of the last year.
Ludwig: So what is your general overview of how the Fed is performing?
Gartman: I think the Fed has done yeomen’s work since the autumn of 2008. Publicly, they’re very clear about buying securities on a regular basis; privately, they’re circumspect and quiet about allowing them to mature off. I think they have expanded all that they’ve wanted to. And I think they have done the right thing heretofore.
Ludwig: How might the Fed slowly extricate itself without causing some kind of a crash in the market because of a quick hike up in rates and what have you? I’m guessing you don’t buy that some nightmare scenario will happen.
Gartman: No, I just disagree completely with the nightmare scenario. I’ve only been in the markets for 40 years but I’ve heard nightmare scenarios for every one of those years. But the worst fears never seem to come to fruition. The better hopes almost always seem to come to fruition. And perhaps I’m naive in that respect. But those who have bet upon collapse have made very bad bets for a protracted period of time.
I think that the Fed has said that they intend to keep the overnight Fed funds rate low for a long period of time—into 2015. It’s probably ill-advised, but I’m not surprised that they’ve made that statement.
…..read page 2 HERE


-
I know Mike is a very solid investor and respect his opinions very much. So if he says pay attention to this or that - I will.
~ Dale G.
-
I've started managing my own investments so view Michael's site as a one-stop shop from which to get information and perspectives.
~ Dave E.
-
Michael offers easy reading, honest, common sense information that anyone can use in a practical manner.
~ der_al.
-
A sane voice in a scrambled investment world.
~ Ed R.
Inside Edge Pro Contributors

Greg Weldon

Josef Schachter

Tyler Bollhorn

Ryan Irvine

Paul Beattie

Martin Straith

Patrick Ceresna

Mark Leibovit

James Thorne

Victor Adair