
Stocks & Equities
- What Happened To Markets The Last 15 Times The Fed Tightened. One question has gripped investors perhaps more than any other: when will the Fed start tightening monetary policy, and what will happen when it does?
Deutsche Bank Chief U.S. Equity Strategist David Bianco says, “Don’t fear interest rate normalization.” That’s the title of one of his recent research notes, which takes a deep dive into what happened to markets each of the 15 times the Fed has embarked on policy tightening since 1965.
Bianco writes, “DB economists and rate strategists forecast an unchanged Fed Funds rate until 2014. However, they forecast a 3.0% 10yr Treasury yield at 2013 end. When QE ends it will likely be akin to early-cycle Fed tightening and the uptick in long-term yields will represent a cyclical rise in rates, both of which are bullish.”

10 Things You Need To Know Before The Opening Bell
- .Asian markets were mixed in overnight trading with the Shanghai Composite down 0.79 percent. The Nikkei was up 1.28 percent after positive Chinese data boosted stocks with exposure to the country. Europe is mixed and U.S. futures are modestly lower. Apple is expected to weigh on the Nasdaq after its earnings report.
- China HSBC flash manufacturing PMI climbed to a 24-month high of 51.9 in January, beating expectations. The sub-indices like new export orders and employment also showed improvement. The $2.1 trillion powder keg near the heart of the Chinese financial system >
- In Europe, French flash manufacturing PMI fell to 42.9 in January, and the composite output index declined to 42.7, showing deeper contraction. Meanwhile, German manufacturing PMI climbed to 48.8, but remained below the contractionary reading of 50. The composite output index however climbed to 53.6.
- Initial claims are out at 8:30 a.m. ET, followed by Markit PMI for January at 8:58 a.m. ET. Analysts polled by Bloomberg are looking for new claims to rise to 360K and for PMI to decline to 54.0.Follow the release at Business Insider >
- Apple shares are down over 9 percent in pre-market trading after yesterday’s earnings report. iPhone sales disappointed, coming in at 47.8 million, against expectations of 50 million. iPad and Mac sales also missed expectations, though iPod sales came in higher. The tech giant reported earnings of $13.81 per share, on revenue of $54.5 billion. Nomura: Apple could go as low as $336 >
- Netflix also reported earnings after the closing bell yesterday. The company beat expectations reportingearnings of $0.13 per share, on revenue of $945 million. It added almost 10 million global streaming members in 2012, raising its total global streaming subscribers to over 33 million. The earnings guidance also beat estimates and its stock is up a whopping 37.01 percent in pre-market trading. Here’s what America’s biggest companies are telling us about the global economy >
- Japanese exports fell 5.8 percent in the year to December, and imports were up 1.9 percent. The trade deficit came in at ¥641.5 billion. 2012 however saw a record trade deficit of ¥6.93 trillion.
- Spain’s Institute of National Statistics put Q4 youth unemployment, defined as those under the age of 25, at 59.8 percent. Spain’s unemployment rate climbed to 26 percent in the fourth quarter, with 5.97 million out of work.
- Kansas City Fed manufacturing index for January is out at 11 a.m ET. Analysts polled by Bloomberg are looking for the manufacturing index to rise to 2.Follow the release at Business Insider >
- Lockheed Martin reported fourth quarter earnings of $1.73 per share, missing expectations. It issued better than expected full-year earnings guidance from continuing operations of $8.60 – $9.10 per share. Microsoft is expected to report earnings of $0.75 per share. Deutsche Bank: These are the 30 best stocks right now >
- Bonus – Tiger Woods is reportedly dating Olympic skier Lindsey Vonn and is thinking of getting married again.

Today John Embry told King World News the coming Super-Spike in gold will be dwarfed by the mania in silver. Here is what Embry, who is chief investment strategist at Sprott Asset Management, had to say: “Well, I’m focused on the inevitable rise in the gold and silver prices. It’s obvious when you watch the trading that gold and silver are being aggressively restrained here. This leads me to believe the central planners have some problems here and they don’t want the gold and silver prices to expose that.”
 John Embry continues:
“What really terrifies the central planners is if gold and silver were to truly reflect what is really going on in the financial system, interest rates would rise significantly. When this happens the debt load will be utterly unsustainable. That’s their greatest fear.
I’m watching with great interest to see how long they are going to be successful at holding back the tide….
Continue reading the John Embry interview below……HERE
Final Pulse May Be A Stunning $8,000 For Gold & $500 Silver
Ed Note: be sure to look at this story for two stunning charts. The first below has been around for a long while by Dr. Jean-Paul Rodrigue describing a Mania Bubble.

The second Chart is wear Gold & Silver is today based on Dr. Jean-Paul’s Mania Bubble Chart, and it sure looks like the mania rocket is late in the launchpad countdown……
……take a look at that second chart HERE
Ignore Information, Listen to the Market!
![]()

Order the Mindless Investor book now
Have you read my new book yet? You should, I am sure it will make you a better trader! “The Mindless Investor” is not yet in stores but you can now order advanced copies of it. To do so, first log in toStockscores.com and then cut and paste this link in to the address bar of your browser. Doing so will add the charge ($29.95 + $6.50 shipping) to your shopping cart so you can complete the transaction.
http://www.stockscores.com/cart.asp?caction=add&prodid=2254
Stockscores Market Minutes Video
Where there is smoke, there is fire. Hot stocks start with abnormal activity and in this week’s Market Minutes video I show you how to spot these stocks early. You can watch it by clicking here. To receive email alerts any time I upload a new video, subscribe to the Stockscores channel at www.youtube.com/stockscoresdotcom.
This week’s Trading Lesson
In theory, information should make the stock market’s world go round. Information about companies and their ability to make money in the future is what should determine share price. As the market learns of new information, price is adjusted up and down to reflect the value of that information.
This implies that investors should focus their analysis on information so they can predict where share prices should go in the future.
While this makes good sense, I have found it to be extremely rare that investors who use information are able to consistently beat the stock market. With smaller retail investors (you and I) in particular, the use of information for making investing decisions is more destructive than it is beneficial. Here are ten reasons why:
1. Information is Usually Already Priced In – most investors use publicly available information. That means it is widely known and available to anyone considering the stock. If information is available to a large number of investors then we should expect that the market will have priced that information in to the stock. Therefore, the information has not value to us.
2. Information Usually Comes with a Bias – as a general rule, people do what they are financially motivated to do. If someone is encouraging you to purchase a stock, there is a good chance that they have some financial motivation to do so. Before you trust the information you receive, understand the financial motivation. If you find the reason, you will often usually find that there is a strong bias in the information being provided to you.
3.Trading on Truly Insider Information is Illegal – there are few risk free trades in the stock market, but trading on significant, inside information is one. You stand to make a lot of money buying stock in a company that will be acquired by another at a premium tomorrow. If you have that information and act on it, you are trading on inside information and that can land you in jail.
4. Gathering Good Private Information is Expensive and Time Consuming – there are investors who are able to uncover information that is not priced in to a stock but is not considered inside information. This private information is valuable because it can lead to market beating returns. However, gathering private information typically requires significant resources, knowledge and time. For small investors, it is not feasible to do this kind of work across a broad range of stocks.
5. Information Causes You to Ignore the Market’s Message – when you have an understanding of a company’s story, there is a tendency to fall in love with that story and ignore new information that goes against your outlook for the stock. This leads the committed shareholder to hang on to a losing position, allowing the loser to bog down the performance of the overall portfolio.
6. You May Not Have All of the Information You Need – the market tends to focus on two or three key information points that affect the price investors are willing to pay for it. An investor who does a thorough fundamental analysis of the stock may still have an incomplete understanding of the company’s business. If missing one of the key points, this investor can make a gross error in valuing the stock.
7. The Market May Not Be Trading On Fundamentals – in theory, stock price is based on the present value of future earnings expectations. In practice, there are often very non fundamental influences on share price. A large investor that has a liquidity crisis may be forced to unload a large position with little regard for price. Often, the laws of supply and demand affect share price even though theory tells us that they should not have an influence.
8. Your Interpretation May Not Be the Same as The Market’s – Our mood affects how we judge information and the same can be said for the market in general. Your fundamental analysis may be correct in an optimistic environment, but if the market is in a pessimistic mood, the investment can lead to losses. Even the market is wrong, it is right.
9. There Is No Standard for What Information is Worth – There are many formulas for determining what a company’s share price should. Many fundamental analysts look for stocks to trade at a certain multiple of their earnings with that multiple to be based on growth. However, there are great variations in accounting methods that can have a profound effect on how earnings are reported. More importantly, there is no rule that a company should trade at a certain multiple of earnings, that target multiple is just an opinion.
10. We Tend to Focus On Information That is Easy to Get – we often looks for the easiest way to achieve a goal. With information, there is a tendency to focus on the information that is front of us. Rather than work to find something to disprove our thesis on a stock, we instead look for information to strengthen our thesis. In doing so, we present our own biased outlook for our investment decisions that can often be very incomplete and wrong.
Ultimately, I look at the market’s interpretation of all available information when I look at a chart of price and volume. It shows not only every bit of information detail but also what the market thinks of it.
![]()
In this week’s Market Minutes video, I show how you can use the Stockscores Market Scan tool to find stocks trading with abnormal price and volume activity. This week, I ran a scan that used those filter and found the following two stocks which are making breaks from good chart patterns.
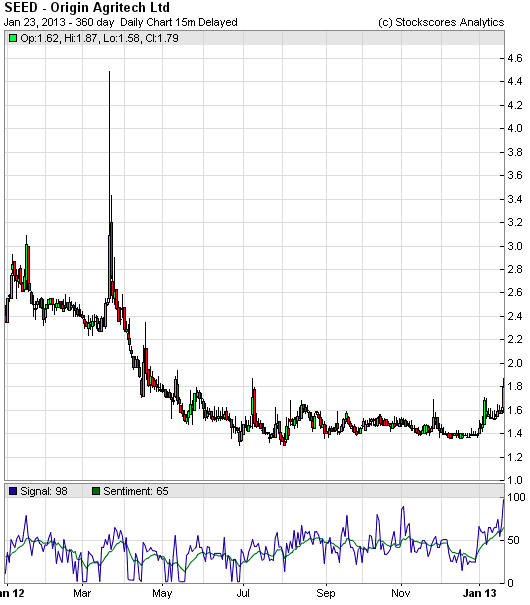
SEED has been a pretty boring stock lately, trading sideways and unable to get through resistance at $1.60. Today it broke through that price level with abnormal volume with a chart pattern that warrants strong Stockscores indicators. Support at $1.57.
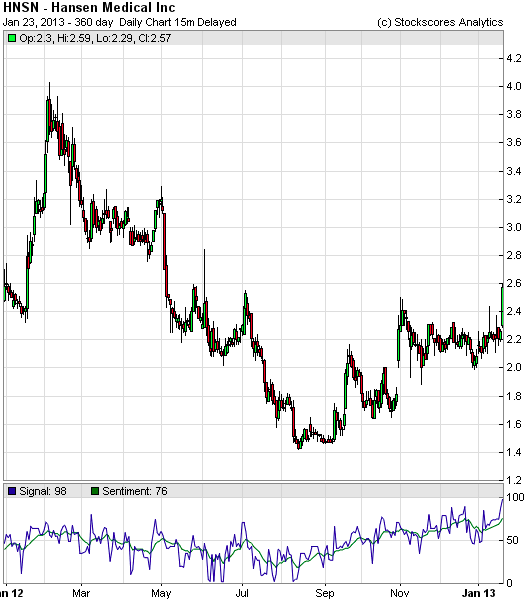
HNSN has been building rising bottoms on its chart since September and broke out through resistance today with abnormal volume supporting the break. Support at $2.18.
![]()
1. SEED
SEED has been a pretty boring stock lately, trading sideways and unable to get through resistance at $1.60. Today it broke through that price level with abnormal volume with a chart pattern that warrants strong Stockscores indicators. Support at $1.57.
2. HNSN
HNSN has been building rising bottoms on its chart since September and broke out through resistance today with abnormal volume supporting the break. Support at $2.18.
References
- Get the Stockscore on any of over 20,000 North American stocks.
- Background on the theories used by Stockscores.
- Strategies that can help you find new opportunities.
- Scan the market using extensive filter criteria.
- Build a portfolio of stocks and view a slide show of their charts.
- See which sectors are leading the market, and their components.
Disclaimer
This is not an investment advisory, and should not be used to make investment decisions. Information in Stockscores Perspectives is often opinionated and should be considered for information purposes only. No stock exchange anywhere has approved or disapproved of the information contained herein. There is no express or implied solicitation to buy or sell securities. The writers and editors of Perspectives may have positions in the stocks discussed above and may trade in the stocks mentioned. Don’t consider buying or selling any stock without conducting your own due diligence.

 Silver prices are up nearly 8% in the past couple weeks as investors increasingly load up on the white metal.
In fact, the U.S. Mint has temporarily suspended sales of its 2013 American Eagle silver coins because it has none left.
Reuters reported today (Friday) that the Mint plans to restart sales in the last week of January after it has had a chance to restock.
The U.S. Mint generally sees a big influx of demand when it releases new coins at the beginning of the year. This year, however, investors seeking a safe haven for their money added to the usual collector demand leaving the Mint’s vaults bare.
“It is easy to infer that some element of the fear trade may be at play,” Joni Teves, an analyst at UBS AG in London, wrote today in an e-mailed report cited by Bloomberg News. “We view the chunky sales of American Eagle coins more a function of seasonality than anything else. It is important to keep an eye on U.S. coin sales in the coming months to see if volumes remain elevated as the debt ceiling showdown plays out.”
Coins Not the Only Silver Play to Soar
…..read more of the article HERE

- International stocks continue to show strength
- The most interesting market in the world
- A reversal in the making…
Japanese stocks have been an absolute Dumpster fire for more than two decades.
Every peak stalled lower than the one before it. And unlike U.S. equities, Japanese stocks did not climb out of the 2008 financial crisis with any efficiency. In fact, the Nikkei would need to almost double from here if it were to top its 2007 highs.
Yet despite its recent history, something is different in Japan right now…
“It’s the most interesting market — technically — in the world…this is for real.”
That’s Barry Sine talking. He’s the director of equities research at Drexel Hamilton — and he’s known for using a combined approach of both technical and fundamental indicators to fuel his work.
Barry’s noticed a change in the Nikkei recently. He’s not alone. Volume has flooded into Japanese stocks as they have moved steadily higher for the past nine weeks:

It has been nothing short of a bullish reversal of epic proportions for Japanese stocks. A sharp downtrend was abruptly reversed as the Nikkei takes out its 2012 highs. Now its post-financial crisis highs are just a stone’s throw away…
Japan should already be on your radar. As a matter of fact, Bill Bonner mentioned it in his new trade of the decade all the way back in early January 2010.
“Let’s see, what has been beaten down, dissed, battered and abused for the last 20 years or more?” Bill mused three years ago this month. “What is it that people don’t want? What is it that they expect to go down…possibly forever?”
“Of course…Japanese stocks!”
A bull market in Japanese equities is coming. Get ready…the most interesting market in the world is primed for gains in the coming weeks and months.
 Rude Numbers
Targets, Predictions and Wild Guesses

Rude Trends
When to Buy… When to Sell

Stocks are riding high. But it’s time for a (short) break.
The key here is patience. A little reversion to the mean will do this market some good. Not only that, but it will give sidelined investors a better buy zone. If and when stocks retreat, we can watch for bullish bounces off the short-term moving average to offer us ideal buying opportunities.
Remember, we don’t like to see the market travel too far too fast. Keep a level head and don’t chase this week.
Ignore At Your Own Peril
Today’s Must-Read Links
- With the flip of a switch, doctors can now make the human body heal and regenerate itself — quickly, painlessly and naturally.
- See my next potentially-winning trade
- The safest way to earn 42%… Year after year


-
I know Mike is a very solid investor and respect his opinions very much. So if he says pay attention to this or that - I will.
~ Dale G.
-
I've started managing my own investments so view Michael's site as a one-stop shop from which to get information and perspectives.
~ Dave E.
-
Michael offers easy reading, honest, common sense information that anyone can use in a practical manner.
~ der_al.
-
A sane voice in a scrambled investment world.
~ Ed R.
Inside Edge Pro Contributors

Greg Weldon

Josef Schachter

Tyler Bollhorn

Ryan Irvine

Paul Beattie

Martin Straith

Patrick Ceresna

Mark Leibovit

James Thorne

Victor Adair