
Gold & Precious Metals
 Nope. According to this Bullish View (vs the Bearish View you can read HERE in Michael Campbell’s article today by Martin Armstrong)
Time to Sell Your Gold?
Precious-metals investors have had quite a scare in recent weeks. Since late November, gold has lost nearly $100 an ounce – a decline of almost 6%! During the same time frame, silver has slipped by nearly 12%.
Having a strong stomach is part of investing in a volatile market. If, like many, you are feeling financial heartburn over gold’s recent downward movement, I’d like to give you a reason to actually get excited when your favorite yellow metal takes a dive – a bit of journalistic Pepto Bismol, so to speak.
First, we’ll discuss the main driver behind gold’s most recent dip, and why this is just irrational herd behavior rather than financial and economic sense. Then we’ll review the reasons we own gold and why the recent price reduction is actually good for you as a gold investor.
An End to QE3?
Out from behind the black curtain came the news from the FOMC meeting:
“…a few members expressed the view that ongoing asset purchases would likely be warranted until about the end of 2013, while a few others emphasized the need for considerable policy accommodation but did not state a specific time frame or total for purchases. Several others thought that it would probably be appropriate to slow or to stop purchases well before the end of 2013, citing concerns about financial stability or the size of the balance sheet . One member viewed any additional purchases as unwarranted.” [Minutes of the Federal Open Market Committee, December 11-12, 2012]
This is the wonderfully wishy-washy, opaque language we’ve all come to know and love from the Fed and the FOMC. It leaves all options open while maintaining a level of uncertainty in the markets.
The media dumped fuel on the fire when it began asking if this statement foreshadowed an end to quantitative easing. With the potential for an end to the Fed’s money-printing – however unlikely – it’s no wonder that those without a solid understanding for gold investing got scared out of the market.
While the mainstream press was busy trying to define what the FOMC meant by “few” and “several,” they forgot about Ben Bernanke’s stated plan to tie the continuation of monetary stimulus to the rate of unemployment. Without an unemployment rate below 6.5% or a CPI above 2.5%, the printing will continue.
On January 4, 2013, CNBC’s Steve Liesman interviewed the president of the St. Louis Fed, James Bullard. When asked what time frame the Fed should end the current round of quantitative easing, Bullard firmly reiterated the Fed’s position:
“Why are we talking about dates? The idea is to have state contingent policy. This depends on the economy… It should be if the economy performs well in 2013, the committee will be in a position to think about going on pause with its balance sheet policy. If it doesn’t do well, then the balance sheet policy will probably continue into 2014.”
To take the point even further, let’s recall the tight spot the Fed is in with respect to the national debt andinterest rate policy. Consider these three facts:
- Interest rates are near zero. During the financial collapse in 2008, the Fed began a policy of ever-lower interest rates through purchases of both public and private debt. Yields on US Treasury bonds dropped sharply. Now, whenever we reach a point in time where the Fed has previously communicated that it would end its zero-interest-rate policy – or “ZIRP,” as some call it – the Fed reevaluates and states it will continue the policy for another few years.
- Federal debt is over $16 trillion and counting. With a deficit of over $1 trillion for the last four years, there is no historical evidence to say the debt will be shrinking any time soon. Also, if the recent fiscal-cliff fiasco is any indicator of future fiscal policy, the US government will continue to spend without much regard for the consequences.
- The Fed is now trapped in a vicious cycle. All of this newly available debt financing gave the government the ability to expand its social programs and foreign policy actions without paying the political price of higher taxes. However, the Fed was forced to hold interest rates low so the debt and deficits would remain manageable. Every percentage-point increase in the rate of interest now costs the US government an additional $160 billion. If the Fed allows the interest rates to rise to the natural market rate, it cuts off the source of fuel for the government’s political engine.
With every dollar of increase in federal deficit spending, the pressure on the Fed to maintain its zero-interest-rate policy and to continue to purchase Treasury debt increases. Also, even if QE3 does end, interest rates will surely rise, and the Fed will be forced to start up the printing press once again.
The takeaway here is that it’s important not to get caught up in the short-term price fluctuations, but to invest according to a long-term premise. And that premise is the same as it has always been: governments around the world will continue to print away their debts in order to maintain a constant stream of entitlements flowing into their constituents. Without the printing of fiat currency to buy voter support, a politician’s career becomes significantly shorter. If you still believe this premise, the long-term case for gold is open-and-shut.
The Fundamentals Haven’t Gone Anywhere
After reviewing the facts, it’s clear the Fed has no intention of ending its policy of continued monetary easing. The fears over a catastrophic drop in the gold market are unwarranted. Gold is still the best way to hedge against inflation.
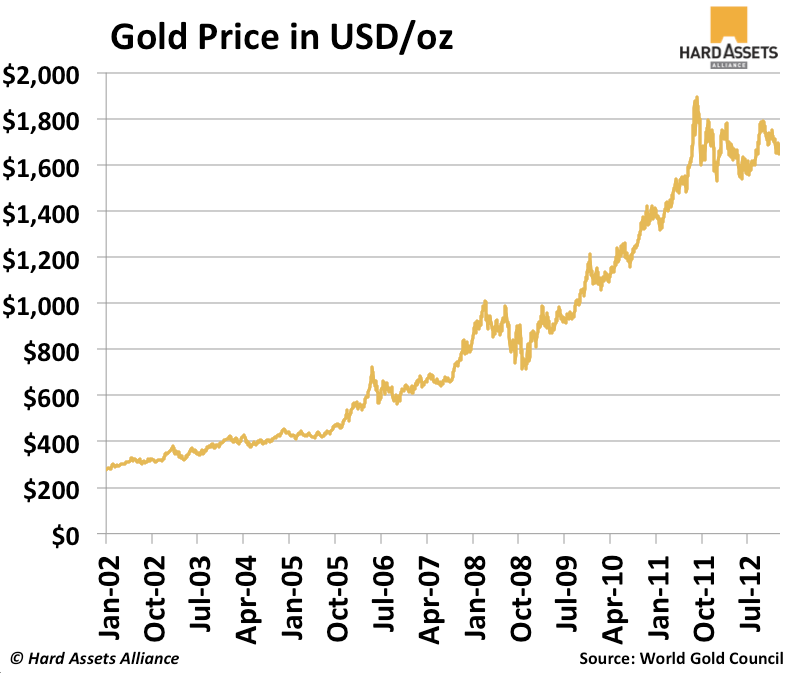
As was stated above, it’s important to look at the long-term trend for gold. The chart below illustrates this point beautifully. Gold has taken an aggressive, ten-year march with a short one-year break in 2012. Thus, if you held to the premise that gold is a long-term instrument for the preservation of wealth, you would have come out ahead had you purchased anywhere in the last decade.
So what does this most recent downturn mean for you, if anything? As you may have heard Chairman of Sprott US Holdings Rick Rule mention, the gold market is like any other market – including the supermarket. When your favorite food drops in price, you don’t sell your stockpile back to the grocery store. You buy more of it! The same is true for gold. Why not exchange some of that fiat paper for something you truly hold valuable? Better yet, why not make the exchange while that fiat currency is trading at a premium to gold?
If you haven’t already, please take some time to browse the Hard Assets Alliance site and consider opening a SmartMetals account. SmartMetals is a perfect way to acquire gold bars and coins with the added benefits of offshore storage. With storage facilities in New York and Salt Lake City as well as London, Zurich, Melbourne, and our new facility in Singapore, you will be able to diversify your assets internationally and avoid the political risks of any one nation. You can download the free SmartMetals Action Kit for more details.
The bottom line is this: Monetary easing will continue around the world. Governments cannot afford the political ramifications of austerity. As the short-term traders and uneducated investors dump their gold positions, use the opportunity to buy more. It has been our experience that these dips in price often result in a subsequent price surge. Gold is on sale, and sales don’t last forever…
Next, we’ll discuss how the paper/ETF markets affect the price gold in both inter-day and intra-day trading.
Jason
$20,000 in cash prizes to be won in The Horizons ETFs Biggest Winner Trading Competition. Learn more

Energy Stocks & Oil Special Trend Analysis Report
Crude oil has been trading ways for the past year between the 2011 high and low. The trading range through 2012 has been contracting with a series of lower highs and higher lows. This pennant formation because it is taking place after an uptrend is a bullish pattern with $110 and possibly even $140+ per barrel in the next 6-18 months.
If you look at the weekly investing chart of crude oil the key support and resistance levels area clearly marked. A breakout of the white pennant will trigger a move to the next support or resistance level. And judging from the positive economic numbers not only form the USA but globally the odds are increased for the $110+ price target to be reached sooner than later.
Crude Oil Price Chart – Weekly Investing

Crude Oil Price Chart – Daily short term Analysis & Target
If we zoom into the daily chart and analyze price and volume you will notice the $100 per barrel level is potentially only 2-3 days way… But keep in mind whole numbers (decade & Century Numbers) naturally act as support and resistance levels. So when the $100 century price is reached there will be a wave of sellers with fat thumbs who will slam the price back down to the $96 and possibly back down to the $92 level before oil continues higher.

Utility Stocks – XLU – Weekly Investing Chart
The utility sector has done well and continues to look very bullish for 2013. This high dividend paying sector is liked by many and the price action speaks for its self… Keep in mind you can view my actual watchlist of stock and ETFs I trade in real-time with my analysis free:https://stockcharts.com/public/1992897

Energy Sector Weekly Investing Chart
Energy stocks which can be followed using the XLE exchange traded fund (ETF) typically leads the price of oil. Looking at energy stocks we can see that they are outperforming the price of crude oil and on the verge of breaking out of a large Cup & Handle pattern. If so then $90 is the next stop but prices may go much higher in the long run.
Energy Stocks and Crude Oil Conclusion:
In short, crude oil is stuck in a large trading range much like gold and silver which I just wrote about here: http://www.thegoldandoilguy.com/articles/precious-metals-miners-making-waves-and-new-trends/
Once a breakout takes place on either the white or yellow lines on the first crude oil weekly chart we should see oil, energy and utility stocks start making some big moves. Depending on the direction of the breakout (Up or Down) it must be played in that direction to generate substantial profits obviously.
Get my daily analysis, updates and trade alerts here: www.TheGoldAndOilGuy.com
Chris Vermeulen

 Few know that Albert Einstein invested much of his 1921 Nobel Prize money in stock markets. However, he lost a bulk of it in the stock market crash in 1929. Pity that he could not lay his hands on Benjamin Graham’s Security Analysis that was first published only in 1934.
Why couldn’t possibly the smartest man not make money but even lose it? What was lost on Einstein is not a secret formula to help find cheap stocks. But the behavioral trait to buy only when others are fearful.
….read the rest HERE
Ed Note: If fear ruled investors as they were afraid to buy Gold at $104 in 1976 or $250 in 1999 are they still fearful with Gold at $1,650? That question was answered by one of Michael’s avorite analysts in the Free Over My Shoulder yesterday.
Martin Armstrong:
“The simple fact is gold has rallied for 13 years. The Goldbugs have sold gold to just about everyone who would listen.”
“France has shut down the gold market prohibiting the purchase of gold for cash. Governments NEED money and they will be very nasty before this whole thing collapses”
“Markets decline when everyone is long. They start to sell and there is no bid. You simply run out of energy to keep moving in the same direction” “Gold remains vulnerable to a collapse. A monthly closing beneath 1532 will signal that a drop to the mid-1100 zone is likely” – Martin Armstrong
“I have often said that Martin Armstrong is the most interesting economist I have ever met. His methodology has produced some of the most astoundingly accurate predictions on record including the fall of the Berlin Wall, the exact date of the peak in the Nikkei Index and crash of October 19, 1987 and its subsequent recovery. The list is a lot longer but you get an idea why I read Marty every chance I get. I thought his latest piece is important to read to counter balance the constant bullishness we hear. The key is to understand that a break of the current lows of $1626 in gold is needed to trigger the next downside boundaries of the lows formed in April of 2012 at the $1529 to $1532 level. Keep in mind that Marty’s negative projection is ONLY triggered if gold finishes a month below $1532″ – Michael Campbell
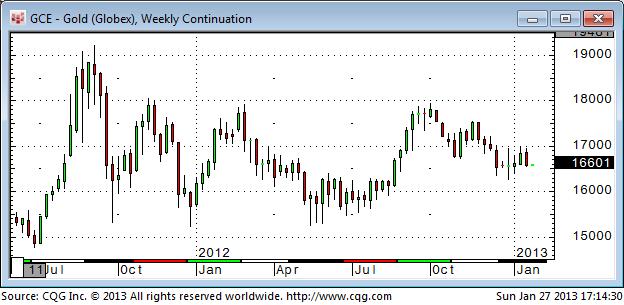
Click HERE or on the chart for a much much larger chart.

Martin does not think Gold is in a Bubble like it was at $850 in 1980. In Mike’s Over My Shoulder article he thinks after a correction it will go higher yet.
.

Gold had a very negative Weekly Key Reversal Down last week…it has trended lower from $1800 since October 2012…it SHOULD be getting a lift from the dramatic Japanese reflationary activities…indeed it traded to All Time Highs against the Yen…but it’s weak against a number of other important measures…it’s trading at 12 month lows against the Euro…it’s fallen ~13% against WTI in the last 6 weeks…and in terms of the S+P 500 gold is at 2 year lows…stocks are stealing “market share” from gold…see charts below.
Negative price action:
Gold saw very negative price action…foreshadowing lower prices ahead… on November 28 when it fell $40 on the Comex futures market on All Time Record High Volume…(I discussed that price action on my November 30 blog [hyperlink: http://www.victoradair.com/blog/marktet-trades-sound-bites-nov-30] and speculated that a break of $1700 could ignite some real downside pressure.) In November 2012 the selling pressure on gold seemed restricted to the “paper” futures market…anecdotal reports were that “physical” gold buying was increasing as prices fell…indeed, outstanding Gold ETF’s rose to new record highs in early December.
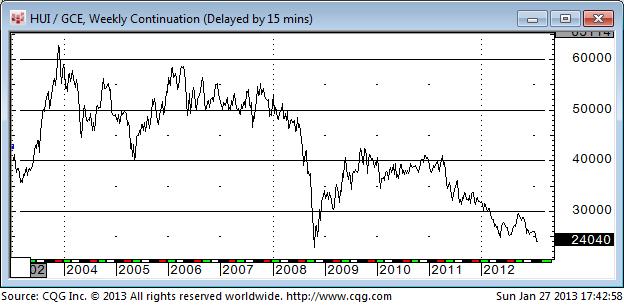
But now the bearish Market Psychology seems broad based…the selling is not just in the “paper” market…gold ETFs are declining and the gold share market is a disaster…the HUI/Gold ratio is at an 11 year lows (save for a very brief period in October 2008) and other gold share/gold ratios are also at multi-year lows…as the gold share indices themselves fall to new lows. I cautioned against buying gold shares several times last year…I called it, “The mistake you are dying to make”…in addition to the usual reasons given for the gold share weakness [gold ETFs, rising operating costs, country risk etc.] I suggested that there were simply WAY TOO MANY gold shares outstanding…that the SUPPLY of gold shares had overwhelmed DEMAND.
The Weak US$/Strong Gold relationship is breaking down…because the Euro is strong:
Gold is falling in US$ terms even as the US$ falls relative to the Euro. Last summer the Euro was under severe pressure…trading at 2 year lows near 1.20…Spanish bond yields were north of 7% and short term interest rates in several of the “strong” European countries were trading at negative nominal yields…then Draghi made his “whatever it takes” comments and the Euro has been climbing ever since…now very close to last year’s highs of 1.35 against the US$ …up 22% in the last 4 months against the Yen…obviously there has been a serious change in Euro Market Psychology and some serious “short covering” in the Euro…and not just against the US$.
A Gold Bug sees what he wants to see, and disregards the rest…Gold to Germany:
With apologies to Paul Simon…I don’t see any bullish significance in Germany’s plan to repatriate some of their gold. They moved the gold away from the Russian Front during the Cold War…now they think it’s safe to move it back home. The Gold Bugs, however, see the repatriation plan as bullish because they believe that the German gold is “missing” (along with a lot of other gold that is supposedly in secure storage at the Fed and the BOE.) Their theory is that the gold has been fraudulently sold into the market to keep prices down…and that Germany’s plans will expose this fraud and gold prices will soar.
Charts:
Gold had a Weekly Key Reversal Down last week…setting up a possible challenge of the late December $1625 lows.
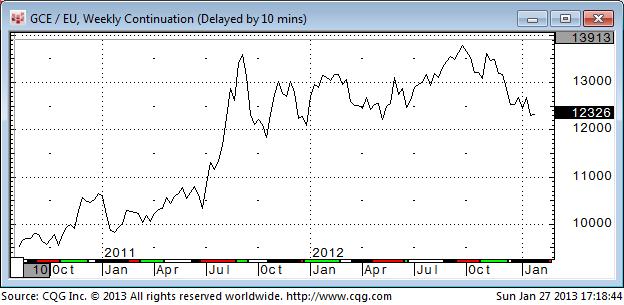
Gold is trading near last year’s lows in terms of the Euro…down over 10% from the All Time Highs made last September.
But in terms of the Japanese Yen Gold made new All Time Highs in early January.

In terms of the S+P 500, however, gold is trading at 2 year lows…down 32% from the 23 year highs made August 2011…(gold is down 13% against the US$ since then)…global stock markets have greatly out-performed gold…and especially gold stocks since the summer of 2011.
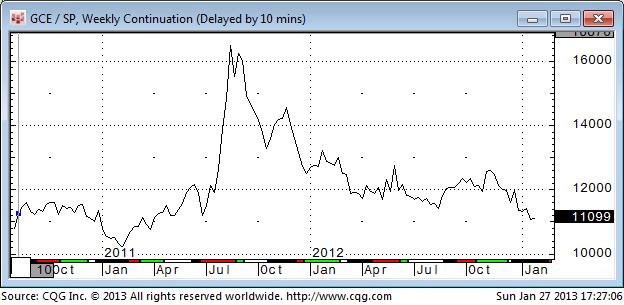
While gold has trended down from its All Time Highs made September 2011 the S+P 500 (and most other global stock indices) have trended higher. The S+P is now at 5 year highs…only 5% away from its ATH made October 2007. Market Psychology is very bullish in stocks…the VIX is at a 5 ½ year low…the market thinks it has a “blank check” from the Central Banks…and stocks are clearly stealing “market share” away from gold.

Gold share indices are even weaker than gold…with the HUI at an 11 year low (save for a very brief period in Oct 2008) against Gold.
Futures markets provide an efficient and effective way to trade the Gold Market. If you would like to speak to a broker at PI Financial about trading gold in the futures market please call 604-664-2842.


-
I know Mike is a very solid investor and respect his opinions very much. So if he says pay attention to this or that - I will.
~ Dale G.
-
I've started managing my own investments so view Michael's site as a one-stop shop from which to get information and perspectives.
~ Dave E.
-
Michael offers easy reading, honest, common sense information that anyone can use in a practical manner.
~ der_al.
-
A sane voice in a scrambled investment world.
~ Ed R.
Inside Edge Pro Contributors

Greg Weldon

Josef Schachter

Tyler Bollhorn

Ryan Irvine

Paul Beattie

Martin Straith

Patrick Ceresna

Mark Leibovit

James Thorne

Victor Adair