
Energy & Commodities
Condensate is essentially a very light oil which is condensed from rich natural gas and solution gas from oil. And the price of it is skyrocketing, because it’s used to dilute both regular heavy and synthetic oil from the oilsands. It’s the saving grace for a lot of Canadian producers.
See this chart below. It shows Canadian condensate prices against WTI—see how the value of condensate is rising rapidly? In August 2012 it was only $3/barrel more than WTI. Now it’s $14 more—giving producers with lots of condensate even better economics than most oil producers!
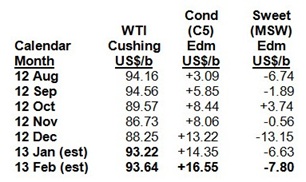
And prices will only get better for condensate producers, one Alberta based oil and gas marketer told me, asking to remain anonymous.
“Supply and demand (for condensate) are just touching each other. Any more heavy oil coming onto market will have a big impact. We need to find other sources (of condensate).”
Or, he says, condensate prices could go even higher. He estimated that if the oilsands increases production by some 400,000 barrels per day (bopd) a year for the next several years, an extra 100,000 bopd of condensate is needed—each and every year.
I’ll explain in my next story, condensate part III, how US imports of condensate are happening, but not fast enough.
In Canada, most condensate is found in shale and tight gas formations. In the US, it’s mostly in gas associated with shale oil, especially the fast-rising Eagle Ford play.
In the United States, all this condensate is almost a problem. US refiners spent billions of dollars over the last decade to process more heavy oil. As a result they can’t really handle this light stuff.
But for Canadian gas producers, condensate is the only product that gives them substantial positive cash flow (a very few producers do make some cash flow on dry gas.) That’s why it’s so important to know how much condensate the gas producers are flowing.
Canada’s Thirst for Condensate
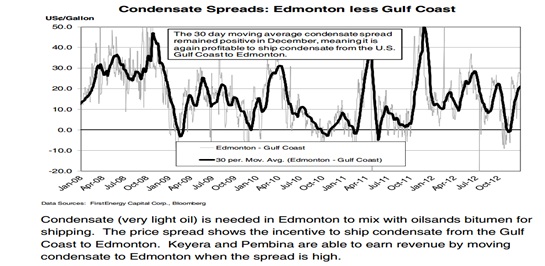
In the oil sands, condensate is used as a diluent to ‘thin down’ bitumen – a thick, sludgy substance – so it will flow through pipelines. Since bitumen production is climbing steadily, condensate demand is on the rise. Supply is struggling to keep up.
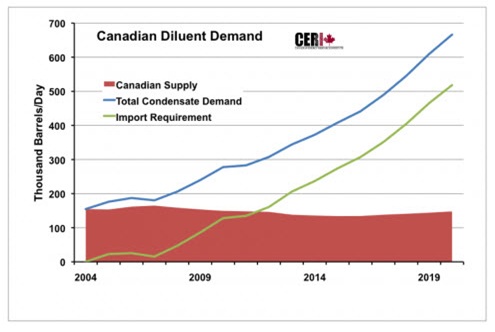
Canada now uses some 275,000 barrels of condensate per day as diluent. Canadian producers churn out 165,000 barrels per day (bpd), meaning oil sands operators already rely on imports to fill a 110,000-bpd gap.
That’s good, but it will probably get even better. Capital spending in the oil sands is expected to exceed $20 billion per year for the next five years. The more bitumen that is pulled from the sands, the more diluent Alberta will need to move all that heavy oil to market.
This year Canadian demand for condensate is expected to average 300,000 bpd. By 2020 demand is expected to reach 670,000 bpd, according to the Canadian Energy Research Institute, which also provided the following chart.
One issue is that Canadian NGL processing facilities are basically full. That is impacting (reducing) condensate production in the short term—creating further supply stress.
So Canadian producers are shipping in tanks directly to their wellsites, and trucking it to local markets; they’re not sending via pipe to processing plants (fractionation plants). The other reality is—and I’ve said this many times—the energy game is changing so fast in North America—fast rising production in both oil and gas, new channels to market (rail)—that nobody knows what the landscape is going to look like 2-4 years from now.
That uncertainty is causing Big Energy Money to be cautious about increasing refining capacity for oil and gas in Canada—which again, is good for commodity prices.
The second bottleneck is pipeline capacity INTO Canada.
The US is actually swimming in condensate–it accounts for as much as half of the output from US shale oil and gas basins. Refiners are buying some of it simply because it is cheap, but a condensate glut is also developing in the Lower 48.
Now however, there is only Enbridge’s Southern Lights pipeline bringing condensate into Canada, and it’s not near enough. (There is some incoming condensate by rail, but now that is still small.) In Part II of this series, I’ll explain in detail this bottleneck, and what’s happening to get rid of it.
Once that glut starts moving into Canada apace, the price premium that Canadian condensate producers are currently enjoying will shrink. Condensate will still carry a good price, but the edge will be smaller.
But I expect that to be at least two years away, and if oilsands production keeps increasing, it may be even longer.
In conclusion—the growing demand for condensate in the oil sands is driving up its price. This isn’t just saving the lucky Canadian gas producers who have high condensate levels, it’s giving them better economics than most oil producers.
Pipeline bottlenecks in the US and processing plant issues in Canada should conspire to keep condensate prices high—making it the best (and least volatile) upstream commodity stories in North America.
Next, I’ll explain in detail what’s happening to condensate in the US, and the efforts to get as much up to Canada as fast as possible. In general, ‘fast’ means 2014 at the earliest, giving investors lots of time to benefit from strong domestic condensate prices.
Keith
P.S. I think mid-February is one of the BEST times for investors to discover my #1 condensate play in Canada. Learn all about my Top Pick risk-free right HERE.


 In Switzerland, it’s not just the clocks that are cuckoo. Over the past four years Swiss politicians and central bankers have gone on an unprecedented buying spree of foreign exchange reserves. In 2012, their cache swelled to as much as $420 billion worth of various currencies, primarily the euro. This figure is a seven-fold increase since 2008 and equates to 70% of the country’s annual GDP. The sum translates to $200,000 per family of four, enough to keep the Swiss in clocks, chocolates, and fondue for many years to come. The Swiss leadership will claim the money has been “invested” with an eye to the future, but what they’ve done is impoverished themselves in the present. Although such a decision seems perverse, it makes perfect sense when seen through the lens of today’s presiding economic thinking.
For the past few generations Switzerland has enjoyed some of the strongest economic fundamentals in the world. The country boasts a high savings rate, low taxes, strong exports, low debt-to-GDP, balanced government budgets, and prior to a few years ago one of the most responsible monetary policies in the world. These attributes made the Swiss franc one of the world’s “safe haven” currencies. But in today’s global economy, no good deed goes unpunished.
Central bankers around the world, particularly in Washington, Frankfurt and Tokyo, have been engaged in a massive and coordinated campaign of currency debasement to combat the recession. But for years the Swiss refused to join in the printing parade. As a result, investors around the world wisely decided to park their savings in the reliable Swiss franc. From December of 2008 to August 2011 the franc appreciated an astounding 59% against the U.S. dollar and approximately 30% against the Japanese yen. More importantly, the franc gained 42% against the euro. As the Eurozone completely surrounds Switzerland, its trade with those countries represents the vast majority of its international transactions.
During this massive run up in its currency, the Swiss economy continued to prosper. Wages and purchasing power increased and GDP grew consistently faster than other countries in Western Europe. Despite generally positive export statistics, some Swiss exporters noticed that at times the strong franc put them at a disadvantage against foreign competitors. In addition, the strengthening currency helped keep a lid on consumer prices, giving Switzerland a consistently low inflation rate with occasional bouts of actual deflation. Despite the fact that Switzerland was an island of economic health amidst a sea of problems, the reigning economic orthodoxy convinced Swiss leaders that their strong currency was a burden rather than a blessing. More pointedly, the rise in the franc was seen as a repudiation of the expansionary policies occurring in other countries. And so the Swiss government decided to join the currency killing party.
In early August 2011, the Swiss National Bank took a series of steps to reverse the fortunes of the franc. In the simplest terms, they sold francs and bought foreign currencies, most notably the euro. The announcement included a promise to buy unlimited quantities of foreign exchange to maintain a floor of 1.20 francs per euro. In so doing, the Swiss essentially outsourced their monetary policy to the Eurozone. Any moves taken by the European Central Bank would need to be matched by the Swiss. Ironically, it was fear of this outcome that kept the Swiss from adopting the euro in the first place. Despite the former bias toward independence, the Swiss have de facto adopted the euro anyway. Since that time, the franc has fallen 16% against the dollar, Swiss foreign exchange reserves have skyrocketed, and investors who bought francs as a means to escape debasement have been betrayed.
Productive nations generate excess goods and services that can be sold abroad and their growth and stability attract investment funds from abroad. These conditions will tend to increase demand for the nation’s currency, thereby pushing up its price. A strong currency keeps capital and raw materials costs low, enabling more productive workers to earn higher real wages. But according to most economists, a strong currency will bring down an economy because it destroys international competitiveness and can even lead to lower prices (deflation) which they see as economic quicksand. These fears have ignited a “global currency war” in which countries are expending huge amounts of national savings in order to ensure that their currencies stay cheap. In today’s economic logic we must fail in order to succeed.
But it is very easy to have a weak currency. All that is needed is an unlimited willingness to print. A strong currency requires real fiscal discipline and actual production. Yet, like the weight loss TV show, economists believe that the winner of a currency war is the biggest loser. You win not by killing your competitors, but by killing yourself! It’s like a student convincing his parents that an “F” is a better grade than an “A.” And if a straight “F” report card results in parental accolades rather than anger, the students will lack any incentive to improve performance. Similarly, as nations like Switzerland strive to reduce their own grades, the failing nations have a reduced incentive to change their study habits. Without outside support, nations with collapsing currencies would see huge increases in consumer prices. The resulting fall in living stands would force productive reform.
I take the minority position that just as it is better to be rich than poor, a strong currency is better than a weak one. Although much more credentialed economists may try to muddle the arguments, the truth may be seen when a particular position is taken to its logical extreme. If a weaker currency is preferable to a stronger one, then logic would dictate that a currency of no value will be preferable to one with an infinite value. But how would economies with these drastically different currencies operate?
It is true that the country with the zero value currency will tend to see full employment and strong exports. The relative low cost of labor will mean that the locals could be easily employed in even the most marginal activity. But since holders of other currencies will be able to outbid the domestic population for all of their production, everything produced will be exported. Imports will be zero as the local population would be unable to afford anything produced in countries with more valuable currencies. As a result, actual consumption would be extremely low. In essence this economy would be analogous to impoverished, subsistence level economies such as Bolivia, Zimbabwe, and Haiti.
In contrast, a country with an infinitely valuable currency would see the best of all possible worlds. Even the smallest amount of money would allow citizens to buy huge amounts of goods from abroad. An evening’s babysitting money would deliver more purchasing power than months of hard labor in poorer countries. The strong currency would mean that consumption would soar even while hours worked fell. Savings would increase in value, and people would have more ability to travel and pursue leisure activities. In essence, we are describing a rich economy.
Placed in such a context, it’s easy to see the preferred option. Those who believe in the benefits of weak currencies do not specify when a falling currency becomes a bad thing. Clearly there must be a tipping point where lost purchasing power overcomes supposed gains in growth. Yet they are silent on that point. My position is that a rising currency is always good. No magic tipping point needs to be identified.
The problem is that economists now believe that the goal of an economy is to provide employment, not goods and services. They see a job as an end in and of itself, rather than as a means for people to get the things they really want. But if we can get all that we want without having to work, who needs to bother? A strong currency takes us closer to this goal. It is a testament to how far the “science” of economics has fallen that this goal has been utterly forgotten.
But this junk science is killing real growth. As long as this “black is white” ideology remains in place, the biggest printers will continue to be the biggest actual losers.
To order your copy of Peter Schiff’s latest book, The Real Crash: America’s Coming Bankruptcy – How to Save Yourself and Your Country, click here.
For in-depth analysis of this and other investment topics, subscribe to Peter Schiff’s Global Investor newsletter. CLICK HERE for your free subscription.

The continuing short term stock market spurt triggered by better than expected fourth quarter results has provided an opportunity to take profits on strength on a wide variety of seasonal trades (e.g. agriculture, technology, semiconductors, biotech) and to rotate into other sectors that have a history of outperformance during the January to April period (e.g. energy, platinum, copper).
History shows that U.S. equity markets in the year after a Presidential election move higher into the first week in February in conjunction with fourth quarter reports, weaken thereafter until the end of March and moves higher thereafter. Given political events scheduled in the U.S. during the next two months, history is repeating.
Equity Trends
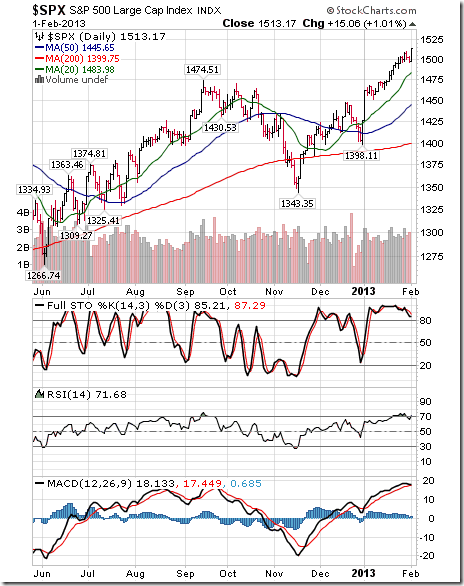
The S&P 500 Index gained 10.21 points (0.68%) last week. Intermediate trend is up. The Index remains above its 20, 50 and 200 day moving averages. Short term momentum indicators remain overbought and showing early signs of rolling over.
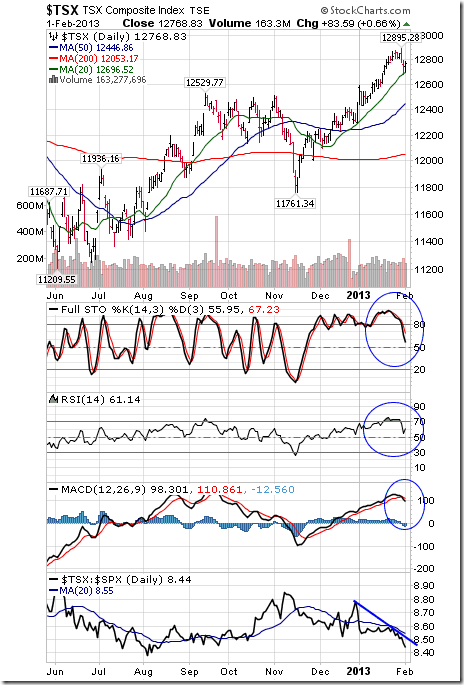
The TSX Composite Index eased 47.20 points (0.37%) last week. Intermediate trend is up. The Index remains above its 20, 50 and 200 day moving averages. Short term momentum indicators have rolled over from overbought levels. Strength relative to the S&P 500 Index remains negative. The Index has a history of outperforming the S&P 500 Index between now and the first week in March.
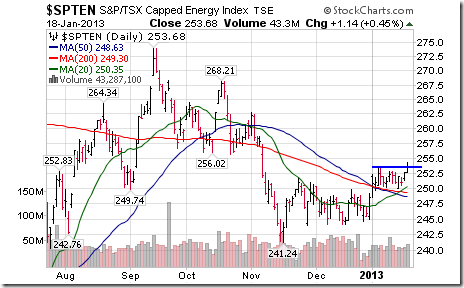
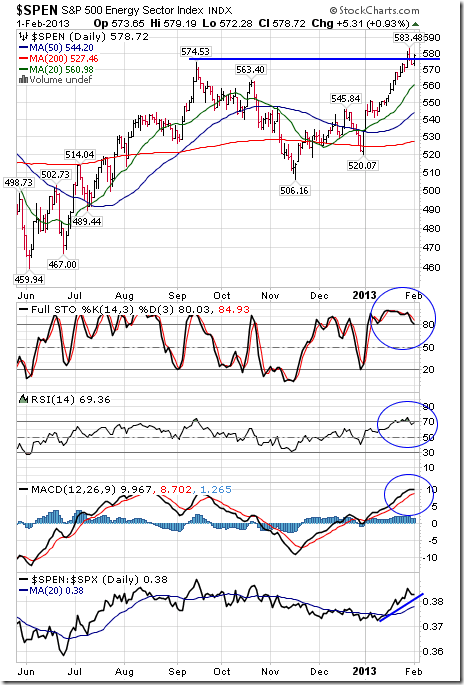
The S&P Energy Index gained another 5.46 points (0.95%) last week. The Index broke above resistance at 574.53. The Index remains above its 20, 50 and 200 day moving averages. Strength relative to the S&P 500 Index remains positive. Short term momentum indicators remain overbought.
Platinum slipped $4.30 per ounce (0.25%) last week. Intermediate trend is up. Strength relative to gold remains positive.
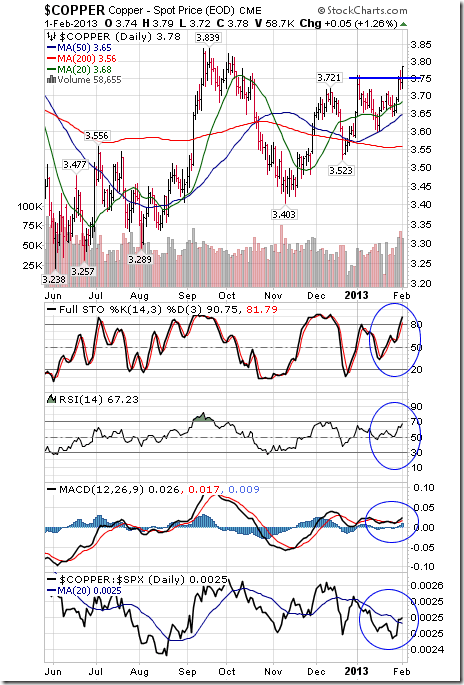
Copper gained $0.13 per lb (3.56%) last week. Intermediate uptrend was confirmed on a break above $3.76. Copper remains above its 20, 50 and 200 day moving averages. Strength relative to the S&P 500 Index changed from negative to at least neutral. Short term momentum indicators are overbought.
……go HERE for agriculture, technology, semiconductor, biotech and 45 Charts & Analysis on Don’s Super Sized Monday Report HERE

However, we have to keep in mind that we just had one of the best January market performances in history, with the markets rising 12 out of the last 14 days. This could mean that near-term buying may soon be exhausted.
Let’s also consider some historical factors.
As I mentioned last week, the Dow Industrials has not performed this well since 1994. But that same best January in 1994 was followed by a nasty decline of 10% the month after.
Following an election year, the market has a tendency to go higher up until the beginning of February, From here, it historically takes a slight correction for about two months before going higher and peaking around May.
The goal of QE was to instill confidence in the market by inflating asset prices. The stock market is now back to near all-time highs and the price of assets around the world are near record bubble levels.
While the market is still giving investors jitters, it has shown tremendous strength from QE.
It may not feel like it for many Americans, but with the Dow breaching 14000, shareholders and investors have seemingly recovered more than $8 trillion in wealth lost during 2008.
The market cycle has forced those investors who lost their money in 2008 out of the market, but has brought in new money from new investors. It has created a wave of new millionaires and billionaires, with the population of millionaires in America now higher than in 2007.
According to the Federal Reserve, between 2007 and 2009, more than a third of the top one percent was replaced by new money.
And this new money is spending big time.
Prices for wine, fine art, collectibles, luxury cars, jewellery, and watches are all climbing far past their 2007 highs. Prices for exotic mansion homes are also soaring. And the wait-list for Ferraris and Lamborghinis are back to pre-crisis levels.
How can anyone say QE hasn’t worked?
It would seem everything is back on track and back to normal. Employment is slowly rising again, along with housing. The stock market is back to pre-2008 levels and investor sentiment is climbing higher. We have been on a major bull run since the 2008 crash.
That’s scary.
While QE most certainly has its positives, it also comes along with a lot of negative consequences.
(*the big difference between the Fed and other banks is that the Fed is the one bank that never gets audited.)
In short, every bank runs a Ponzi-like credit scheme. For example, when you go to the bank and deposit your money, the bank takes that money and lends it out to others willing to pay the price. The bank uses your money and receives interest from those who want to borrow it.
But your bank never holds the same amount of money that has been deposited there. In other words, it lends money out, even if the money isn’t there. As more deposits are made, more credit is created; thus forcing a leveraged multiplier of credit that is ever-increasing.
Everything has its cycle, including the banking system; including the Fed.
When a bank begins to lend money, interest rates are setequal to the amount of money in the system. But as more credit is created, and thus more money in the system, interest rates begin to drop and the borrowing begins to become more speculative as both borrowers and lenders take on more risk. Eventually, this process multiplies and gets to the point where additional credit is required just to cover the interest payments on the original loans.
Compare this to America’s current situation. Where do you think we are in the cycle of the banking system?
Is America able to pay off its debt without having to borrow? No.
Is America able to pay even the interest on its debt without borrowing money (ie. printing)? No.
What’s the eventual end result of the cycle? Accelerating inflation.
We are seeing the markets move up, but it hasn’t moved up because of productive innovation or real growth. It has moved up because of market speculation based on cheap credit and a growing money supply.
Investors and the CEOs of many junior companies can’t seem to understand why the bankers are not pouring money into small business development and transitioning them into the public markets. The answer is that the system is now dominated by leveraged speculation that hinders real growth.
All of the money being created is being fuelled more and more into the hands of creditors and market speculators, and less and less into the real growth of the economy. That is why we will likely continue to achieve even less economic growth in the coming years, despite what the stock market is telling us.
The current credit bubble in the US is now at $58 trillion and counting. The more money printed the less affect it has on the real world economy. Every dollar of new credit generates less and less dollars of real GDP. It now takes us $20 of new credit to generate $1 of real GDP; it took only $4 in the eighties.
There’s no turning now. That is why Bernanke just announced last week that he isn’t close to easing up on the $85 billion in monthly bond purchases, despite remarks earlier in the month that hinted he might.
Let’s get real. As I have mentioned time and time again, the printing cannot stop now; not until we see major growth in the economy or a major growth in inflation, neither of which seem within reach in the short term.
Obama and the Fed will do whatever they can to spur growth. This includes allowing the no-money down mortgages again; the same strategy that pushed many homeowners into foreclosure during the housing bust.
More credit will be forced into the economy through many different vehicles, leading a cycle that only ends with higher inflation in the long term.
In the last year, we have witnessed the US market, including the NASDAQ, DOW, and S&P 500, climb over 10%. Yet here we are with a much more stable monetary system, and our Canadian market remains subdued; climbing less than 2% over the last year and down nearly 2% over the last five. Meanwhile, in the last five years, the S&P is up over 13%, the Dow up 15%, and the NASDAQ up an astounding 38%.
I’ve always said the retail market and the media is often late to the party, and that is how we’ve been able to accurately forecast market events. But when it comes to timing, no one is later than the Canadian market.
So what do we do from here?
Again, I must stress that the market is fuelled by sentiment more than fundamentals. This is especially the case when it comes to our less liquid Canadian market. The fact that there are many Canadian companies trading at cash value says it all. We’ve done nothing for the last five years but watch the world markets climb.
We need a real spark to get the Canadian markets moving again, and I am not exactly sure where it will come from at this point.
However, from a historical timing perspective, now may be the time to get involved.
From now until the first week of March, the TSX has outperformed, on average over the last 20 years, the S&P 500 by about 2.5%. Not only is it RRSP and TFSA contribution time, the seasonality of the TSX-dominated sectors (financials, energy, and materials) generally do well around this time.
We’re already seeing the financial sector move up slowly, and energy has been climbing over the last 2 weeks (as predicted in Prepare for a Crisis two weeks ago). While the materials sector hasn’t produced results yet, we just saw the price of copper, nickel and zinc break above key resistance levels this week. While this hasn’t translated into stocks, we could see a little fuel into the sector over the next month.
 We’re nearing a tipping point where investable assets are posing too much risk for too little return. The yields in long-term bonds are becoming too low for the amount of time you have to hold them and credit spreads are too tight relative to default risk.
 If the market continues in this speculative manner, we may soon see PE (Price-to-Earnings) ratios that are too high relative to growth risks. That’s when credit will be used in exchange for real assets such as gold, silver and real estate. This won’t happen overnight, but it is already slowly happening; beginning with the wealthiest people in the world…
The idea is to turn paper into something tangible such as gold and other commodities; anything that can’t be created or reproduced as easily and as fast as credit and currency.
I will be pulling the triggers on some new investments soon.
Don’t forget to share your success with us by filling out our testimonials page!
Ivan Lo
Equedia Weekly
Questions?
Call Us Toll Free: 1-888-EQUEDIA (378-3342)

-
I know Mike is a very solid investor and respect his opinions very much. So if he says pay attention to this or that - I will.
~ Dale G.
-
I've started managing my own investments so view Michael's site as a one-stop shop from which to get information and perspectives.
~ Dave E.
-
Michael offers easy reading, honest, common sense information that anyone can use in a practical manner.
~ der_al.
-
A sane voice in a scrambled investment world.
~ Ed R.
Inside Edge Pro Contributors

Greg Weldon

Josef Schachter

Tyler Bollhorn

Ryan Irvine

Paul Beattie

Martin Straith

Patrick Ceresna

Mark Leibovit

James Thorne

Victor Adair