
Energy & Commodities
Condensate is making uneconomic gas wells profitable for producers in the shale basins of northern BC and Alberta, and creating some great investment opportunities for informed investors.
The Shale Revolution has transformed America’s energy scene. After decades of decline, US oil production is again on the rise. The turnaround has been even more dramatic on the natural gas front: shale wealth has transformed the country from an importer to an exporter and pushed prices to historic lows.
Eagle Ford producers drilled their wells looking for oil or gas. Condensate was an unexpected bonus – but it now makes up as much as 40% of the hydrocarbons produced from the formation.
Since it is produced alongside oil and since it is in fact oil, producers lump condensate with oil when reporting production volumes. As a result, it seems like US oil production is shooting through the roof. But while domestic output is certainly rising, lumping condensate in with crude is misleading because not every hydrocarbon molecule is created equal – especially through the eyes of a refinery.
What Is This “Freak of Nature” Gas Play?
And in this new briefing, I take you through, point by point, why I think this one natural gas stock, a pure play on gas, could be the single best trade in the sector – junior, intermediate or senior.
Keep reading here to learn more…
The refineries can handle shale oil. They cannot, however, handle much condensate.

From Houston, the condensate from Kinder’s line moves through the company’s Explorer pipeline to Hammond, Illinois.
Condensate capacity from the US to Canada should increase dramatically—but it is over a year away. Oil and gas marketers in Alberta tell me oilsands production is rising fast enough to use a lot more condensate—but only time will tell if the market stays in balance, over-supplied, or under-supplied.
– Keith

Sales rebounded after the December Bi-Polar festivities were out of the way and inventory gushed back onto the market. Hopefully Realtors persuaded their Vendors to reduce prices on all the re-listings otherwise it’s doubtful that the sales momentum will lift all boats (Momentum Chart).
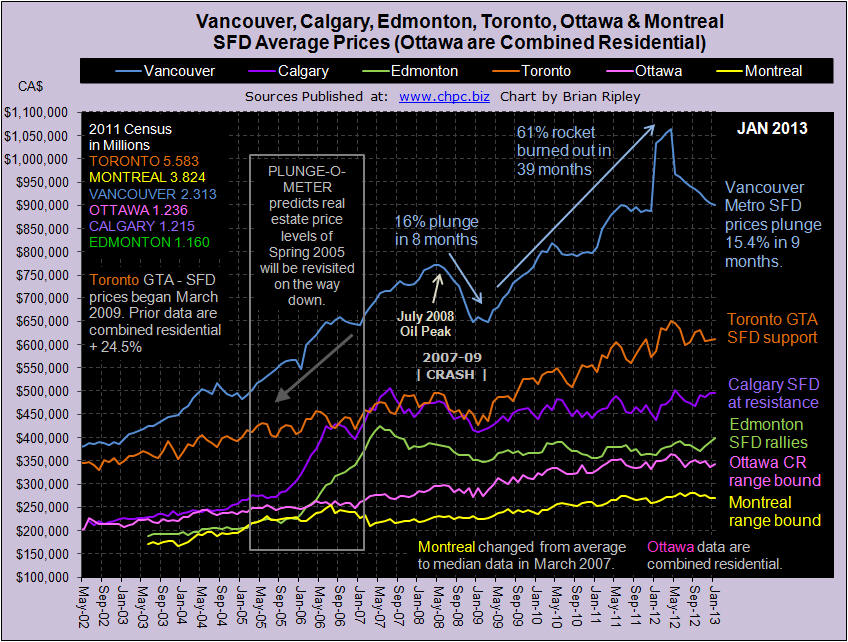
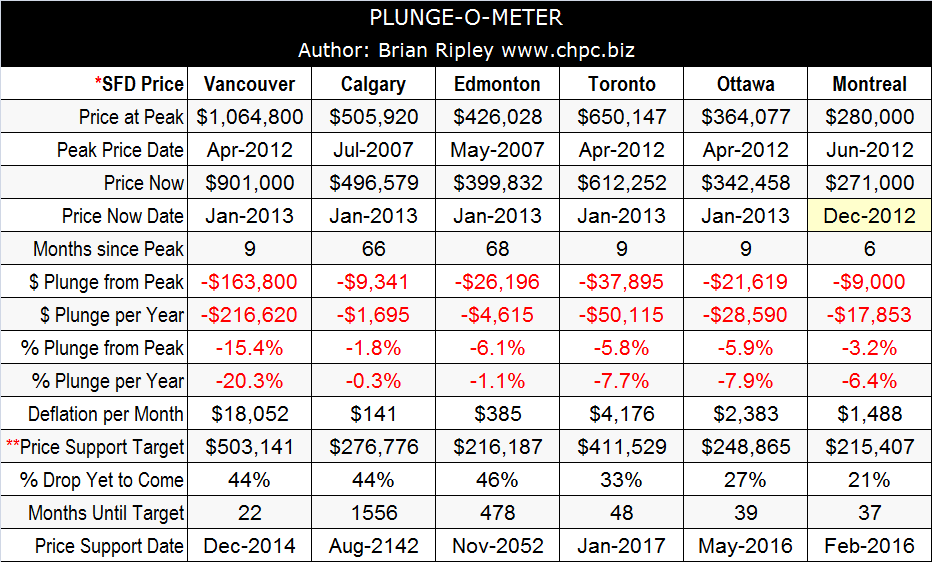
The counter trend rally going on in Alberta is being stoked by thin supply (Scorecard) and fantastic Earnings; and Calgary has almost made it back up to its peak SFD price from 66 months ago (Plunge-O-Meter). Readers on this site who have voted (Sentiment Polling) are saying that 12 months out, Calgary may be able to defend its pricing model from the bears who are clearly sharpening their claws in Toronto and Vancouver. (*Ottawa are combined residential; Montreal are median not average).

Click the play button below to hear Andrew Ruhland’s “3 Key Investment Themes” from his presentation at the 2013 World Outlook Financial Conference.
Click here to find out more about Andrew Ruhland and the team at Integrated Wealth Management

In our previous essay we stepped back from the day-to-day price analysis in order to focus on the major event that happened recently on the silver market (the silver – JP Morgan manipulation lawsuit was dismissed) and today we would like to get back to the recent price moves, however, first, let’s discuss the current situation on the bond market.
A trend is a trend until it stops. Could this be the case for bonds? Is the bond bubble about to burst? And if so, what are the implications for precious metals?
Anyone following the financial press can see that analysts are rumbling that bond prices will fall when interest rates rise and that it will happen sooner than later. And we generally agree – you can’t lower interest rates below zero (who knows, maybe the Fed will surprise us calling that an unconventional but necessary move?) and since they are practically there, the ceiling is very close to the current bond valuations. The reason that bonds beat stocks over the past two decades is that interest rates have plunged making attractive the fixed income that bonds promise to pay. But the situation might as well change in the following years.
“Investors should be alert to the long-term inflationary thrust of such check writing” by the Fed, said Bill Gross, who runs the world’s largest bond fund, in his January investment outlook. “While they are not likely to breathe fire in 2013, the inflationary dragons lurk in the ‘out’ years towards which long-term bond yields are measured.”
Nearly 40% of the 32 investment strategists and money managers surveyed recently by CNNMoney think that interest rates will begin to rise in 2013, and another 30% say the shift will begin in 2014.
That would be even sooner than the Federal Reserve’s projections. The central bank doesn’t expect to raise the federal funds rate, the key interest rate that influences overall interest rates, until some time in 2015. The Fed said that it will keep its stimulus policies in place until the unemployment rate falls to 6.5%, which it doesn’t think will happen before then. But whether that takes place this year or next, or in 2015, one doesn’t want to be stuck with major investments in bonds when it happens.
Waves come and go. The current bull market in bonds must end at some time in the future, sooner or later, not until inflation or interest rates rise. So far, the economy remains sluggish, real unemployment is high and inflation is minimal. But, sooner or later, investors will experience either a loss of money, or at best meager returns. If inflation eats away the value of bonds, those who hold gold in their portfolios may be able to compensate.
Let’s see how gold is performing this week. Let’s begin with the analysis of the US Dollar Index as it will likely have a major impact on the price of yellow metal in the coming months. We will start with the long-term chart (charts courtesy by http://stockcharts.com.)
No significant changes are seen this week and the long-term trend for the USD Index remains down. Thursday’s rally did not take the index level above the long-term resistance line, so the outlook here from the long-term perspective remains bearish.
In the medium-tern USD Index chart, virtually nothing changed this week, although a move to the upside was seen on Wednesday-Thursday’s. The head-and-shoulders pattern is still not completed. A breakdown here below the neck level of the above-mentioned pattern – is quite probable and will likely lead to much bigger moves to the downside. These subsequent declines could stretch out for a period of weeks or even months.
In the short-term USD Index chart, a rally above the medium-term declining resistance line based on the July-August and late-November highs last year was seen this week. As the beginning of the dashed line is at the Nov 2012 top (the one that created the medium-term support line) and the Jan 2013 high (the one that formed after prices tried breaking above the declining resistance line), it might be the case that this line represents the “how far too far can the index move and still go back down”. It’s simply our guesstimate based on two facts: each of the previous breakouts failed and the rally stopped right at the dashed line, thus confirming at least some significance thereof.
We still believe the next move seen here will be to the downside. With a cyclical turning point a bit more than a week away, sideways trading in the coming days will likely be quickly followed by a period of declines which could then trigger a rally in the precious metals sector.
At this point, let’s have a look what’s currently going on in the gold market.
In the long-term gold chart the situation remains bullish. Gold prices consolidated after breaking out and the yellow metal is technically ready for a big rally. Comments made in our essay on the price of gold in February 2013 remain up-to-date:
The bottom was very likely formed here a few weeks ago when gold prices dipped below the 300-day moving average, which is a very important long-term technical development. Prices now appear to be simply consolidating a bit, which is also in tune with the historical patterns – the rally didn’t always start in a volatile way after the final bottom was reached below the 300-day MA – but it happened eventually many times and on each occasion the rally was worth waiting for.
On a short-term note, it is encouraging that gold did not decline much even though the dollar rallied quite sharply on Thursday.
Finally, we would like to share an observation that one of our subscribers shared with us along with our comments:
Q: I note in 2006-07 it took 76 weeks to make a new high for gold and in 2008 it took 78 weeks to make a new high in gold. We are now at week 74 in the gold cycle. Do you feel this is significant? I feel when it does move it will be to almost 1900 before a short- or medium-term correction. “When time is up, price will reverse. Time is more important than price.”–W. D. Gann (famous technical analyst.)
A: Yes, we feel this is significant and we expect to see a more volatile upswing in the coming weeks. We would like to add that the time factor may make this consolidation significant. Less than 40 years ago the correction took gold much lower – about half of the previous high – before the final rally in gold materialized. At this time we think that the prolonged consolidation might have been enough and gold doesn’t have to move even lower – the lack of a rally might have been enough to make people throw in the towel.
Summing up, the situation in gold did not change much this week in terms of price and it remains bullish for the medium- and long term.
To make sure that you are notified once the new features are implemented, and get immediate access to our free thoughts on the market, including information not available publicly, we urge you to sign up for our free gold & silver mailing list. Sign up today and you’ll also get free, 7-day access to the Premium Sections on our website, including valuable tools and charts dedicated to serious Precious Metals Investors and Traders along with our 14 best gold investment practices. It’s free and you may unsubscribe at any time.
Thank you for reading. Have a great and profitable week!
Przemyslaw Radomski, CFA
Founder, Editor-in-chief
About Sunshine Profits
Sunshine Profits enables anyone to forecast market changes with a level of accuracy that was once only available to closed-door institutions. It provides free trial access to its best investment tools
Before there were refrigerators folks kept drinks cool by putting them into clay jars that had been soaked in water. The evaporation of the water from the clay cooled the container and its contents, which today includes wine bottles. On the other hand, for many years artisans have taken clay in a slightly different form, shaped it and baked it and provided the teacups which keep the liquid inside until we drink it.
Two different forms of the same basic geological material, with two different behaviors and uses. Why bring this up? Well there is a growing series of articles which continue to laud the volumes of oil and natural gas that the world can expect from the artificial fracturing of the layers of shale in which these hydrocarbons have been trapped for the past few million years. It has been suggested that there is no difference between this “unconventional” oil and the “conventional” oil that has been produced over the past century to power the global economy. And yet, despite the scientific detail which some of these critics discuss other issues, they seem unable to grasp the relatively simple geologic and temporal facts that make the reserves in such locations as the Marcellus Shale of Pennsylvania and the Bakken of North Dakota both unconventional and temporally transient. Let me therefore try again to explain why, despite the fact that the oil itself may be relatively similar, the recovery and economics of that oil are quite different from those involved in extracting conventional deposits.
But, before getting to that, let’s first look at the current situation in North Dakota, using the information from the Department of Mineral Resources (DMR). According to theJanuary Director’s Cut the rig count in the state has varied from 188 in October, through 186 in November, and 184 in December, to 181 at the time of the report. Why is this number important? Well, as I will explain in more detail later, the decline rate of an individual well in the region is very high, and thus the industry has to continue to drill wells at a rapid rate, just to replace the decline. (This is the “Red Queen” scenario that Rune Likvern has explained so well.) The DMR recognize this by showing the effect of several different scenarios as the number of rigs changes.
For example they project that 170 rigs will be able to drill around 2,000 wells a year. At that level, and with some assumptions about the productivity of individual wells that I am not going to address here, but which Rune discussed. I would, however, suggest that it is irrational to expect that new wells will continue to sustain existing first year levels as the wells move away from formation sweet spots. Yet, accepting their assumptions for now, DMR project that the 170 rigs will generate the following production from the state:

……read more HERE


-
I know Mike is a very solid investor and respect his opinions very much. So if he says pay attention to this or that - I will.
~ Dale G.
-
I've started managing my own investments so view Michael's site as a one-stop shop from which to get information and perspectives.
~ Dave E.
-
Michael offers easy reading, honest, common sense information that anyone can use in a practical manner.
~ der_al.
-
A sane voice in a scrambled investment world.
~ Ed R.
Inside Edge Pro Contributors

Greg Weldon

Josef Schachter

Tyler Bollhorn

Ryan Irvine

Paul Beattie

Martin Straith

Patrick Ceresna

Mark Leibovit

James Thorne

Victor Adair