
Gold & Precious Metals
In the last update we called a bottom in silver the day after it put in a high-volume bull hammer early in January, and while it did reverse as expected, the short-term uptrend that developed has since stalled out in recent weeks and it now looks like it is about to reverse to the downside again. (Ed Note: There is a Great Gold Update with 9 Charts HERE, and/or use the link at end of this article to view)
On silver’s 6-month chart we can see how the price has advanced out of the intermediate base area that formed late in December and early in January, and also how the advance has fizzled out so that another top area appears to have developed, and with the price on the uptrend line it looks like it will break below it soon, or immediately, and in so doing reverse to the downside again. The advance out of the base was anemic and the price has fallen way short of making it to the upper boundary of the larger downtrend channel, which is an ominous sign. There is still an outside chance that it could now do so – although the latest COTs offer no comfort for bulls here.

If the price does now break down from the minor uptrend its first stop will be the support near the late December – early January lows, and if it breaks below this support it next port of call will be support in the $28 – $28.50 area.
We can see the long-term uptrend in silver on its 7-year chart. On this chart we can also see that there is very strong support at the multiple lows of the past 18 months, at and just above $26, which also happens to be very close to the support of its long-term uptrend line. A dip into this zone will be the point at which to buy silver (in the approx. $26 – $27.50 area circled in green) for the next major upleg, and the proximity of a very clearly defined strong support level affords a very favorable risk/reward ratio, as a protective stop can be set just below it.

If silver does go on to break down below the strong support level at $26, it will be very bad news indeed, as such a development could be expected to trigger a brutal plunge, and there is a scenario in which this could occur as set out in more detail in the parallel Gold Market update.
The Fed must be desperate to support the beleaguered dollar and Treasury market, and it can be presumed that they will stop at nothing to do so. A highly effective way to achieve this objective would be to create a deflationary scare and an exodus out of commodities and stocks, with the hot money panicking into the dollar and Treasuries again, which tactic has the added advantage that they can later claim that only another massive infusion of QE will save the economy from ending up on the rocks again, although the reality is that it never got off them. Various COT charts show that the Commercials will be prime beneficiaries of such a scenario, should it unfold, which of course makes it that much more likely, since they are seldom losers.
The latest silver COT chart should strike fear into the hearts of silver longs, although it usually doesn’t because they either don’t understand it or ignore it, preferring instead to march to the drumbeat of their favorite cheerleaders, one of whom recently described silver as “being on the precipice of a massive (upside) breakout”, a choice of words that could come back to haunt him.

End of report. (Ed Note: Great Gold Update with 9 Charts HERE)

Weekly Commentary
Stockscores Market Minutes Video
Good trades start with good foundations. That is the topic of this week’s Market Minutes video, along with my regular market analysis. Watch it by clicking here. To receive email alerts any time I upload a new video, subscribe to the Stockscores channel atwww.youtube.com/stockscoresdotcom.
Order the Mindless Investor book now
“The Mindless Investor” is not yet in stores but you can now order advanced copies of it. To do so, first log in to Stockscores.com and then cut and paste this link in to the address bar of your browser. Doing so will add the charge ($29.95 + $6.50 shipping) to your shopping cart so you can complete the transaction.
http://www.stockscores.com/cart.asp?caction=add&prodid=2254
This week’s Trading Lesson
My formula for finding winning stocks is pretty simple. Look for stocks making abnormal price breaks, preferably with abnormal volume, from low price volatility, optimism and through resistance. You can do this when you are day (< 1 day hold), swing (1 day to 2 week hold), position (2 week to 6 month hold) or long term trading (6 month + hold). The only difference is what chart time frame you apply the concept to.
If you want to make a swing trade, look for these abnormal breaks from good chart patterns on 15 minute charts. A long term trader will look for this chart pattern on a weekly or daily chart.
The key is that you have to find these stocks early in their runs because the longer you wait, the farther they get from their price base, leaving you with more risk and less reward potential. Catch them early and you can enjoy most of the price move. I discuss this in more detail in this week’s Market Minutes video, which you can watch by clicking here.
How do you find the stocks making abnormal price moves from good chart patterns? The answer depends on the type of trading you are doing. The shorter the anticipated hold period, the more important it is to find them early. A day trader needs a sophisticated real time analysis program like Tradestation to catch them just as the moves are staring up.
Tradestation is helpful for swing trading too but less important. As you move toward position trading and long term trading, real time analysis becomes much less important. Day trading is not what most people want to do so utilizing the Market Scan tool on Stockscores.com is more than sufficient.
Here is a really simple thing to do with the Market Scan to find the stocks that are moving. We want stocks that are liquid enough to move in and out of, are moving up stronger than we would normally expect and are making a break through resistance.
Early in the trading day, say the first 3 hours, I scan using the following settings:
- Gain/Loss >= 2%
- 5 Day Resistance = Breakout
- Number of Trades > 250 (for all Canadian Exchanges) or 1000 (for American Exchanges)
Closer to the end of the trading day, or in the evenings, I modify the scan as follows:
- Abnormal Activity = Abnormal Day Up
- 5 Day Resistance = Breakout
- Number of Trades > 250 (for all Canadian Exchanges) or 1000 (for American Exchanges)
When you look at the charts for the stocks that this scan finds, ask yourself this question first.
“Is the stock just starting to move or has it been moving up for a while?”
I want to find stocks that are just moving from periods of sideways trading because that makes it easier to manage risk and increases the reward potential. The longer you wait, the less upside and the more downside.
I also want to see that the stock is breaking from a rising bottom on the chart as this is a sign that investors are optimistic. The breakout is more important if supported by abnormal volume as well.
It is very important to be patient for good trades. You can find trades that look “pretty good” daily but it is the great looking trades that make you your profits. You will actually make more by trading less provided you are trading less because you are fussy.
Strategy of the Week
I ran the Market Scan described above, doing it separately for the Canadian and US markets. For Canada, using the 250 trades as the liquidity threshold, the filter found 6 stocks. For the US, with 1000 trades, it found 34 stocks.
I then inspected these 40 charts to look for good patterns and found that none of the Canadian charts passed my tests while one US listed stock has a good chart pattern, see below:
Stocks That Meet That Featured Strategy
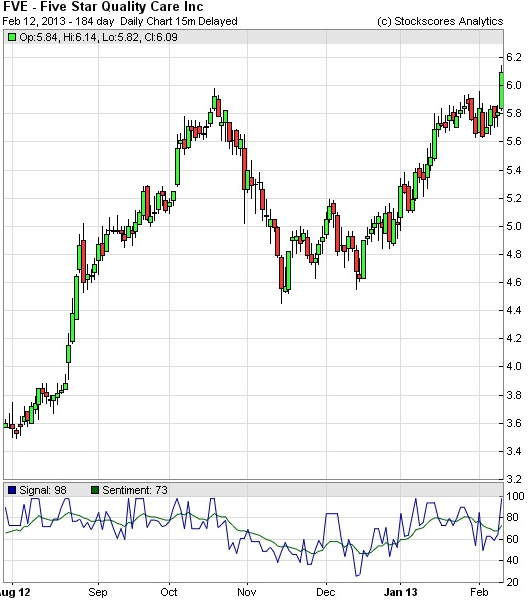
1. FVE
FVE is breaking from a cup and handle pattern today with abnormal volume supporting the breakout. While the stock has been moving higher since last Fall, it has stalled under resistance at $6 since October 2012. Today the stock made the break through that ceiling, a sign that it has a good chance of moving higher in the coming weeks. Support at $5.70.
- References
- Get the Stockscore on any of over 20,000 North American stocks.
- Background on the theories used by Stockscores.
- Strategies that can help you find new opportunities.
- Scan the market using extensive filter criteria.
- Build a portfolio of stocks and view a slide show of their charts.
See which sectors are leading the market, and their components.
Disclaimer
This is not an investment advisory, and should not be used to make investment decisions. Information in Stockscores Perspectives is often opinionated and should be considered for information purposes only. No stock exchange anywhere has approved or disapproved of the information contained herein. There is no express or implied solicitation to buy or sell securities. The writers and editors of Perspectives may have positions in the stocks discussed above and may trade in the stocks mentioned. Don’t consider buying or selling any stock without conducting your own due diligence.
Which one is right?
On Friday China reported its trade numbers. They were good. And they seemed to do nothing but instill confidence in China’s economy recovery.
So you would expect a certain reaction from assets most closely ties to China’s economy. I immediately think copper.
Indeed, copper imports into China did grow notably in January.
If we consider Friday’s copper price action only, right after the news was released, the response was good. But the rally was more than erased yesterday. I didn’t see any new catalyst that would have driven copper lower, so I can only think it should fall into the category “adverse price action relative to the news.”

The uptrend in copper is intact for now, but the momentum is waning a bit and in the long- term one could make the case for a deep decline should this adverse price action continue and its uptrend channel be violated. The weekly consolidation is currently bullish, but just barely – a breakdown could happen quickly if this five-wave consolidation pattern resolves itself to the downside as it suggests:

It’s also worth noting that China’s imports of crude oil were strong. Unlike copper, crude oil did well yesterday:

And I imagine that move really hit a lot of new crude oil bears hard. But should this be reassuring for the crude oil bulls out there?
Among the growing population expecting the recent US stock market strength to hit a temporary stopping point, crude oil is also expected to take a breather. I’ll agree. But crude isn’t going to break when so many are expecting it to; it’ll shake out a whole lot of bears before it turns lower.
But I do think that turn is coming soon, both for crude oil and stocks. In my Commodities Essential newsletter last week I talked about why. Here is a short summary with updated charts …
A look at the NYSE Bullish Percent Index suggests stocks are overbought and near a substantial turning point. The index peaked out at or above 70 twice last year. Those peaks coincided with substantial corrections:

And there’s another item I find useful, particularly to help identify turning points: the CFTC’s weekly Commitment of Traders (COT) report.
The COT report shows the open interest and the net long/short positioning broken down by three investor categories – small speculators, large speculators, and commercials – in a particular futures contract.
I look specifically for relative extremes in positioning among the small and large speculators. When speculative positioning reaches extremes, the speculators tend to be wrong about the future direction of prices. Thus, these extremes suggest greater potential for a turnaround … for a playable correction.
Here is a chart showing the weekly COT data for the S&P 500 futures going back one year:

This chart suggests speculative positioning has reached an extreme that will induce a steep, playable correction at least.
Of course, timing is critical as these are weekly figures that can persist even after reaching lopsided levels. The latest data shows large speculators already beginning to dump long positions. Will this create a feedback loop of selling? Or will this rally reach higher before a real correction materializes?
Either way, I think we are very close to a substantial pullback in risk appetite.
I think crude oil will be the commodity most tied to a risk asset sell-off. Copper may be dragged down as well, but I don’t expect copper to perform as poorly as crude oil unless some key support levels are first taken out. In fact, the Commitment of Traders data on crude oil suggests a turning point is not far (just as the S&P 500 COT data does):

It seems there are two ways a trader/investor could be leaning right now:
Way #1: Risk On. There will be a continued melt-up in risk assets on the premise of continued money printing and recovery in key global economies
Way #2: Risk Off. At least a substantial correction is due, but poor price action could quickly morph into something uglier than a correction as the merit of money printing, unmanageable debt and economic recovery are undermined by renewed deflation expectations.
I suppose there is some middle ground. But I think there are too many leaning towards way #1. As such, I am beginning to lean towards way #2.
There may be a few more weeks of upside. We may need to see a real blow-off in risk appetite before any correction materializes.
But the higher we go from here, the harder we fall. (At least that’s what they say!) I say watch crude.
- JR Crooks
- Black Swan Capital
- www.blackswantrading.com

 With the announcement this week of its massive $5 billion lawsuit against ratings agency Standard & Poor’s, the Federal Government took a bold step to squelch any remaining independence of thought or action in the financial services industry. Given the circumstances and timing of the suit, can there be little doubt that S&P is paying the price for the August 2011 removal of its AAA rating on U.S. Treasury debt? In retaliation for the unpardonable sin of questioning the U.S. Treasury’s credit worthiness, the Obama Administration is sending a loud and clear message to Wall Street: mess with the bull and get the horns. Shockingly, the blatant selectivity of the prosecution, however, has failed to ignite a backlash. But as the move violates both the spirit of the Constitution and the letter of the law in so many ways, I can’t help but look at it as a sea change in the nature of our governance. Call it Lincoln with a heavy dose of Putin.
Given the nature of the U.S. economy during the housing mania of the last decade, charging S&P with fraud is like handing out a speeding ticket at the Indy 500. Like nearly every other mainstream financial firm in the world at the time, S&P believed that the U.S. economy rested on a solid foundation of accumulated housing wealth. By 2006, the housing market was closing out one of its best decades in memory. Developers, speculators, financiers, real estate agents, bankers and even ordinary Americans had become charmed by the easy wealth of serial home purchases. The party had been orchestrated by a cadre of politicians and regulators who wanted to keep the party going and take credit for the good times.
To a degree that few Americans understand even to this day, it was not irresponsible lending, bad ratings, or excess greed that finally doomed the mortgage market, it was the simple fact that national home prices started falling. As long as prices stayed high, refinancing would have been open to borrowers, and defaults would have been manageable. Among the hordes of analysts, academics, and reporters who covered the market there were few if any standing who believed that national home prices could fall of a cliff. I know this to be true because I spent many years trying, unsuccessfully, to warn them.
From 2005 to 2008, I made scores of appearances on national television and at investment conferences around the country in which I stated that national home prices were set to decline by at least 30% and that the resulting mortgage defaults would devastate the financial sector and bring down the economy. I may have just as well been arguing that pink unicorns were about to resurrect the Soviet Union. At the 2006 Western Regional Mortgage Bankers conference I told attendees that many highly rated mortgage-backed securities, including some rated AAA, would become worthless. My debate opponent claimed that such predictions only come to pass if “an atomic bomb landed on either Los Angeles, Chicago, or New York!”
The idea that home prices could decline at all, let alone by 30% was considered beyond serious consideration. The models used by the banks, investors, government agencies, academics, and rating agencies predicted that national home prices would continue to rise, or at least stay stable. They were ALL wrong. Calls for even a 5% decline would have put S&P in the extreme minority. I know because I WAS that extreme minority and would have noticed any company joining me. Absent such opinions, the analyses put out by S&P, Moody’s, and Fitch were justifiable. So why pick on S&P? Perhaps because the other two agencies never downgraded U.S. government debt.
As proof of S&P’s institutional culpability, the Justice Department provided a few e-mails sent by S&P analysts during the final stages of the housing bubble. The messages contain cynical awareness that the mortgage market was built on a house of cards. So what? To avoid guilt would S&P have to prove 100% agreement among all employees? The company readily admits that it reached its opinions through a consensus and that feelings within the firm varied. Opinions are, by definition, nuanced and varied. During the years before the crash I received emails from many people who agreed with me but who said that their friends and co-workers believed that they “were nuts” for harboring such fears. I lost count of how many people told me that I was nuts. Many of these e-mails could have come from S&P analysts.
At most, S&P was guilty of a culture of complacency and group think. Ironically that spirit was engendered by the bizarre regulatory environment created for ratings agencies by the government itself. In 1973, in order to “protect” investors from unregulated markets, the SEC designated certain ratings firms as “Nationally Recognized Statistical Ratings Organizations.” Thereafter, only bonds rated by sanctioned firms could be purchased by pension funds and federally insured banks. Before that time the ratings agencies were paid for their advice by bond investors. As the rule change limited the abilities of investors to choose who to ask, the ratings firms began charging bond issuers instead. This arrangement meant that interests of investors would be subordinated. In any event, the law may have mandated who could perform ratings, but it did not require anyone to take them seriously. Any decent portfolio manager recognized this conflict of interest and performed their own due diligence.
The problem was when it came to housing mortgage bond buyers who were just as clueless as the ratings agencies. In fact, even those few buyers who knew the party would end badly, decided for themselves to keep dancing until the music stopped. It’s completely hypocritical to sue the band after-the fact. Given that the SEC required investors to use these ratings agencies, should not the Justice Department be suing them instead?
The 2011 downgrade came as the government passed a weak and inconclusive patch to the debt ceiling crisis. Now, a year and a half later, we see that they have slithered out of that poorly constructed straight jacket. With the new debt piling up faster than ever, and the government showing itself to be blatantly incapable of making hard choices, it should be clear to anyone with a half semester of accounting that the Treasury debt should be downgraded. Yes the government has a printing press, but that only means that the value of the bonds will disappear through inflation rather than default. S&P was far too lenient.
Smaller ratings agency Egan Jones (which never had the official sanction of S&P) issued harsher reports about government debt, and they have also been duly punished for their candor. In 2011 the other major ratings agency, Moody’s, argued that the fiscal cliff deal agreed to by Congress and the President improved the country’s fiscal position and forestalled any need to downgrade Treasury debt. However, since we never actually went over that conveniently erected fiscal cliff, why has Moody’s not responded with a downgrade? Perhaps they want to stay out of court?
Let’s hope that it is still possible to get a fair hearing in a U.S. court of law, even when squaring off against the biggest and most powerful opponent the world has ever known. But even if S&P wins, we have all already lost. If it survives it will only do so after incurring huge legal bills and seeing its share price slashed. It’s a foregone conclusion that no more downgrades will be coming.

 Short-Term Market Outlook
Back on November 19th we wrote a piece in our “Portfolio Manager’s Journal” that we felt the market was putting in an important low. Several technical indicators we were following at the time suggested that the post U.S. election sell-off had run it’s course. In particular, the NYSE Summation Index was at levels associated with previous market bottoms so the odds were stacking in favor of a significant rally. In hindsight our call was correct with the market trading higher and recording new recovery highs on Friday February 1st.
The rally has lasted more than two months, gaining almost 13% as measured by the performance of the S&P 500 Index. Now that the rally has unfolded as we anticipated we want to provide an update on the near-term outlook.
This week we are at an important juncture in terms of time and price with the odds now in favor of a short-term market top at current levels. We employ several different techniques in our market analysis, providing us with some interesting observations.
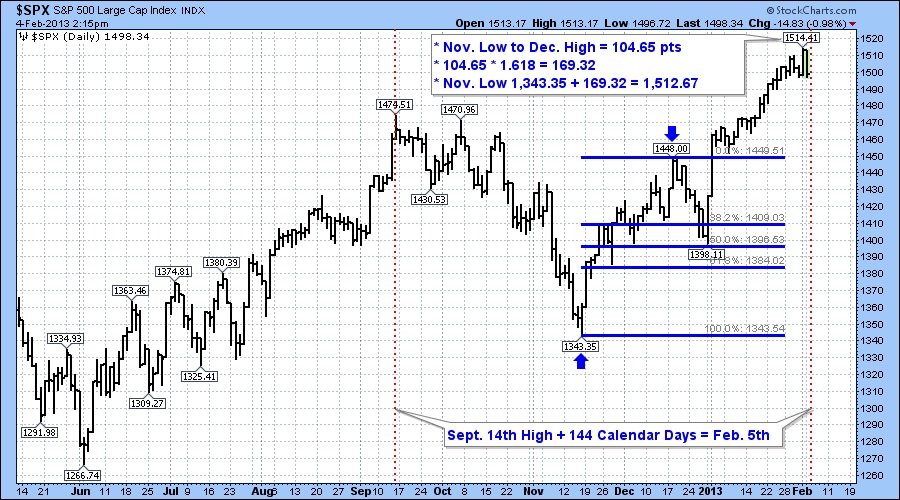
We like to use the Fibonacci number sequence to help us identify support and resistance price levels as well as projecting future time zones where we would be on the lookout for potential trend reversals. If we use the September 14th high and project out 144 calendar days the date for a potential turning point is Tuesday February 5th as indicated by the red dotted vertical dotted line on the chart.
The method for projecting the price target level involves taking the range between the November low and the December high. The range was 104.65 points. Next we multiply this value by the Fibonacci ratio of 1.618 which gives us a value of 169.32. If we then add this value to the November low of 1,343.35 we arrive at a price target of 1,512.67.
On Friday the market recorded an intraday high of 1,514.41 which is less than 2 points above out target!
Therefore with time and price at an important juncture we feel that the current rally is likely over for now and that we should expect a market correction to begin. Some other factors that support a price high is seasonality and sentiment. In post-election years the U.S. market tends to peak in the first week of February and decline into late March. In the past couple of weeks the bullish sentiment numbers indicate above average optimism and the bearish sentiment is also relatively low. From a contrarian perspective we interpret these numbers as another sign of a top.
Our current strategy is to hold off on any more buying until the market declines to an oversold level. We will be reviewing all our individual stock positions to identify stop loss levels in the event that the decline begins to accelerate on the downside.
The next six weeks should be choppy and volatile as those that came late to this rally become nervous and think twice about their recent purchases. We will provide another update when we feel that it’s safe to go back in the water!

-
I know Mike is a very solid investor and respect his opinions very much. So if he says pay attention to this or that - I will.
~ Dale G.
-
I've started managing my own investments so view Michael's site as a one-stop shop from which to get information and perspectives.
~ Dave E.
-
Michael offers easy reading, honest, common sense information that anyone can use in a practical manner.
~ der_al.
-
A sane voice in a scrambled investment world.
~ Ed R.
Inside Edge Pro Contributors

Greg Weldon

Josef Schachter

Tyler Bollhorn

Ryan Irvine

Paul Beattie

Martin Straith

Patrick Ceresna

Mark Leibovit

James Thorne

Victor Adair