

Weekly Commentary
Stockscores Market Minutes Video
Good trades start with good foundations. That is the topic of this week’s Market Minutes video, along with my regular market analysis. Watch it by clicking here. To receive email alerts any time I upload a new video, subscribe to the Stockscores channel atwww.youtube.com/stockscoresdotcom.
Order the Mindless Investor book now
“The Mindless Investor” is not yet in stores but you can now order advanced copies of it. To do so, first log in to Stockscores.com and then cut and paste this link in to the address bar of your browser. Doing so will add the charge ($29.95 + $6.50 shipping) to your shopping cart so you can complete the transaction.
http://www.stockscores.com/cart.asp?caction=add&prodid=2254
This week’s Trading Lesson
My formula for finding winning stocks is pretty simple. Look for stocks making abnormal price breaks, preferably with abnormal volume, from low price volatility, optimism and through resistance. You can do this when you are day (< 1 day hold), swing (1 day to 2 week hold), position (2 week to 6 month hold) or long term trading (6 month + hold). The only difference is what chart time frame you apply the concept to.
If you want to make a swing trade, look for these abnormal breaks from good chart patterns on 15 minute charts. A long term trader will look for this chart pattern on a weekly or daily chart.
The key is that you have to find these stocks early in their runs because the longer you wait, the farther they get from their price base, leaving you with more risk and less reward potential. Catch them early and you can enjoy most of the price move. I discuss this in more detail in this week’s Market Minutes video, which you can watch by clicking here.
How do you find the stocks making abnormal price moves from good chart patterns? The answer depends on the type of trading you are doing. The shorter the anticipated hold period, the more important it is to find them early. A day trader needs a sophisticated real time analysis program like Tradestation to catch them just as the moves are staring up.
Tradestation is helpful for swing trading too but less important. As you move toward position trading and long term trading, real time analysis becomes much less important. Day trading is not what most people want to do so utilizing the Market Scan tool on Stockscores.com is more than sufficient.
Here is a really simple thing to do with the Market Scan to find the stocks that are moving. We want stocks that are liquid enough to move in and out of, are moving up stronger than we would normally expect and are making a break through resistance.
Early in the trading day, say the first 3 hours, I scan using the following settings:
- Gain/Loss >= 2%
- 5 Day Resistance = Breakout
- Number of Trades > 250 (for all Canadian Exchanges) or 1000 (for American Exchanges)
Closer to the end of the trading day, or in the evenings, I modify the scan as follows:
- Abnormal Activity = Abnormal Day Up
- 5 Day Resistance = Breakout
- Number of Trades > 250 (for all Canadian Exchanges) or 1000 (for American Exchanges)
When you look at the charts for the stocks that this scan finds, ask yourself this question first.
“Is the stock just starting to move or has it been moving up for a while?”
I want to find stocks that are just moving from periods of sideways trading because that makes it easier to manage risk and increases the reward potential. The longer you wait, the less upside and the more downside.
I also want to see that the stock is breaking from a rising bottom on the chart as this is a sign that investors are optimistic. The breakout is more important if supported by abnormal volume as well.
It is very important to be patient for good trades. You can find trades that look “pretty good” daily but it is the great looking trades that make you your profits. You will actually make more by trading less provided you are trading less because you are fussy.
Strategy of the Week
I ran the Market Scan described above, doing it separately for the Canadian and US markets. For Canada, using the 250 trades as the liquidity threshold, the filter found 6 stocks. For the US, with 1000 trades, it found 34 stocks.
I then inspected these 40 charts to look for good patterns and found that none of the Canadian charts passed my tests while one US listed stock has a good chart pattern, see below:
Stocks That Meet That Featured Strategy
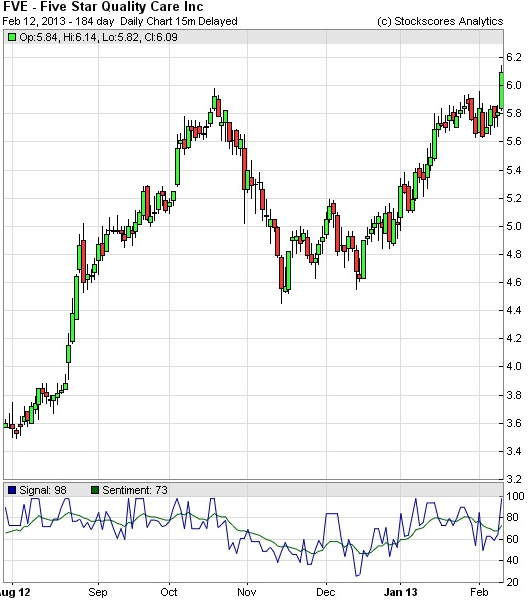
1. FVE
FVE is breaking from a cup and handle pattern today with abnormal volume supporting the breakout. While the stock has been moving higher since last Fall, it has stalled under resistance at $6 since October 2012. Today the stock made the break through that ceiling, a sign that it has a good chance of moving higher in the coming weeks. Support at $5.70.
- References
- Get the Stockscore on any of over 20,000 North American stocks.
- Background on the theories used by Stockscores.
- Strategies that can help you find new opportunities.
- Scan the market using extensive filter criteria.
- Build a portfolio of stocks and view a slide show of their charts.
See which sectors are leading the market, and their components.
Disclaimer
This is not an investment advisory, and should not be used to make investment decisions. Information in Stockscores Perspectives is often opinionated and should be considered for information purposes only. No stock exchange anywhere has approved or disapproved of the information contained herein. There is no express or implied solicitation to buy or sell securities. The writers and editors of Perspectives may have positions in the stocks discussed above and may trade in the stocks mentioned. Don’t consider buying or selling any stock without conducting your own due diligence.


