
Currency
 With the end of Asia’s lunar new year celebration and the return of the US and Canadian markets after yesterday’s holiday, there is full liquidity in the global capital markets for the first time in over a week. The currencies are mixed, with the yen, sterling and the Australian dollar posting modest gains, while the euro, Swiss franc and Canadian dollar have heavier tones.
The Chinese yuan has weakened for the second day after returning from the extended holiday and is near 2-month lows. After reversing lower yesterday, the Shanghai Composite led the regional bourses lower with a 1.9% decline. The Composite is approaching its 20-day moving average (~2365) which it has not traded below since early December. European equity markets are higher and the Dow Jones Stoxx 600 is up a little more than 0.5% led by consumer goods and basic materials. Of the main industrial sectors, only telecom is lower. European bond markets, core as well as periphery are lower.
Broadly speaking, we identify five factors that will shape foreign exchange rates in coming days.
…..read the 5 HERE

Executive summary
Annual gold demand measured on a value basis increased to an all-time record of US$236.4bn in 2012. On a tonnage basis, demand totalled 4,405.5 tonnes (t) in 2012, down by 4% from 2011 as an increase in demand from institutional investors and central banks only partly offset a year-on-year decline in consumer demand. Major themes from 2012 are discussed below, including a dichotomous year in India, central bank purchases reaching a 48-year high and China’s persistent devotion to gold.
….25 pages of Charts & Trends from the World Gold Council HERE (Download (PDF 1.0 MB))
….commentary, charts & Highlights at GoldSilverWorlds HERE
28 Charts Every Gold Investor Must See
US Funds Frank Holmes, an expert on commodities, recently presented a monster slide deck that made the ultimate bull case for gold.
We pulled the 28 very best charts from the 77-slide presentation.


A shallow correction between now and the end of March will provide an opportunity to accumulate sectors on weakness that have a history of outperformance into spring. Sectors include energy, metals and mining, copper, platinum, retail, steel and auto & auto parts.

Selected equity markets around the world (e.g. most western European markets, Canada, Mexico) showed short term technical signs of weakness last week. U.S. equity markets for the most part have held in a relative tight trading range during the past two weeks and remain short term overbought.
U.S. equity markets have a history of reaching a short term peak at the end of the first week in February in the year following a U.S. Presidential election. Thereafter, they enter into a shallow correction lasting until the end of March. Thereafter, U.S. equity markets move higher. History is repeating this year.
Equity Trends
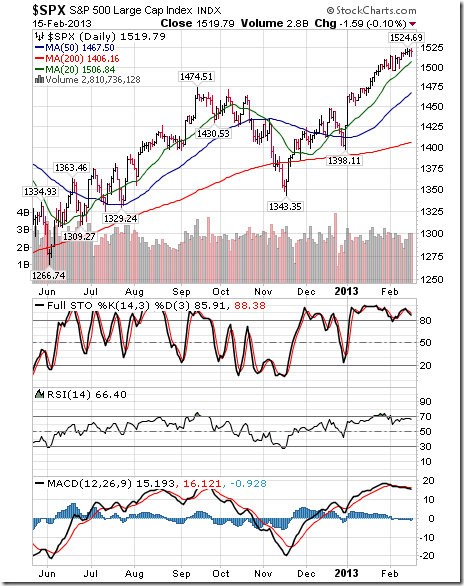
The S&P 500 Index added 2.86 points (0.01%) last week. Intermediate trend is up. The Index remains above its 20, 50 and 200 day moving averages. Short term momentum indicators remain overbought.
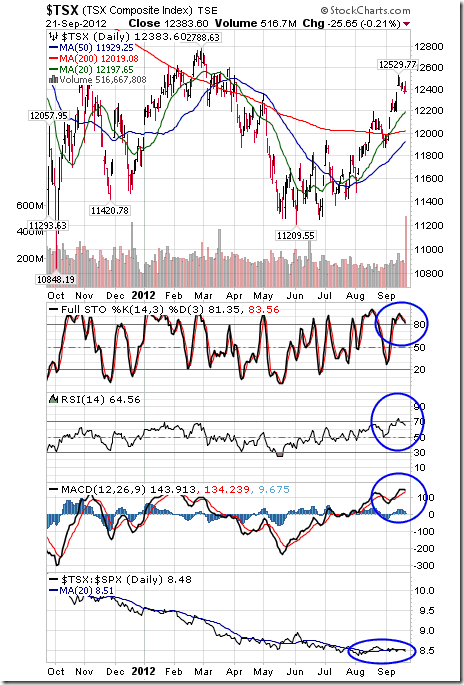
The TSX Composite Index fell 114.60 points (0.90%) last week. Intermediate trend changed from up to down on Friday on a break below 12,668.81. The Index remains above its 50 and 200 day moving averages, but fell below its 20 day moving average. Short term momentum indicators are trending down. Strength relative to the S&P 500 Index remains negative.
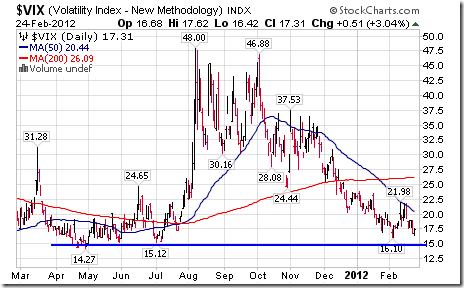
The VIX Index fell 0.56 (4.30%) last week to a six year low.
Precious Metals
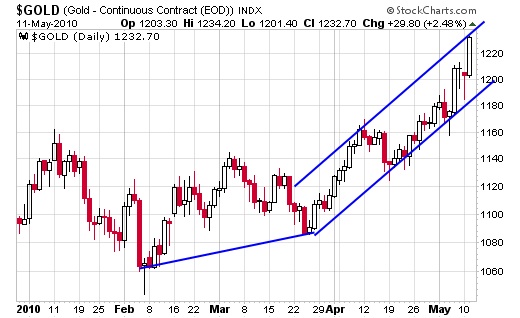
Gold fell $57.40 per ounce (3.44%) last week. Intermediate trend changed from neutral to down on a break below support at $1,626.00. Gold remains below its 200 and 50 day moving averages and fell below its 20 day moving average. Strength relative to the S&P 500 Index remains negative. Short term momentum indicators are oversold.

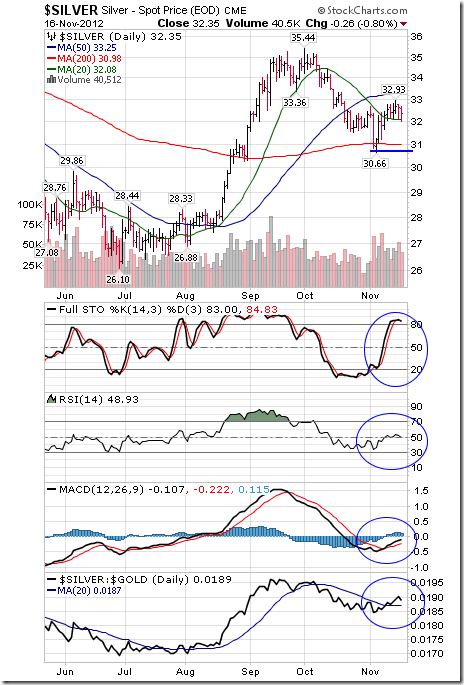
Silver fell $1.59 per ounce (5.06%) last week. Intermediate trend changed from up to down on a break below support at $30.75. Silver remains below its 20 and 50 day moving averages and moved below its 200 day moving average. Strength relative to Gold changed from positive to neutral. Short term momentum indicators are trending down.
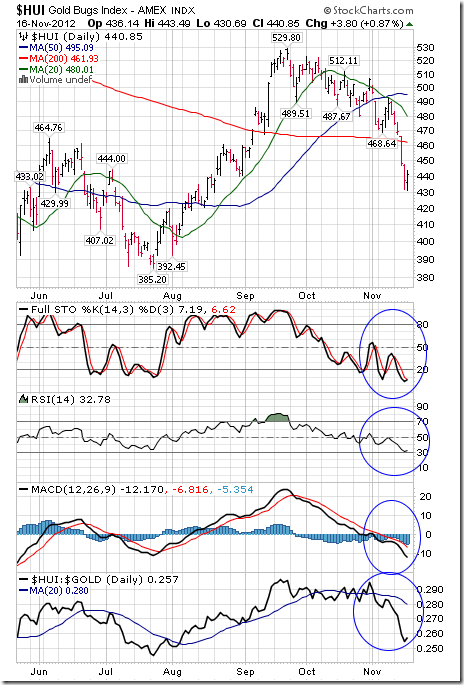
The AMEX Gold Bug Index dropped another 23.99 points (5.95%) last week. Intermediate downtrend was confirmed on a break below support at 385.20. The Index remains below its 20, 50 and 200 day moving averages. Strength relative to Gold remains negative. Short term momentum indicators are oversold.
The TSX Metals & Minerals Index fell another 12.15 points (1.25%) last week. Intermediate trend is down. The Index remains below its 20 and 50 day moving averages and above its 200 day moving average. Strength relative to the S&P 500 Index remains negative. Short term momentum indicators are oversold.
Commodities
Crude Oil added $0.14 per barrel (0.15%) last week. Intermediate trend is up. Support is at $94.97 and resistance is at $98.24. Crude remains above its 50 and 200 day moving averages and below its 20 day moving average. Strength relative to the S&P 500 Index remains neutral. Short term momentum indicators are trending down.
….read much more & view 37 more charts HERE

 Daily turmoil on a global scale is giving business leaders and investors plenty of reasons to stay hunkered down as they confront huge challenges in the here and now. Spreading sovereign debt woes, volatile markets, unstable currencies, political gridlock and stalled growth plague the big developed economies. Meanwhile, China, India and other rapidly emerging economies are flexing their strength as they adjust to the phenomenal growth that has been the biggest economic story of the past two decades.
In the conventional view, the current turbulence portends deep, enduring structural shifts that will set the business agenda for the foreseeable future. We fully expect macroeconomic shocks over the coming decade, with discontinuities that will shape the options companies have to adapt and grow.
Yet behind the dire headlines and day-to-day frictions of the marketplace, eight trillion-dollar macro trends are at work in the global economy. The pursuit by businesses and governments of the macro trends’ growth potential will touch many corners of the globe.
Europe, Japan and the US certainly face an extended period of economic turbulence and slow growth, particularly in the first half of the decade. But as we will see, half of the macro trends affect both emerging and advanced economies. Thus, while we embrace the exciting opportunities in emerging markets, we also see opportunities where many commentators see none right now—in the home markets of many of the world’s leading businesses.
….read it all HERE
As from its inception, the aim of Gold Silver Worlds has been to focus on the real facts. Readers should understand what caused the price takedown on Friday February 15th 2013 and should be able to distinguish the noise from the true facts that the mainstream press attributed to the lower gold and silver prices. In this article, we show the real value of the biggest recent headlines and urge readers to value them for what they are: mainstream headlines. We also show the real reasons for the price drop.
…..Are Soros and PIMCO truly bearish? ….read it all HERE


-
I know Mike is a very solid investor and respect his opinions very much. So if he says pay attention to this or that - I will.
~ Dale G.
-
I've started managing my own investments so view Michael's site as a one-stop shop from which to get information and perspectives.
~ Dave E.
-
Michael offers easy reading, honest, common sense information that anyone can use in a practical manner.
~ der_al.
-
A sane voice in a scrambled investment world.
~ Ed R.
Inside Edge Pro Contributors

Greg Weldon

Josef Schachter

Tyler Bollhorn

Ryan Irvine

Paul Beattie

Martin Straith

Patrick Ceresna

Mark Leibovit

James Thorne

Victor Adair