
Gold & Precious Metals
Gold and silver along with their related miners have been under a lot of selling pressure the last few months. Prices have fallen far enough to make most traders and investors start to panic and close out their long term positions which is a bullish signal in my opinion.
My trading tactic for both swing trading and day trading thrive on entering and exiting positions when panic trading hits an investment. General rule of thumb is to buy when others are extremely fearful and cannot hold on to a losing position any longer. When they are selling I am usually slowly accumulating a long position.
Looking at the charts below of gold and silver you can see the strong selling over the past two weeks. When you get drops this sharp investors tend to focus on their account statements watching the value drop at an accelerated rate to the point where they ignore the charts and just liquidate everything they have to preserve their capital.
Gold Bullion Weekly Chart:
The price and outlook of gold has not really changed much in the past year. It remains in a major bull market and has been taking a breather, nothing more. Stepping back and reviewing the weekly chart it’s clear that gold is nearing long term support. With panic selling hitting the gold market and long term support only $20 – $30 dollars away this investment starts to look really tasty.
But if price breaks below the $1540 level and closed down there on a weekly basis then all bets are off as this would trigger a wave of selling that would make the recent selling look insignificant. And the uptrend in gold would now be over.

Silver Bullion Weekly Chart:
Silver price is in the same boat as its big sister (Yellow Gold). Only difference is that silver has larger price swings of 2-3x more than gold. This is what attracts more traders and investors but unfortunately the masses do not know how to manage leveraged investments like this and end up losing their shirts.
A breakdown below the $26.11 price would likely trigger a sharp drop back down to the $17.50 level so be careful.

Gold Mining Stocks – Monthly Chart:
If you wanna see a scary chart then look at what could happen or is happening to gold miner stocks. This very could be happening as we speak and why I have been pounding the table for months no to get long gold, silver or miners until we see complete panic selling or a bullish basing pattern form on the charts. We have not seen either of these things take place although panic selling is slowly ramping up this week.
There will be some very frustrated gold bugs if they take another 33% hair cut in value.

Precious Metals Trend and Trading Conclusion:
In short, the precious metal sector remains in a cyclical bull market. That being said and looking at the daily charts the prices have been consolidating and are in a down trend currently. Until we see some type of bottoming pattern or price action form it is best to sit on the side lines and watch the emotional traders get caught up and do the wrong thing.
The next two weeks will be crucial for gold, silver and miner stocks. If metals cannot find support and close below the key support levels things could get really ugly fast. If you would like to receive my daily analysis and know what I am trading then check out my newsletter at: www.TheGoldAndOilGuy.com
Chris Vermeulen

When It Comes to Gold, Stick to the Facts
Gold just dipped below $1,600, falling to a six-month low, much to the chagrin of gold investors. I find the timing of the correction peculiar, given the G20 Finance Ministers Meeting taking place this past weekend. There’s been a growing debate over Japan’s move to devalue its currency to stimulate growth, with reaction from the G-7 leaders stating that “domestic economic policies must not be used to target currencies,” reports Reuters.
While the G-7 tried to legitimize the currency debasement with this statement, in reality, investors seem to be able to see through to the real motivations.
The main reason the mainstream media gave for the correction in the yellow metal is hedge funds’ selling of gold late last year. According to quarterly filings, Hedge Fund Manager George Soros sold half of his holdings in the SPDR Gold Trust ETF (GLD) in the fourth quarter of 2012. Bloomberg attributed the sell as a move that may “bolster speculation that gold’s 12-year bull-run is coming to the end.” However, Soros may have liquidated his gold holdings because he identified a significant short-term opportunity in the currency markets.
I have said many times that government policies are precursors to change, and late last year, Japan’s new leader, Prime Minister Shinzo Abe, openly indicated his intention to drive down the currency to make the economy more competitive and increase inflation. As a result of Japan’s policy changes, the yen weakened, driving up the price of gold in Japan’s local currency.
In other words, a gold investor in Japan was likely ecstatic with his gold trade over the past few months.
Take a look at the comparison of gold’s return in different currencies. The chart below compares the percentage change of gold in the Japanese yen to the metal’s percentage change in U.S. dollar terms over the last six months. From the middle of August 2012 until about November, gold prices in both currencies closely followed each other.
However, as a result of changes in government policies, over the six-month period, gold rose nearly 19 percent in yen, while only increasing less than one percent in U.S. dollar terms.

George Soros seemed to anticipate the effect that Japan’s government policies would likely have on the velocity of money. This turned out to be a brilliant move, as “wagering against the yen has emerged as the hottest trade on Wall Street over the past three months,” says the Wall Street Journal. The newspaper reported that Soros gained “almost $1 billion on the trade since November,” during a time the yen declined nearly 20 percent in four months.
I admire Soros for his ability to identify significant effects that government policies have on markets as easily as recognizing when ice turns to water. More importantly, he quickly acts on these emerging events.
This isn’t his first big win in foreign markets. In 1992, based on British government policy changes, Soros shorted British pounds and bought German marks, earning $1.8 billion for his fund.
Just like recognizing how new equilibriums can alter the dynamics of an environment, government policies can significantly change the velocity of money. Global investors watch for these trends to know where to invest in commodities and markets, find new opportunities and adjust for risk.
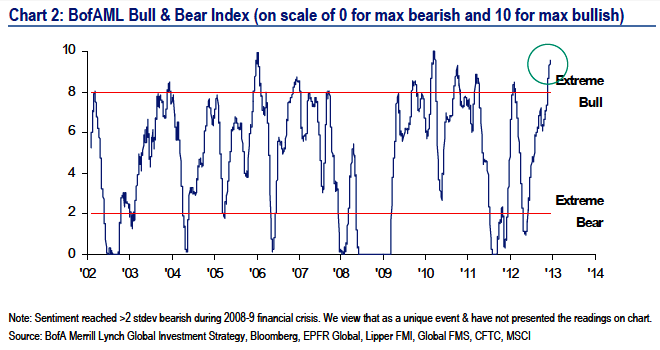
I discussed the potential motivation behind Soros’ trade with Simon Hobbs last week on CNBC. I explained how gold’s correction was reaching an extreme, indicating a potential buying opportunity. You can see on our oscillator model how gold has dropped nearly 2 standard deviations on a year-over-year basis. An event like this has happened only about 2 percent of the time over the last 10 years. Following these extreme lows, gold has historically increased as much as 15 percent over the next year.

Back in June 2012, I told CNBC the same thing: Gold had reached an extreme low, and only a few months later, the metal climbed nearly 10 percent.
During short-term gold corrections, it’s much more important to focus on the facts, including the fact that gold is increasingly viewed as a currency. Rather than buying real estate, lumber or diamonds, central banks around the world are buying gold. According to the World Gold Council (WGC), over 2012, central bank demand totaled 534 tons, a level we have not seen in nearly 50 years.

Emerging market central banks have been adding gold to their reserves, including Mexico, Brazil, the Philippines, South Korea and Russia. Over the past decade, Russia has accumulated a total of 958 tons of gold, making its gold reserves the eighth largest of all central banks, says the WGC.
Another fact about gold is the persistence of the Love Trade. As you can see below, jewelry demand declined slightly, about 3 percent in 2012, and more than half of this demand came from India and China, the countries with a cultural affinity toward gold. India’s gold purchases declined 12 percent due to an import tax and a weak rupee. However, even though the gold price experienced a significant increase in local currency, India’s demand is “all the more remarkable and serves to emphasize the importance of gold to Indian consumers,” says the WGC.
Notably, India had a better-than-expected fourth quarter, and retained its rank as the largest gold market in the world.

In China, there was a slowdown in GDP in the first half of the year, which weighed on gold purchases. For the year, the WGC indicated that there was only a slight increase in demand over the previous year.
In 2013, the WGC expects both markets to remain strong, forecasting growth rates of about 10 to 15 percent. I believe as GDPs in Chindia rise, so will their gold demand. And as long as the precious metal is attractive to both the fear trade and the love trade, hold tight to gold, with a 5 to 10 percent weighting in gold and gold stocks, and rebalancing annually.
Frank Holmes
CEO and Chief Investment Officer, U.S. Global Investors
[U.S. Global Investors, Inc. is an investment management firm specializing in gold, natural resources, emerging markets and global infrastructure opportunities around the world. The company, headquartered in San Antonio, Texas, manages 13 no-load mutual funds in the U.S. Global Investors fund family, as well as funds for international clients.]


 The Pound gets Pounded:
As the global currency war intensifies, the majority of attention has been paid to the 17% fall of the Japanese yen against the U.S. dollar over the past few months. The implosion has given cover to the sad performance of another once mighty currency: the British pound sterling. But in many ways the travails of the pound is far more instructive to those pondering the fate of the U.S. currency.
Japan has a unique economic and demographic profile which makes it a poor stalking horse. Newly elected Prime Minister Shinzo Abe and the Bank of Japan have clearly and forcefully committed Japan to a policy of inflation at any cost. Even in a world of serial money printers their plans stand out as exceptional. Britain, on the other hand, is charting a more conventional course to the same destination.
The UK government, under conservative Prime Minister David Cameron and Chancellor of the Exchequer George Osborne, has succeeded in bringing marginal discipline to their budgetary imbalances. From 2009 to 2012, British government expenditures rose a total of just 1.6%, which was far below the official pace of inflation. (In contrast, U.S. federal spending grew by 7.9% over that time period). Since 2009 the British have kept their debt-to-GDP ratio lower than America’s and have cut into that metric at a faster rate. But while the British are conservative when compared to their American cousins, they are hardly austere when compared to Germany (which continues to have a nearly balanced budget and extremely low debt to GDP). Paul Krugman blames Britain’s lackluster economic performance on their misguided experiment with austerity.
The monetary side of the equation also puts the UK within the spectrum of its peers. Ever since the Great Recession began in 2008 the Bank of England, led by outgoing Governor Mervyn King, has been far more stimulative than the European Central Bankers in Frankfort (but not quite as much as the Federal Reserve or the Bank of Japan). In contrast to the permanent and ongoing bond-buying quantitative easing programs underway in the U.S. and Japan, the Bank of England has engaged in such measures only selectively.
Given the relatively moderate approach pursued by the British, the poor performance of their currency may be hard to fathom. The deciding factor may be that the Pound Sterling is not nearly as vital to investors, or as integrated into the global economy, as the U.S. dollar or the euro. The greenback, being the world’s reserve currency, has always benefited from demand that is independent of its economic fundamentals. The euro benefits from the size of the euro zone and the legacy of German banking discipline. The pound enjoys no such privileges and as a result foreign central banks do not feel as pressured to prop it up. As a result, over the past few years the pound has been… pounded. Since July 2008, the currency is down 26.7% against the U.S. dollar, and in recent months it has started falling faster than all other developed currencies except for the Abe-pummeled yen. Since October 1, 2012 the pound has fallen by 4% against the dollar and 8% against the euro.
The pound’s health is made more suspect by the extreme challenges faced by the Bank of England as it tries to stimulate the most admittedly inflation prone economy among the major Western nations. Unlike the Federal Reserve, which is tasked by statute to combat both inflation and unemployment, the BofE has only a single mandate: to keep inflation contained. On that score it has been failing habitually. Inflation in the UK has been north of its 2% target for the past five years (the current official rate is 2.7%). In its most recent inflation projections, Mr. King admitted that it will stay that way for years to come, and that it may exceed 3% this year and next. With its currency weakening and inflation accelerating, the mandate of the BofE would clearly indicate that the time has come for monetary tightening.
However, like all central bankers, Mr. King, and his successor, the Canadian Mark Carney, will not be bound by such triflings as statutory mandates and past promises. In his press conference last week, Mr. King spoke of “looking past” current inflation figures to a time when he expects inflation will moderate. When the choice is between inflation and the political pain of economic contraction, bankers (at least those who don’t speak German) will choose inflation every time.
While the American media has poked fun at the Bank of England’s backtracking, they somehow do not understand that the Federal Reserve would be doing the same if not for the advantages given to us by the dollar’s reserve status. Our ability to monetize the vast majority of the annual government deficit while exporting our inflation through half trillion dollar trade deficits and the overseas sale of hundreds of billions of Treasury bonds annually means that we do not yet face the pressures bearing down on the Bank of England.
For now at least Cameron is sticking to his guns and making the politically difficult case to voters that today’s hard choices will yield benefits down the road. This puts all the pressure on the Bank of England to satisfy the calls for stimulus. The Federal Reserve is fortunate in that the Obama Administration shares none of Cameron’s fiscal determination.
But already the Fed has done plenty of backing off from its prior promises. Just a few months ago Ben Bernanke announced specific inflation and unemployment triggers that would apparently put monetary policy on automatic pilot. But just last week, Fed Vice Chairman Janet Yellen announced that those goalposts (6.5% unemployment and 2.5% inflation) should not be considered “triggers” but as thresholds past which the Fed “may consider” tightening. When U.S. prices start to rise in earnest, look for the denials and rationalizations to come in torrents. The Fed will never acknowledge high inflation no matter what the data, nor will it ever take any steps to combat it. The simple reason is that it will be unable to do so without bringing on the economic contraction that is so terrifying to the British.
However, as British inflation accelerates, the pressure on the Bank of England to change course will intensify. As monetary stimulus continues to take its toll on the pound, price pressures will mount, even as the economy continues to stagnate. In other words, it is charting a course to stagflation. Perversely, this will put even more pressure on the BofE to ease. However, more cheap money will not stimulate the economy but merely cripple it further by fueling the inflationary fire.
At some point the British will have to admit that stimulus doesn’t work. To break the inflationary spiral and rescue the ailing pound, the BofE will be forced to aggressively raise rates, at which point the British government will have no choice but to slash spending more deeply than would have been the case had they taken their medicine sooner. However, if the BofE refuses to tighten even in the face of much higher official inflation, the pound may deteriorate further and the UK might be left with the embarrassing choice of adopting the euro.
As far as the United States is concerned, the U.K. is the canary in the coal mine. What they are going through now, and what they may be about to go through, we will surely experience in the years ahead. The only difference is that the leeway afforded to us by our special status simply gives us more rope to hang ourselves. When the noose finally tightens, the fall will be that much more painful.

More from Peter Grandich:
- What he lacks in actual performance, he more than makes up with in showmanship.
- Ignoring #1 threat to stocks?
- Currency cold war and can gold benefit from it?
- Worst investment for next decade!
- Why Obama’s big government plans will hinder, not help, the middle class.
- Is the junior resource market dead?
And the Opposing Point of View on the Stock Market:
The greatest moment in two decades’… Three reasons stocks will soar
by Porter Stansberry
“Right now is the greatest moment to be an investor in my nearly two decades in this industry,” Steve Sjuggerud wrote in the most recent issue of True Wealth.
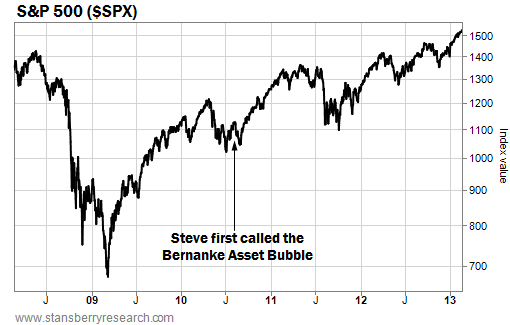
That’s because of what he called the “Bernanke Asset Bubble.”
Steve has been writing about the Bernanke Asset Bubble since August 2010. In short, he predicted Federal Reserve Chairman Ben Bernanke’s easy-money policies would boost all asset classes. And if you put your money into the market back then, you’ve made a fortune…
As you can see in the chart below… the stock market is up since Steve’s call. So is real estate up? Agriculture and farmland are up as well…
Since Steve originally wrote about the Bernanke Asset Bubble, the Fed chairman has gotten even more aggressive with his money printing… Bernanke will add $1 trillion to the Fed’s balance sheet this year – bringing the total debt to $4 trillion. And the Fed won’t raise interest rates “as long as inflation isn’t forecast to rise more than 2.5% in the future and as long as unemployment remains above 6.5%,” according to the Fed’s statement last December.
![]() Steve believes the stock market could rise 95% from current prices in the next three years… And that would only put stocks at fair value. He sees three reasons stocks are set to soar today. From the March issue of hisTrue Wealth newsletter…
Steve believes the stock market could rise 95% from current prices in the next three years… And that would only put stocks at fair value. He sees three reasons stocks are set to soar today. From the March issue of hisTrue Wealth newsletter…
1) U.S. stocks are the best value they’ve ever been during my investing lifetime. The upside potential in U.S. stocks over the next three years could be the biggest in my near-20-year career. And all stocks have to do is return to their average.
2) Zero-percent interest rates are here to stay. Low interest rates are the real “rocket fuel” to this boom. The good news is there’s no chance the government will raise interest rates over the next two years. Meanwhile, we have perfect “Goldilocks” conditions for investing… not too hot, not too cold – JUST RIGHT. THIS is the investing sweet spot… This is where the biggest gains happen over the longest stretches.
3) Lastly, today’s zero-percent rates will force Mom and Pop America to “migrate” into the U.S. stock market… pushing the stock boom into “bubble” territory, possibly in 2015.
In short, stocks remain cheap. And the low yields available in bonds will force investors, en masse, into stocks. This trend is just now beginning… But Steve believes it will reach epic proportions.
To sign up for True Wealth and see exactly how Steve recommends playing this trend, click here… You can readTrue Wealth at zero risk. We offer a 100% money-back guarantee on the product, no questions asked.


-
I know Mike is a very solid investor and respect his opinions very much. So if he says pay attention to this or that - I will.
~ Dale G.
-
I've started managing my own investments so view Michael's site as a one-stop shop from which to get information and perspectives.
~ Dave E.
-
Michael offers easy reading, honest, common sense information that anyone can use in a practical manner.
~ der_al.
-
A sane voice in a scrambled investment world.
~ Ed R.
Inside Edge Pro Contributors

Greg Weldon

Josef Schachter

Tyler Bollhorn

Ryan Irvine

Paul Beattie

Martin Straith

Patrick Ceresna

Mark Leibovit

James Thorne

Victor Adair