
Gold & Precious Metals
Investors sentiment for precious metals and gold and silver mining stocks has deteriorated quite substantially recently. And silver is no exception here, which can be seen on the white metal charts. However, the situation in the whole sector is extreme – the oversold readings on many technical indicators and the fact that very important support lines are currently in play in virtually any asset in the sector form a setup as (or even more) encouraging for potential buyers as what we saw in 2008. To see what we can expect on the silver market, let us move into today’s technical part – we will start with the white metal’s very long-term chart (charts courtesy by stockcharts.com, visit our archives for more gold articles.)
(Click Chart below to Enlarge)
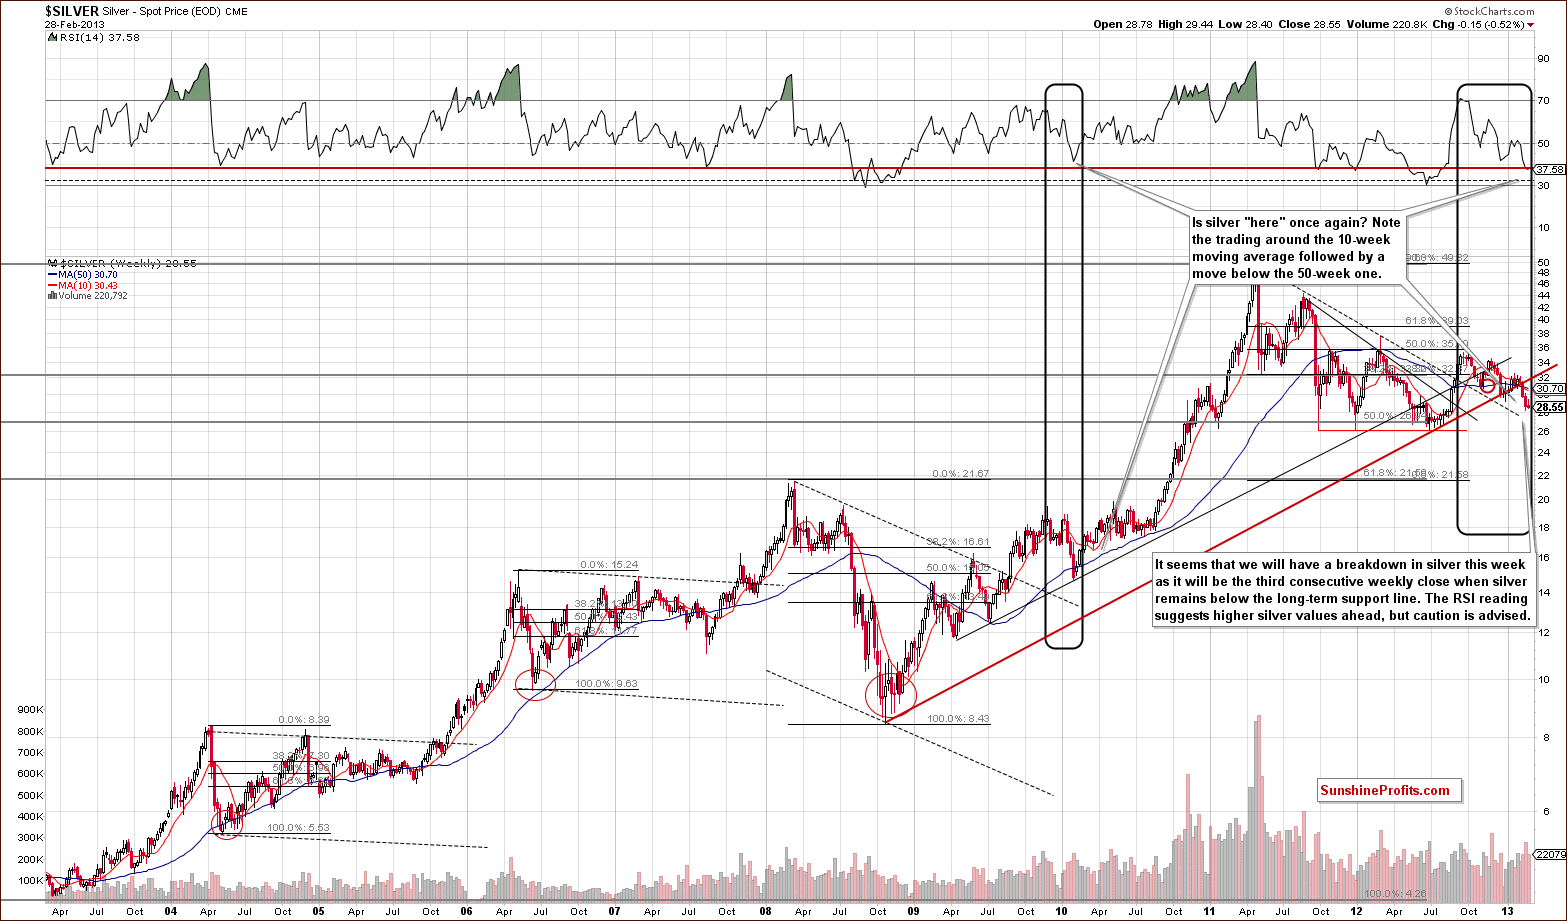
In this chart, we see that RSI levels are now at the horizontal red line which has coincided with major bottoms many times in the past ten years. We have seen two weekly closes below the rising long-term support line (now resistance) and this week will likely be the third. This will confirm the breakdown below this line, and it causes concern for the short term. Based on that, we could see a move lower to the declining dotted line.
However, before and when taking action, we must keep in mind that silver is a tricky metal because it is a relatively small market, and it could be very well the case that it is somewhat manipulated as well. The short-term technical signals are much less important for these reasons if they are not confirmed by what we see in the in the gold market. As indicated in one of our previous essays, the analysis of gold doesn t point to lower prices so the situation on the above chart is “concerning” but not yet clearly bearish at this time.
In the medium-term SLV ETF chart, we saw a rally this week after the cyclical turning point was reached. It seems that this move to the upside has not yet ended. Earlier this year, silver traded back and forth for a bit and then rallied strongly. It was actually the case also in early November, 2012. This seems to be what lies ahead once again for the white metal, and the RSI levels are also close to being oversold here.
Let us have a look at the white metal from the non-USD perspective now.
In this chart we see that the bottom is in and silver’s price is now at the declining long-term support line. When this was last seen, late in 2012 (RSI levels were oversold then as well), prices soon rallied sharply and rose 10% in just a few weeks. With similar trading patterns and RSI levels seen in recent days, there appears to be a good possibility that a sharp move to the upside may be just around the corner here.
Since the correlation between gold and silver and the U.S. dollar start slowly returning to normality (i.e. it is becoming strong and negative), the fact that the dollar is – in our opinion – likely to decline, could translate into higher prices of these two precious metals (and in fact in the whole sector). We would like to address one of our subscriber’s questions here, however, to clarify that it is not the only thing that is behind the white and yellow metals’ prices:
Before summarizing, we would like to comment on one more issue – the recent strength in the USD Index, as we received quite a few questions about it this week.
The dollar is higher than it close last week and gold is more or less flat – so while gold moved in the opposite direction to the USD Index on a day-to-day basis, it overall responded positively. Gold (and silver as you can see on the above silver:UDN chart) is oversold not only from the USD perspective but also when we consider its price in other currencies. That (plus several other reasons) is why gold is likely to move higher even if the USD doesn’t decline and gold is likely to accelerate if the USD does indeed decline.
Summing up, the signals are somewhat mixed for the white metal this week. The breakdown below the rising long-term support line will likely be confirmed with a third weekly close below this level, but prices may still reverse soon because the situation in gold remains positive. The short-term picture is a bit more bullish with an oversold situation and trading patterns similar to those which preceded a rally very early this year.
To make sure that you are notified once the new features are implemented, and get immediate access to our free thoughts on the market, including information not available publicly, we urge you to sign up for our free gold investment newsletter. Sign up today and you’ll also get free, 7-day access to the Premium Sections on our website, including valuable tools and charts dedicated to serious Precious Metals Investors and Traders along with our 14 best gold investment practices. It’s free and you may unsubscribe at any time.
Thank you for reading. Have a great weekend and profitable week!
Przemyslaw Radomski, CFA
Founder, Editor-in-chief
Gold Investment & Silver Investment Website – SunshineProfits.com
* * * * *
About Sunshine Profits
Sunshine Profits enables anyone to forecast market changes with a level of accuracy that was once only available to closed-door institutions. It provides free trial access to its best investment tools (including lists of best gold stocks and silver stocks), proprietary gold & silver indicators, buy & sell signals, weekly newsletter, and more.Seeing is believing.
Disclaimer
All essays, research and information found above represent analyses and opinions of Przemyslaw Radomski, CFA and Sunshine Profits’ associates only. As such, it may prove wrong and be a subject to change without notice. Opinions and analyses were based on data available to authors of respective essays at the time of writing. Although the information provided above is based on careful research and sources that are believed to be accurate, Przemyslaw Radomski, CFA and his associates do not guarantee the accuracy or thoroughness of the data or information reported. The opinions published above are neither an offer nor a recommendation to purchase or sell any securities. Mr. Radomski is not a Registered Securities Advisor. By reading Przemyslaw Radomski’s, CFA reports you fully agree that he will not be held responsible or liable for any decisions you make regarding any information provided in these reports. Investing, trading and speculation in any financial markets may involve high risk of loss. Przemyslaw Radomski, CFA, Sunshine Profits’ employees and affiliates as well as members of their families may have a short or long position in any securities, including those mentioned in any of the reports or essays, and may make additional purchases and/or sales of those securities without notice.


SIGNS OF THE TIMES
“The lone dissenting voice on the Federal Open Market Committee defended her hawkish philosophy.”
“Possible risks and costs of these [easy money] policies may be exceeding their benefits.”
– Dow Jones, February 12
“India’s industrial output unexpectedly slid in December for a second month as demand falters in an economy expanding at the weakest pace in a decade.”
– Bloomberg, February 12
“Europe’s brittle economies shrank at their fastest rate since the collapse of Lehman four years ago.”
– Financial Times, February 14
“Wal-Mart had the worst sales start to a month in seven years as payroll-tax increases hit shoppers.”
– Bloomberg, February 15
White House strategists are probably thinking: “Good, more on food stamps and on disability compensation”. The Alinsky theory of revolution has been to collapse the detestable American economy by overwhelming the welfare system.
“Bank of England Governor Outvoted in Bid to Launch Fresh QE Boost”
– The Guardian, February 20 Oooops! This could be defining a new financial term – “Recklessness Off”.
*****
PERSPECTIVE
Somewhere around noon yesterday, New York time, a story started the rounds about a hedge fund having some troubles with a position in commodities. In looking at what could be basing action in agriculturals, the problem is in metal prices. Mainly silver with the biggest decline (-3%), gold (-2.5%) and to a lesser degree base metals (-0.9%). Then, mid-day “they” took out crude oil (-2.2%), which could be Mr. Margin hitting whatever bids were around.
In the excitement, crude set an outside reversal, to the downside. As did the DJIA, the yen and lumber. The British pound did the reversal on Tuesday. Going the other way, the Dollar Index did the outside reversal – to the upside.
As we note, such reversals do not necessarily mark a trend change, but often indicate that the action has become excessive. Perhaps preliminary to an important change.
STOCK MARKETS
Over the past three weeks our theme has been that the general stock market was working on a rounding top. Within this, some sectors such as Forestry, Homebuilders and Airlines reached sentiment and momentum levels usually seen at important tops. Last week we concluded that these excesses were “providing some good trading opportunities”.
The DJIA rose to a new high for the move, yesterday, and then accomplished the full outside reversal. As did the Dow Transports. The S&P also achieved a new high and reversed as well, but with Wednesday’s high the same as Tuesday’s. For technicians such big reversals from new highs are fascinating.
For the general stock market, the rounding top would lead to an intermediate decline. This seems to be working out. A little more development on the change and the Chartworks can provide a downside target.
CREDIT MARKETS
On the 13th, Bloomberg reported:
“The collapse of two junk-bond offerings in Brazil shows that Latin America’s largest economy is getting hurt from the global pullback in high-yield demand.”
Representing action in the high-yield sector, junk (JNK) accomplished the full reversal yesterday. The high price, with good momentum, was 41.21 in January. The initial decline was to 40.40 a couple of weeks ago and the rebound high was 40.84 yesterday.
Taking out 40.40 sets the downtrend.
In September the Fed announced it was going to buy sub-prime mortgage bonds. The price rose from 56 to 61 on the news. Then it drifted down to 58 in early November and with the revival in animated spirits it jumped to 68.5 at the end of December.
Out of the gloom of the 2008 Crash the representative bond almost doubled from 38. Perhaps the best is in.
It is worth noting that while the Fed plan has been to buy $40 billion of mortgage-backed bonds each month the price action has been sympathetic to market forces. Down into November and up into December. And then drifting down.
It seems that the Fed and European Central Bank have been anxious to get aboard the last stagecoach into Dodge City.
Long Treasuries became oversold a few weeks ago and the price has based at the 142 level. We have been looking for a rally as other assets weakened. Rising above 143.5 will set the uptrend. It’s up to 144.21 today.
CURRENCIES
Following the modest concerns into early November the dollar was likely to decline into January as stocks, corporate bonds and commodities rose. The high was 81.46 in mid- November and the low was 78.92 at the first of this month.
It was a modest move, but hot action in popular assets was inspired by the 16% plunge in the yen against the euro, which reached a very oversold condition. Since last week the yen has been basing.
Last week we thought that the C$ could roll into a “modest decline”. The 99 support level was taken out on Tuesday. There is another level of support at 98 and the daily RSI is down to 26, which is close limiting the decline.
The USD has jumped from 78.92 to 81 in three weeks. There is resistance at 81.5 and the daily RSI is near the level that would suggest a pause in the rise.
However, the move in the yen was “wild” and it is uncertain as to where the “wild” could next appear. We will stay with our methods of watching for trend changes and trend durations, but with an eye for “wild”.
COMMODITIES
On February 15 CBS Detroit reported:
“Left in the Dark: Copper Thieves Rob Detroit Freeways of Light”
This is anecdotal evidence that copper’s real price is still high. The nearby chart of copper deflated by the PPI shows that it has been unusually high for some 6 years. The last such example prevailed from 1966 until 1974 and was followed by a bear market that endured to 2001. This could be attributed to increases in productivity in finding and mining copper.
Today’s high prices have been essentially due to demand from China. The reformation from Communism to the prosperity of a country enjoying less intrusive central planning has prompted a remarkable increase in demand. As with the earlier example, today’s high prices has prompted a massive increase in mine capacity.
A long bear market would be natural. That the world is in another post-bubble contraction provides confirmation. This would be the case for all base metals.
Our data only goes back to 1825 and the record has been that copper’s real price has declined through each post-bubble contraction. This compares to gold’s real price as it generally increases. Both are characteristic of the long contractions that have run for some twenty years.
On the nearer-term, March copper was trading at 3.75 on Friday and dropped 5.4% to 3.54 today. This is a serious break and with it the base metal index (GYX) has dropped from 405 to 382, or 6%.
On the same move mining stocks (SPTMN) have dropped 8%. From the high of 1050 at the first of the year they are down 16% to 903. Mining stocks have again led what could be at least an intermediate decline for the sector.
Two weeks ago crude oil registered a Sequential Sell and the high was 98.24 on January 28. Today it’s been as low as 92.63. There is minor support and this level and stronger support at 85.
Other than agriculturals, most commodities seem to have started an intermediate decline.
In the latter part of the day, agricultural prices rolled over. Cotton was down 1.18%, sugar down 1.26%, corn down 1.54% and wheat plunged 2.34%.
Chart action on the index (GKX) became moderately oversold at 437 in early January and bounced to 469 a few weeks later. A test was needed and the low was 439 last week. It rose to 448 yesterday and fell to 441 today.
Recent action seemed to be preparing for an intermediate rally. However, the slump in so many other asset sectors and a firming dollar suggests this could take some time.
Agricultural prices could be vulnerable to further declines. Breaking through 439 would be the indicator.
Gold/Commodities: Our Proxy for the Real Price


Link to February 21, 2013 ‘Bob and Phil Show’ on TalkDigitalNetwork.com:
http://talkdigitalnetwork.com/2013/02/a-week-of-reversals/
BOB HOYE, INSTITUTIONAL ADVISORS
E-MAIL bhoye.institutionaladvisors@telus.net
WEBSITE: www.institutionaladvisors.com

 Mike Campbell asked some of the smartest Investors exactly how they invest in their RRSP’s. Two strategies were common amongst them:
1. Each one follows a disciplined investment approach.
2. They don’t invest in a lump at the March Deadline.
A good example of a disciplined approach was expressed by Brent Woyat of Ocean Forest Investment. Brent decided that he was going to make regular monthly contributions to his RRSP, a strategy that allows him to build up his savings using a dollar cost averaging approach. It also allows him to buy in both up and down markets. Brent thinks it is a mistake for investors to invest a lump sum once a year at the deadline date, his research numbers shows him that this is not the best approach.
As for his actual investment strategy, he buys only large cap, good quality, big blue chip companies, specifically because they have the resources to look after themselves during bad times. As well it allows him an overall dividend yield in his portfolio of 4 1/2%, well above what he could gain in the Bond Market.
His portfolio is comprised of 15 household name stocks, 10 from Canada and 5 from the US, selecting the those that have the highest yield. Specifically, on the US side he owns AT&T, Microsoft, Pfizer, GE and Intel. On the Canadian a few of the companies he invests in are TransAlta, BCE, Sun Life, Bank of Montreal and CIBC. His portfolio is Total Return, which means he has both the potential for capital gains as well as an increase in his dividend yield if companies raise their dividends. Finally he does a covered call writing program (something Michael is a big proponent of) that increases his portfolio return.
Aaron Dunn of KeyStone Financial looks at his RRSP as his long term account. Aaron puts in stocks that while he is going to monitor them on a regular basis, they are the type as Warren Buffet said, “that you never have to sell.” He also likes to find companies that are paying a dividend in the range of 3-5%. Companies that are relatively low risk, that are just growing over time and preferably have a dividend re-investment program.
One company he likes that fits all of his RRSP investment objectives is Alta Gas, symbol ALA, which pays a 4% dividend. They have been growing their dividend consistently, have very robust capital projects coming online over the next couple of years that they expect are going to accelerate their dividend growth. Some things Aaron really likes about this company is that the CEO actually started this business, has grown it into a multi-billion business, and he still has a significant shareholding himself.
Darin Wagner of Balmoral Resources has a completely different approach. Since he lives in the high risk end of the pool as President of Balmoral Resources, a Gold exploration company that creates shareholder value through exploration and acquisition. He has decided that his objectives in his RRSP will be more within his area of expertise, in other words more growth and capital gains oriented. His mix within both is 70% growth stocks that pay dividends and have good capital gains potential, and 30% aggressive growth stocks. One aspect he searches for in any given year is to try and make investments in sectors that are at least a little bit out of favor. His thinking there is that he can win the growth the company is getting, as well as get some growth out of the sector as it turns.
One sector Darin mentions that is out of favour at the moment is Gold stocks. In that area he likes GoldCorp, symbol G.TO. Another in that sector is Virginia Mines, symbol VGQ.TO. Virginia Mines is a company that is just about to receive a revenue stream and Darin thinks that there is a good possibility that it will soon begin to pay a dividend. In the aggressive risk area he investing in Falco Pacific Resource Group Inc., symbol FPC.V, a company he is not only involved with, but that recently announced a 6 3/4 million ounce Gold resource.
Andrew Ruhland of Integrated Wealth Mgmt. has a diversified by risk strategy that fits both his 45 year old age and that he has kids who are about to go to University. At the moment Andrew thinks markets are stretched to the upside so he has a maximum defensive position with preferred stocks, covered call strategies and corporate bonds. Currently for the short term he also has a 30% short position in the Russell 2000, has bought some long term bonds because he thinks they have just hit a short term bottom, and on the recent sell-off he has picked up some Gold and some Gold stocks.
Steve Deschesnes is the strategist for Disnat’s GPS, a portfolio that has beaten the market every year since its implementation 5 years ago. The first thing Steve makes very clear is that although we are at the RRSP deadline there is NO reason to invest now. The season for investing as far as Steve is concerned is the beginning of the Hockey Season. For those who aren’t Canadian, the beginning of that period is August or September. Steve’s wants to buy at the beginning of that period because in his opinion the market stops being good by April or May, thus he does’t buy at the RRSP Deadline in March is because in that period he is more likely to be taking profits. That said, if he had to invest right now in March he mentioned Gold which has sold off substantially from its high of $1,913.50 on August 23, 2011. Though he wouldn’t call it an investment, he does think that anyone who doesn’t have gold right here should buy some here as insurance.
Nor does he like bonds at all. He can’t imagine investing in Government Bonds at a 2% yield for 10 years, when inflation is higher than that and he will lose money. If you had to invest in Bonds, a product that he does like is a Real Return Bond ETF symbol XRB, which is designed to give you protection against inflation.
Bottom line, Steve thinks that although you have to put your money in your RRSP now in March, you don’t have to invest that money until the market is favorable. While you are waiting or an opportunity to invest you can park yourself in something defensive, Steve mentioned the BMO Covered Call ETF symbol ZWB as a place you can consider parking your money to earn a good return until it is time to cash out and invest later in the year.
Ozzie Jurock of Jurock’s Real Estate Insider does have an RRSP. Ozzie is with Oscar Wilder who once said “When I was young I thought that money was the most important thing in life, now that I am old I know that it is.” Thus Ozzie has always had an RRSP, just to have the discipline of putting money away and saving taxes.
That said, Ozzie doesn’t buy stocks and bonds as his main goal is to preserve capital. So he only invests in safe instruments, seeking to earn only 3% a year. One interesting thing he has done in the past is to take money out of his RRSP in the form of a mortgage. Taking money out in the form of a 1st or 2nd mortgage is the only way you can take money out of your RRSP tax free. Because there are some setup fees, annual fees, appraisals as well as insurance in taking a mortgage from your RRSP, Ozzie doesn’t think that it would be worth doing for only 20K. Rather he thinks you should have a larger sum of 100K or more before it is worth taking out a mortgage from your RRSP
The comments above are from a February 16th Money Talks show – Ed
 “The market is very schizophrenic. However it is possible to follow only a mild (Stock Market -Ed) correction in February, after which the growth to continue.”
“In this situation sell. Restrict positions because euphoria gaining strength.”
“Corporate profits are likely to disappoint this year. Incidentally, there may be geopolitical problems” said Faber, adding that recently returned from a trip to the Middle East, which is the “melting pot.”
Oil demand will be strong
Faber – 2013 Gold Price Prediction
(Faber has 25% of his assets in Gold- Ed)
Marc Faber in a recent interview discussing his predictions and outlook for 2013 regarding gold and silver prices. I have some concerns about confiscation especially in the united states Faber said ” I have argued for the last 12 years that investors should buy a little bit of physical gold every month and put it aside without concerns about corrections. If you don’t own any gold, I would start buying some right away, keeping in mind that it could go down. For the last 40 years in my business I’ve seen people always lose money when they put too much money into something and then it goes down. They panic and sell, or they have a margin call to sell—and lose money. I own gold. It’s my biggest position in my life. The possibility of the gold price going down doesn’t disturb me. Every bull market has corrections.” Marc Faber said in another interview regarding owning Gold


-
I know Mike is a very solid investor and respect his opinions very much. So if he says pay attention to this or that - I will.
~ Dale G.
-
I've started managing my own investments so view Michael's site as a one-stop shop from which to get information and perspectives.
~ Dave E.
-
Michael offers easy reading, honest, common sense information that anyone can use in a practical manner.
~ der_al.
-
A sane voice in a scrambled investment world.
~ Ed R.
Inside Edge Pro Contributors

Greg Weldon

Josef Schachter

Tyler Bollhorn

Ryan Irvine

Paul Beattie

Martin Straith

Patrick Ceresna

Mark Leibovit

James Thorne

Victor Adair