
Stocks & Equities
Index futures moved higher following release of the U.S. employment report at 8:30 AM EST. Consesnsus for February Non-farm Payrolls was 165,000 versus 157,000 in January. Actual was an increase of 236,000. However, January was adjusted to 119,000 from 157,000. Consensus for February Private Non-farm Payrolls was 178,000 versus 166,000. Actual was 246,000 versus an adjusted 140,000 in January. Consensus for the February Unemployment Rate was 7.9% versus 7.9% in January. Actual was a decline to 7.7%. Consensus for February Hourly Earnings was a gain of 0.2% versus an increase in 0.2% in January. Actual was a gain of 0.2%.
Canada’s February Employment report was brighter than the U.S. employment report. Consensus for February employment was an increase of 8,000 versus a decline of 21,900 in January. Actual was an increase of 50,700.
Canada’s Housing Starts in February were better than expected. Consensus was 174,000 versus 160,600 in January. Actual was 188,719.
Hecla Mining added $0.10 to $4.18 after Global Hunter upgraded the stock from Neutral to Buy.
Tiffany fell $0.88 to $70.00 after Canaccord downgraded the stock from Hold to Sell.
Mark Leibovit on Bloomberg Radio
Following is a link to yesterday’s interview:
http://www.vrtrader.com/files/BloombergwithPimmFoxMarch72013.mp3
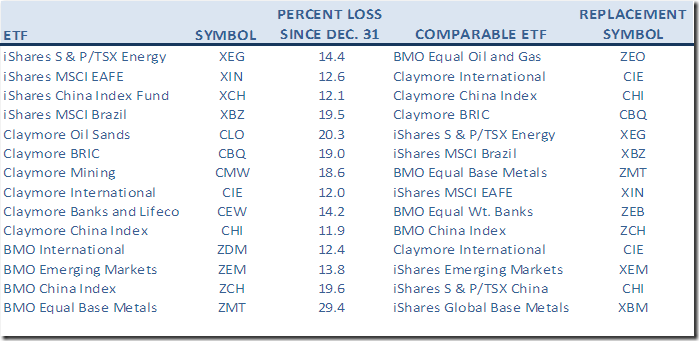
Interesting Charts
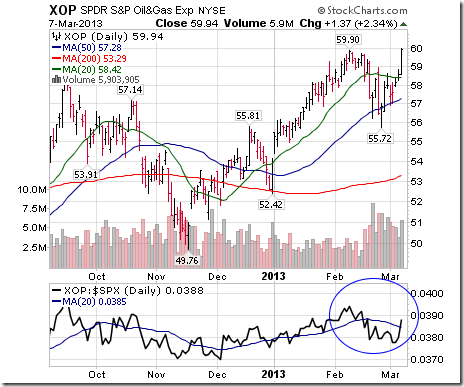
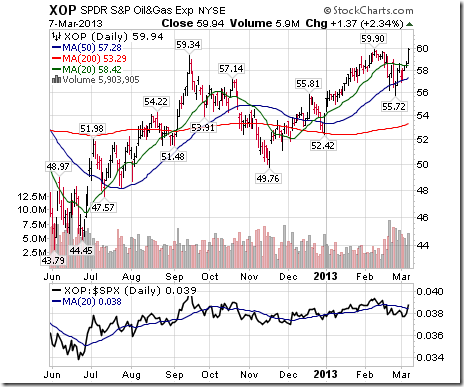
The energy sector finally woke up yesterday after significantly underperforming the market during the past four weeks.
The Money Center ETF broke to a new high yesterday prior to release of stress tests by the Federal Reserve on the top 18 U.S. financial institutions. All except Allied Financial past the test. Traders are expected several of the Money Center banks to respond by increasing their dividend shortly.

Updates on Sector Seasonal Trades
Seasonal trades optimally have a technical score of 3 based on (1) uptrend, (2) trading above its 20 day moving average and (3) outperforming the market (S&P 500 for U.S. holdings, TSX for Canadian holdings). Scores moving lower than 3 are warnings signs. A score of 0-0.5 is a sell signal. The following seasonal trades have a technical score of 1.0 or higher and are in their period of seasonal strength. Their retention is recommended.
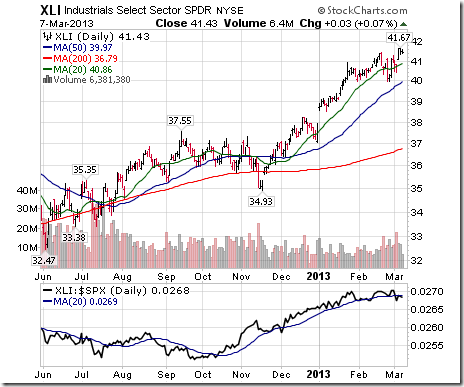
Technical score for Industrial SPDRs changed from 3.0 to 2.5 when strength relative to the S&P 500 Index changed from positive to neutral. Seasonal influences are positive until early May.
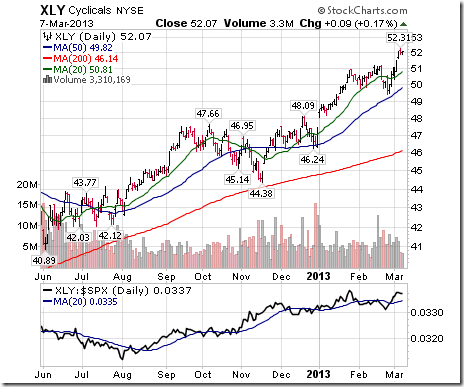
Technical score for Consumer Discretionary SPDRs changed from 2.5 to 3.0 after units broke above resistance at $51.23. Seasonal influences are positive until mid-April.
Technical score on Retail SPDRs increased to 1.5 to 2.5 when units moved above their 20 day moving average. Seasonal influences are positive until mid-April.

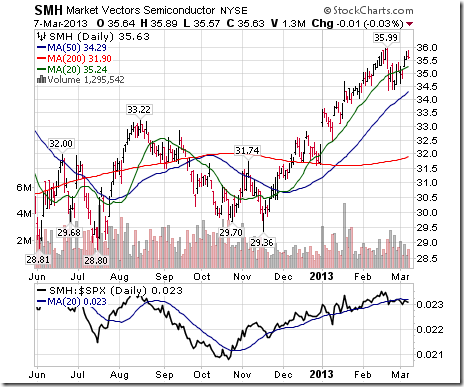
Technical score for the Semiconductor ETF remains unchanged at 2.0. However, the period of seasonal strength on average closes today. Take profit
Technical score for Palladium increased from 1.0 to 2.0 on a move above its 20 day moving average. Seasonal influences are positive until the end of April.
Technical score for the Oil & Gas Oil and Gas Exploration ETF increase from 1.0 to 2.5 on a move above its 20 day moving average, a break above resistance at $59.90 and an improvement by relative strength from negative to neutral. Seasonal influences are positive until mid-April.
Technical score by Energy SPDRs increased to 2.0 from 1.0 when units moved above their 20 day moving average. Seasonal influences are positive until the end of April.
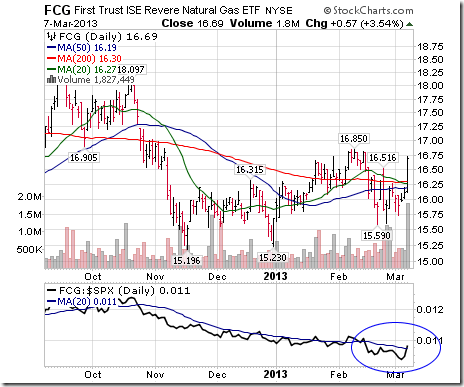
Technical score by Gasoline remains unchanged at 1.0. Seasonal influences are positive until the end of April.

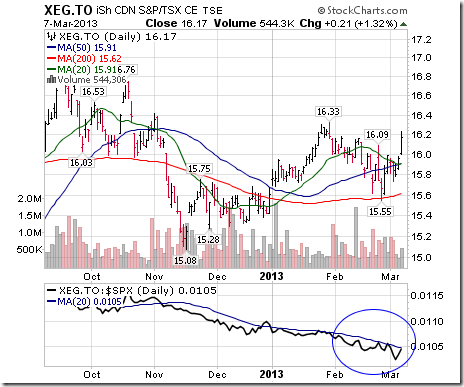
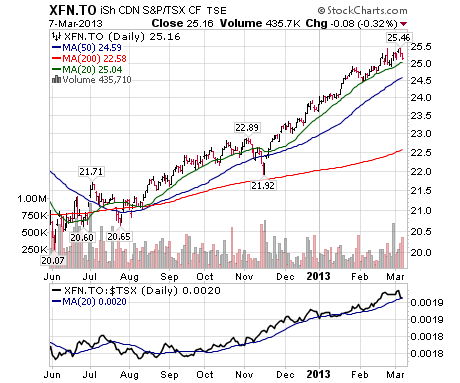
Technical score for the TSX Financial Services ETF remains unchanged at 3.0. Seasonal influences are positive until mid-April.
Special Free Services available through www.equityclock.com
Equityclock.com is offering free access to a data base showing seasonal studies on individual stocks and sectors. The data base holds seasonality studies on over 1000 big and moderate cap securities and indices. Notice that most of the seasonality charts have been updated recently.
To login, simply go to http://www.equityclock.com/charts/
Following is an example:
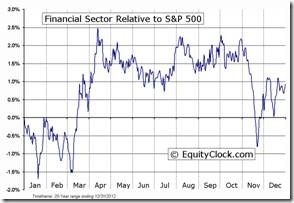
Financial Sector Seasonal Chart

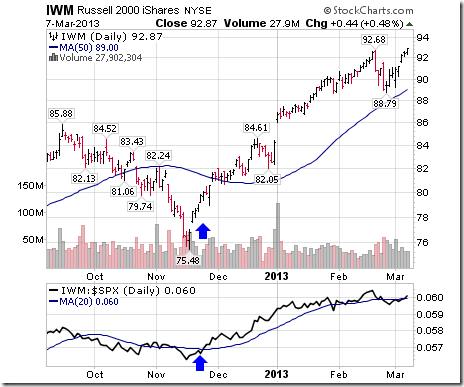
An Update on the U.S. Small Cap sector/market
According to Thackray’s 2013 Investor’s Guide, the period of seasonal strength for the U.S. small cap sector is from December 19thto March 7th. This year the technical clicked in earlier than usual. Units moved above their 20 day moving average and began to outperform the S&P 500 Index in late November. Since then, units significantly outperformed the S&P 500 Index. However, units currently have returned to neutral relative to the S&P 500 Index and the period of seasonal strength has ended. Nice trade! Take seasonal profits.

We’ve all heard of the usual ways people try to save or generate more money to pay off their debts: cutting out the daily latte, brown-bagging lunch, getting a weekend job, or starting a side business selling clothing, toys, or beauty products.
But some people go to extremes to find ways to accelerate their debt payments and get rid of the IOUs once and for all.
We asked credit counselors across the country to share some of the more dramatic approaches their clients have used to get out of debt.
 Become an eBay black belt. While many people sell items on eBay, not all of them are as resourceful as one client who went to the Consumer Credit Counseling Services of Central Oklahoma in Bethany, Okla., and was put on a debt management plan to pay off about $30,000 in debt over four years.
The woman began to send in extra money — on a frequent basis — to pay off her debt. Turns out she was earning that extra money through eBay.
“She told me that she found a way to inexpensively buy basic items like cookware and underwear, and was able to sell them on eBay to people who lived in really rural, remote areas,” says Cristy Cash, director of counseling with CCCS of Central Oklahoma. “She said most of her clients had P.O. boxes in places like Alaska and Canada. She was doing so well that she paid off her debt in full in two years instead of four.”
….other 4 HERE

Right now, gold is under pressure, and once-shining precious-metals explorers and developers are getting crushed like old cans.
That’s why, as you read this, I’m in Toronto at the Prospectors & Developers Association of Canada (PDAC), Canada’s biggest mining conference.
It’s the 81st gathering of explorers, developers and resource producers from all over Canada and the world, and is expected to play host to some 30,000 people from 30 countries.
It’s not shocking that so many people — including professional and individual investors — are gathering to get to know the companies that might (or might not) be worthy of their investment dollars.
I’m planning to get as much face time as I can with these experts during what feels like a gravediggers’ banquet in gold. And I look forward to sharing what I learn with you about gold and the people who bring it to market.
First, let’s take a look at the carnage that no amount of polish can cover up in all things related to the shiny gold metal …
‘A Healthy Culling’
After peaking in 2011, gold has been zig-zagging sideways. But as painful as it has been for gold, it’s agony for large-cap miners, who have lost a third of their value.
And it’s a downright heart attack for explorers, who have lost two-thirds of their value at the same time.

Recently, John Kaiser of KaiserBottomFish.com pointed out that about 600 mining and exploration companies on the TSX Venture Exchange had less than $200,000 in the bank. He predicted that 500 of those companies would go out of business in the next year in what he calls “a healthy culling.”
I’ve written about how the business model for the juniors has changed. They used to dream of building up a project and selling it to a big mining company. But the big companies have full pipelines and aren’t in the market for new projects.
At the same time, funding has dried up for many companies. The amount of money that mining companies were able to raise in capital markets dropped by 25% last year to $249 billion. The market for initial public offerings came to a virtual standstill.
So, I expect to see some long faces in Toronto. And with all this doom and gloom, it might adopt the mood of the gravediggers’ banquet we’re seeing right now in gold.
That said, I’m starting to see some very hopeful signs — five of them, in fact — not just for gold, but for the companies who find, produce and bring this and other precious metals to market.
I’ve learned the hard way that the PDAC usually marks a short-term top in mining stock shares. Maybe this year it will mark a bottom. Let me tell you some of the things I’m seeing …
5 Positive Signs for Miners Right Now
1. Insiders are Buying. One of the worrying things about U.S. stock markets is that insiders are selling their own stocks at a furious rate. Recently, senior executives and directors at New York Stock Exchange-listed firms dumped 9.2 shares for every share they bought.
The last time insiders were this bearish coincided with the last big stock market peak.
But that’s in the United States. North of the border, Canadian insiders are buying with both hands.
Insiders are snapping up shares among beaten-down energy, mining and industrial stocks, according to a recent report from Vancouver-based INK Research.
There are many reasons for insiders to sell. There’s only one reason for them to buy — they believe that their stocks are undervalued.
2. Big Miners Need More & Better Projects. The big miners may say they have full pipelines, but for the most part, that’s not true — not if they want to keep increasing production.
Why do I say that? Because of the world’s top 10 gold producers, seven of them saw their production go down last year. Barrick Gold’s (ABX) production fell 3.4%. Newmont Mining (NEM) saw a 4% decline.
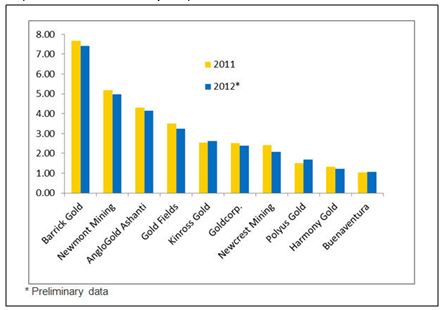
AngloGold Ashanti (AU) saw a 3% drop. Gold Fields (GFI) experienced a 6% drop. Goldcorp (GG) saw a 4.8% decline.
Only Kinross Gold (KGC), Polyus Gold (PLZLY) and Buenaventura (BVN) saw production increases.
Barrick Gold’s production fell 3.4%. Newmont Mining saw a 4% decline. AngloGold Ashanti saw a 3% drop. Gold Fields experienced a 6% drop. Goldcorp saw a 4.8% decline.
Do those sound like companies that should rest on their laurels? Or do those sound like companies that need to buy up good projects and re-stuff their pipelines with more ounces?
I’d say it’s the latter, and that’s what they have to do if they want to see their share prices go up again. That, in turn, should be bullish for developers with good projects.
By the way, less production by the big miners should be bullish for gold prices.
3. China’s Gold Demand Is Rising. It is expected to outstrip its mine production by 550 metric tons in 2015, according to statistics that were recently released.
In other China news, that country will probably launch a gold-based ETF this year. Will that crank up China’s gold demand? It will if the experience of the U.S. gold ETF is any example.
4. Central Banks are Buying a Lot of Gold. Purchases of the yellow metal by the world’s central banks rose 17% in 2012, according to the World Gold Council. Central bank demand totaled 534 metric tons, a level not seen in 48 years!
What’s more, purchases rose 29% in the fourth quarter over the year-earlier period. So, it seems like central bank gold purchases are accelerating.
5. Gold and Silver Miners are Hated! Last week, I ran a screen and found 18 gold miners, three silver producers and two Canadian gold and silver funds that were trading for LESS than book value.
Some of them are trading at a LOT less than book value. And these are producing miners … with cash flow … many of them poised to increase the amount of ounces they pull out the ground.
Many of these companies are in much better financial shape than they were when their share prices were 30% … 50% … 60% higher. So what’s changed? Investor sentiment has changed — miners are hated right now.
As an investor, this has me licking my chops, ready to scoop up “diamonds” thrown in the dust bin.Many of these stocks are cheap, but they won’t stay that way. And if you have patience, the rewards could be very rich indeed.
Of course, you have to be selective. That’s one reason I’m in Toronto, to get face-to-face meetings with as many miners as possible. I want to check out the management and see if their plans are pie-in-the-sky or down-to-earth.
I’ll be coming back the best picks for my subscribers — as well as video interviews with explorers, developers, miners and more. Doom and gloom? Gravediggers’ Banquet? Think again!
The fact is, the fat lady hasn’t sung for gold yet. Not even close! I’m not saying gold has bottomed — but I am saying we are very close to an amazing opportunity.
This is an opportunity to pick up some incredible companies at dirt-cheap prices — and bearish investor sentiment is handing it to you on a silver platter. The bargains are extraordinary — the likes of which we may not see again.
So stay tuned for my updates in Global Resource Hunter and Red-Hot Global Resources. More great things are coming your way.
Good luck and good trades,
Sean
About Sean Brodrick
Sean Brodrick is a natural resources expert and editor of Global Resource Hunter, a monthly newsletter designed to help you ride the commodity supercycle – an ongoing surge in price of food, energy, metals and more.
Sean is also the editor of Red-Hot Global Resources, a weekly newsletter that aims to help you rack up profits with commodity-focused exchange-traded funds (ETFs) and natural resource-sensitive stocks that operate around the world.


Warren Buffet’s Compounded Annual Gain from 1965-2012 is 19.7%, a figure that makes his annual letter to Berkshire Hathaway Shareholders compelling reading for the investment community. His letter begins below:
To the Shareholders of Berkshire Hathaway Inc.:
In 2012, Berkshire achieved a total gain for its shareholders of $24.1 billion. We used $1.3 billion of that to repurchase our stock, which left us with an increase in net worth of $22.8 billion for the year. The per-share book value of both our Class A and Class B stock increased by 14.4%. Over the last 48 years (that is, since present management took over), book value has grown from $19 to $114,214, a rate of 19.7% compounded annually.*
A number of good things happened at Berkshire last year, but let’s first get the bad news out of the way.
Š When the partnership I ran took control of Berkshire in 1965, I could never have dreamed that a year in which we had a gain of $24.1 billion would be subpar, in terms of the comparison we present on the facing page.
But subpar it was. For the ninth time in 48 years, Berkshire’s percentage increase in book value was less than the S&P’s percentage gain (a calculation that includes dividends as well as price appreciation). In eight of those nine years, it should be noted, the S&P had a gain of 15% or more. We do better when the wind is in our face.
…..read the whole letter HERE
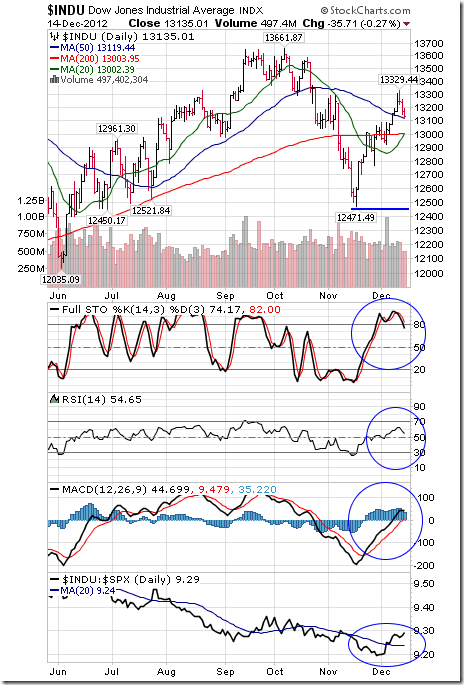
“Yesterday history was made when the Dow rose to a new record high and finally confirmed the prior record high put in by the Transports. The question now becomes — what do we have here, a weird kind of bear market or a new bull market?”
“The honest answer is that in all my years of studying and dealing with the markets, I’ve never seen anything like the action since the 2009 bottom. As a practice study, I rethought the whole 1920s series as if I was reconstructing the events of 1929. Suppose, after the September, 1929 record high in the Dow, the Rails had turned up from the crash lows and had also risen to a new record high?
Then suppose the Dow had followed, and the Dow had risen to a new all-time high? Such action would have been puzzling, but what would analysts have called it? My guess is that analysts would have simply called it “confusing and unprecedented.”
And I’m going to do the same thing today. The collapse of 2008-09 was labeled a bear market by everybody. The bull market of 1980 to 2007 was obviously a huge bull market which lasted 27 years. Following a 27-year bull market, we might have expected a bear market lasting one-third to two-thirds as long as the preceding bull market.
A bear market lasting one-third (nine years) in duration as long as the 1980-2007 bull market would be expected to carry into at least 2016. Thus, on a timing basis I have to think that all the stock market action since 2007 was one continuous and erratic bear market.
Question — OK, Russell, then what about the record highs recorded by both the Dow and the Transports?
Answer — My only answer to this is that both D-J Averages produced something never seen before, namely new highs during a post-crash upward correction. My explanation of this unprecedented situation is that the advance to new highs was a direct result of never-before-seen manipulation by the Federal Reserve.
The Fed was able to engineer new post-crash highs in both D-J Averages. But I doubt if the Fed will be able to engineer a coming new era of prosperity in America. Thus, it will be an example of where the stock market will not be predicting the nation’s economic future.
As a matter of fact, I believe this stock market is predicting a very mixed and confusing economic future for the US. As far as I can see, the Fed will be pumping in QE-to infinity for as long as it can get away with it. The only thing that might halt the Fed is rebukes from voting members based on it’s outrageous 3 trillion dollar balance sheet. We’re in uncharted territory in my opinion, and I expect to see a number of events in both the stock market and the economy which will be both surprising and upsetting.
One technical observation — With the breakout and confirmation by the Industrials, this places tremendous psychological pressure on the 13.108 million shorts that are now positioned on the NYSE. As a result, we should see irregular spates of short covering or buying panics, depending on the fears and psyches of the short sellers. This makes shorting stocks in this market a risky game.
My view for the future — erratic market action along with a disappointing US economy. Incidentally, I don’t know if you noticed, but some of the heavily shorted stocks surged yesterday, due, in part, to frantic and fear-filled short covering.
Item — Since the 2007 bull market high, 18 D-J Industrial stocks are now higher than they were in 2007 and 12 are lower.
Gold and particularly gold mining stocks are being bad-mouthed unmercifully. It’s almost as though we’re witnessing a veritable bandwagon of gold nay-sayers. I suspect that some of this is a matter of “sour grapes” on the part of those who missed out on the tremendous 12-year bull market in gold. And so it goes, to the gold pessimists goes a belated, sour grapes sneer.
Could this be the gold bottom? Based on RSI gold is oversold. The histograms on MACD are turning up. And we have a little up-pointing formation in March. Could it be a bottom? It would require gold hitting 1620 for a major reversal. Gold above 1600 would be impressive!

Ed Note: Two very valuable articles from the Godfather of Newsletter writers:
Subscribe to Richards Daily Newsletter HERE
About Richard Russell
Russell began publishing Dow Theory Letters in 1958, and he has been writing the Letters ever since (never once having skipped a Letter). Dow Theory Letters is the oldest service continuously written by one person in the business.
Russell gained wide recognition via a series of over 30 Dow Theory and technical articles that he wrote for Barron’s during the late-’50s through the ’90s. Through Barron’s and via word of mouth, he gained a wide following. Russell was the first (in 1960) to recommend gold stocks. He called the top of the 1949-’66 bull market. And almost to the day he called the bottom of the great 1972-’74 bear market, and the beginning of the great bull market which started in December 1974.
The Letters, published every three weeks, cover the US stock market, foreign markets, bonds, precious metals, commodities, economics –plus Russell’s widely-followed comments and observations and stock market philosophy.
In 1989 Russell took over Julian Snyder’s well-known advisory service, “International Moneyline”, a service which Mr. Synder ran from Switzerland. Then, in 1998 Russell took over the Zweig Forecast from famed market analyst, Martin Zweig. Russell has written articles and been quoted in such publications as Bloomberg magazine, Barron’s, Time, Newsweek, Money Magazine, the Wall Street Journal, the New York Times, Reuters, and others. Subscribers to Dow Theory Letters number over 12,000, hailing from all 50 states and dozens of overseas counties.
A native New Yorker (born in 1924) Russell has lived through depressions and booms, through good times and bad, through war and peace. He was educated at Rutgers and received his BA at NYU. Russell flew as a combat bombardier on B-25 Mitchell Bombers with the 12th Air Force during World War II.
One of the favorite features of the Letter is Russell’s daily Primary Trend Index (PTI), which is a proprietary index which has been included in the Letters since 1971. The PTI has been an amazingly accurate and useful guide to the trend of the market, and it often actually differs with Russell’s opinions. But Russell always defers to his PTI. Says Russell, “The PTI is a lot smarter than I am. It’s a great ego-deflator, as far as I’m concerned, and I’ve learned never to fight it.”
Letters are published and mailed every three weeks. We offer a TRIAL (two consecutive up-to-date issues) for $1.00 (same price that was originally charged in 1958). Trials, please one time only. Mail your $1.00 check to: Dow Theory Letters, PO Box 1759, La Jolla, CA 92038 (annual cost of a subscription is $300, tax deductible if ordered through your business).
IMPORTANT: As an added plus for subscribers, the latest Primary Trend Index (PTI) figure for the day will be posted on our web site — posting will take place a few hours after the close of the market. Also included will be Russell’s comments and observations on the day’s action along with critical market data. Each subscriber will be issued a private user name and password for entrance to the members area of the website.
Investors Intelligence is the organization that monitors almost ALL market letters and then releases their widely-followed “percentage of bullish or bearish advisory services.” This is what Investors Intelligence says about Richard Russell’s Dow Theory Letters: “Richard Russell is by far the most interesting writer of all the services we get.” Feb. 19, 1999.
Below are two of the most widely read articles published by Dow Theory Letters over the past 40 years. Request for these pieces have been received from dozens of organizations. Click on the titles to read the articles.
“Rich Man, Poor Man (The Power of Compounding)“


-
I know Mike is a very solid investor and respect his opinions very much. So if he says pay attention to this or that - I will.
~ Dale G.
-
I've started managing my own investments so view Michael's site as a one-stop shop from which to get information and perspectives.
~ Dave E.
-
Michael offers easy reading, honest, common sense information that anyone can use in a practical manner.
~ der_al.
-
A sane voice in a scrambled investment world.
~ Ed R.
Inside Edge Pro Contributors

Greg Weldon

Josef Schachter

Tyler Bollhorn

Ryan Irvine

Paul Beattie

Martin Straith

Patrick Ceresna

Mark Leibovit

James Thorne

Victor Adair