Index futures moved higher following release of the U.S. employment report at 8:30 AM EST. Consesnsus for February Non-farm Payrolls was 165,000 versus 157,000 in January. Actual was an increase of 236,000. However, January was adjusted to 119,000 from 157,000. Consensus for February Private Non-farm Payrolls was 178,000 versus 166,000. Actual was 246,000 versus an adjusted 140,000 in January. Consensus for the February Unemployment Rate was 7.9% versus 7.9% in January. Actual was a decline to 7.7%. Consensus for February Hourly Earnings was a gain of 0.2% versus an increase in 0.2% in January. Actual was a gain of 0.2%.
Canada’s February Employment report was brighter than the U.S. employment report. Consensus for February employment was an increase of 8,000 versus a decline of 21,900 in January. Actual was an increase of 50,700.
Canada’s Housing Starts in February were better than expected. Consensus was 174,000 versus 160,600 in January. Actual was 188,719.
Hecla Mining added $0.10 to $4.18 after Global Hunter upgraded the stock from Neutral to Buy.
Tiffany fell $0.88 to $70.00 after Canaccord downgraded the stock from Hold to Sell.
Mark Leibovit on Bloomberg Radio
Following is a link to yesterday’s interview:
http://www.vrtrader.com/files/BloombergwithPimmFoxMarch72013.mp3
Interesting Charts
The energy sector finally woke up yesterday after significantly underperforming the market during the past four weeks.
The Money Center ETF broke to a new high yesterday prior to release of stress tests by the Federal Reserve on the top 18 U.S. financial institutions. All except Allied Financial past the test. Traders are expected several of the Money Center banks to respond by increasing their dividend shortly.

Updates on Sector Seasonal Trades
Seasonal trades optimally have a technical score of 3 based on (1) uptrend, (2) trading above its 20 day moving average and (3) outperforming the market (S&P 500 for U.S. holdings, TSX for Canadian holdings). Scores moving lower than 3 are warnings signs. A score of 0-0.5 is a sell signal. The following seasonal trades have a technical score of 1.0 or higher and are in their period of seasonal strength. Their retention is recommended.
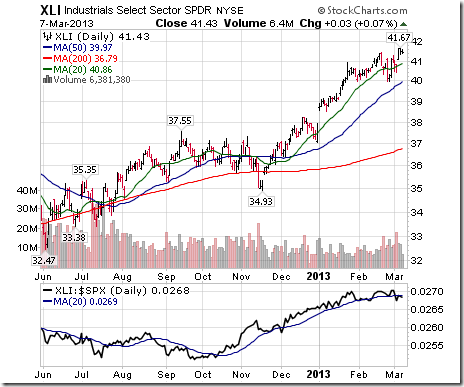
Technical score for Industrial SPDRs changed from 3.0 to 2.5 when strength relative to the S&P 500 Index changed from positive to neutral. Seasonal influences are positive until early May.
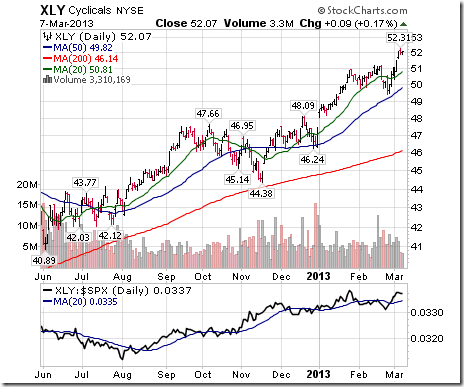
Technical score for Consumer Discretionary SPDRs changed from 2.5 to 3.0 after units broke above resistance at $51.23. Seasonal influences are positive until mid-April.
Technical score on Retail SPDRs increased to 1.5 to 2.5 when units moved above their 20 day moving average. Seasonal influences are positive until mid-April.

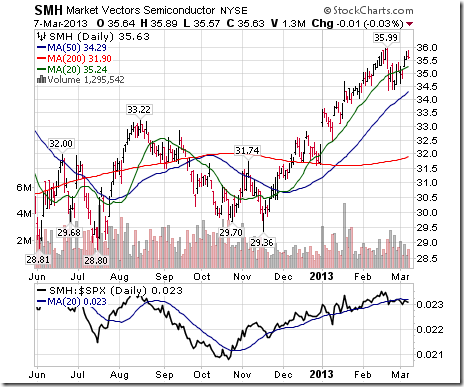
Technical score for the Semiconductor ETF remains unchanged at 2.0. However, the period of seasonal strength on average closes today. Take profit
Technical score for Palladium increased from 1.0 to 2.0 on a move above its 20 day moving average. Seasonal influences are positive until the end of April.
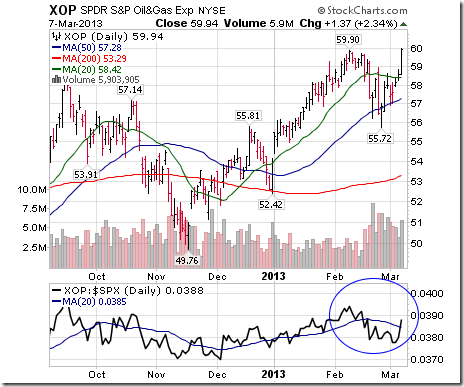
Technical score for the Oil & Gas Oil and Gas Exploration ETF increase from 1.0 to 2.5 on a move above its 20 day moving average, a break above resistance at $59.90 and an improvement by relative strength from negative to neutral. Seasonal influences are positive until mid-April.
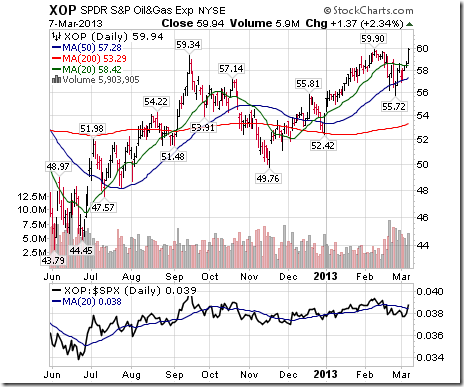
Technical score by Energy SPDRs increased to 2.0 from 1.0 when units moved above their 20 day moving average. Seasonal influences are positive until the end of April.
Technical score by Gasoline remains unchanged at 1.0. Seasonal influences are positive until the end of April.

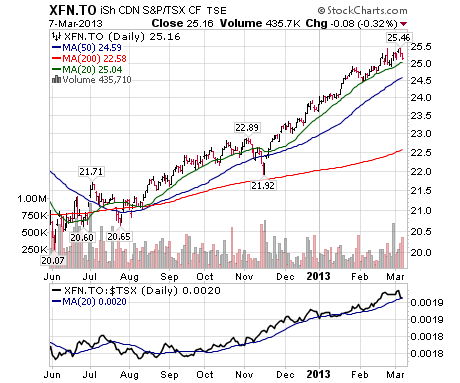
Technical score for the TSX Financial Services ETF remains unchanged at 3.0. Seasonal influences are positive until mid-April.
Special Free Services available through www.equityclock.com
Equityclock.com is offering free access to a data base showing seasonal studies on individual stocks and sectors. The data base holds seasonality studies on over 1000 big and moderate cap securities and indices. Notice that most of the seasonality charts have been updated recently.
To login, simply go to http://www.equityclock.com/charts/
Following is an example:
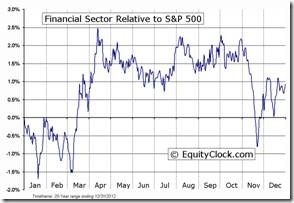
Financial Sector Seasonal Chart

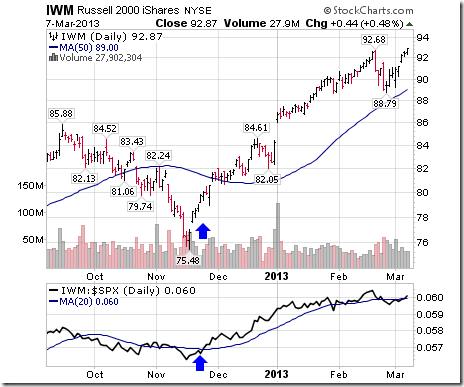
An Update on the U.S. Small Cap sector/market
According to Thackray’s 2013 Investor’s Guide, the period of seasonal strength for the U.S. small cap sector is from December 19thto March 7th. This year the technical clicked in earlier than usual. Units moved above their 20 day moving average and began to outperform the S&P 500 Index in late November. Since then, units significantly outperformed the S&P 500 Index. However, units currently have returned to neutral relative to the S&P 500 Index and the period of seasonal strength has ended. Nice trade! Take seasonal profits.