
Gold & Precious Metals

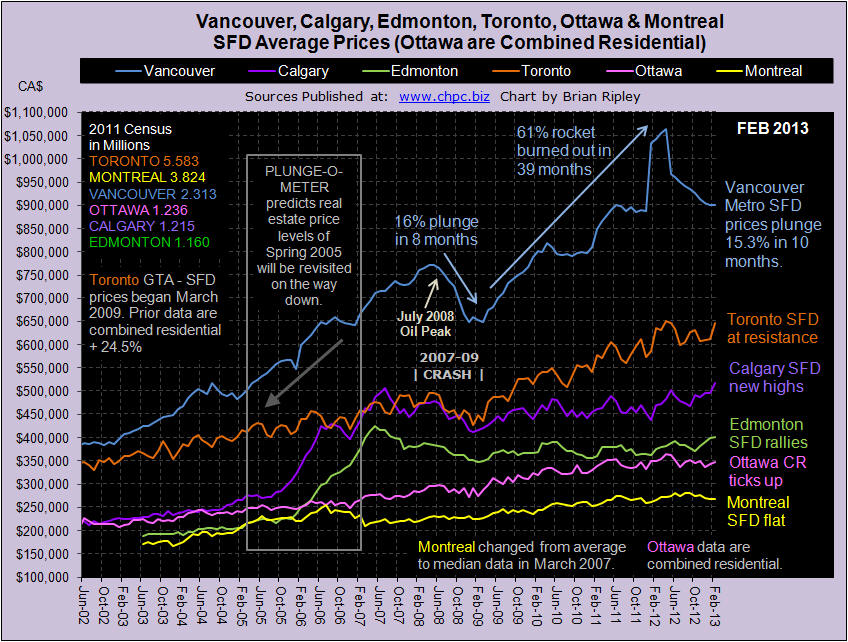
At the turn of the year I gave the trophy to Alberta as the best place to get a paycheck, and to Calgary as the best comeback in real estate. Two months later after peaking 68 months ago (June 2007), Calgary average SFD prices have broken out with a new record high price backed up by townhouse prices also busting out to new highs.
The momentum chart has Calgary SFD prices heading towards Extreme Enthusiasm territory with a Y/Y price increase at 10.3%. I have now set up a separate chart to track Calgary SFD, Townhouse and Condo average prices.
Summary of Housing Price Changes for Major Canadian Cities February 2013
Calgary and Toronto pushed average townhouse prices to new highs and SFDs in Calgary reached a new peak price not seen since June 2007.
VANCOUVER average single family detached prices in February 2013 stopped falling for the first time in ten months and ticked up 0.1% M/M but are 13.6% down Y/Y and remain 15.3% (or $163,300) below their peak set back in April 2012. This compares to the 2007-09 crash of 15.4% and a loss of $163,800 (Vancouver Chart). At the “low end” buyers stepped in and townhouse and condo apartments ticked up 1.2% and 06% M/M. Combined residential sales zoomed 33% M/M, but are down nearly 30% Y/Y even with the supply of listings down 13.2% Y/Y (Scorecard).
Now that you have the February data, where do you think Vancouver SFD prices will be one year hence? VOTE HERE.
CALGARY average detached house prices in February 2013 busted out to new highs as did townhouse prices. I have added a new dedicated Calgary Chart to track this market. Combined residential sales are up 39.1% M/M and only down 1.2% Y/Y (Scorecard). On themomentum chart, SFD prices are gushing up towards extreme enthusiasm well off the flat line of a year ago.
The sentiment in Calgary is the least bearish of the 3 markets polled; almost as many readers think prices will remain where they are as readers who think they will drop 20%. What’s your opinion? VOTE HERE.
EDMONTON average detached house prices in February 2013 also rallied with Calgary and added another 0.3% M/M gain (Canada Chart). Combined residential prices were up 4.3% M/M with average condo prices zooming 7.3% M/M. Combined residential sales and inventory were both up double digits M/M but are also both down double digits Y/Y (Scorecard). The record high SFD prices of May 2007 are now only 5.9% away on this latest surge (Plunge-O-Meter).
TORONTO average detached house prices for the GTA in February 2013 zoomed 5.8% M/M while townhouse prices broke out to a new record high (Toronto Housing Chart). SFD prices are now only 0.4% below their April 2012 peak and the only thing holding back new highs is a growing inventory (Scorecard) and slumping momentum. The gap between Vancouver and Toronto housing prices (Vancouver vs Toronto) is narrowing.
Polled sentiment continues to suggest that prices will be down another 20% in 12 months. What do you think? VOTE HERE.
OTTAWA average detached house prices are not available, instead the chart on this site reflects Ottawa’s average combined residential prices. OREB’s report is sparse and opaque and the CMHC, records for Ottawa inventory remain one month lagging. In February 2013 Ottawa combined residential prices ticked up only 1.3% M/M on a 51.8% M/M sales surge, but sales are still down 9.4% Y/Y (Scorecard). It’s been 10 months since prices peaked in Ottawa and they remain 4.8% below the highs (Plunge-O-Meter).
MONTREAL median (not average) detached house prices in January 2013 (I WILL POST FEBRUARY DATA WHEN I GET IT; MONTREAL IS USUALLY LATE) dropped another 1.1% M/M and remain at the lower end of the price range 4.3% below the all time high price set in June 2012 (Canada Chart). Prices are floating on sales resistance (Scorecard) with combined residential sales 14.9% below last year. In the 2011 Census, Montreal added 6.4% more dwelling units while only adding 5.2% more people. There is no shortage of housing, but there is a shortage of earnings; the Province of Quebec ranks 6th in Canada’s 10 provinces for earnings.
….much more below:
13 Charts on housing and related markets
Plunge-O-Meter and Canadian Earnings
Demographia and Census data.

As a general rule, the most successful man in life is the man who has the best information
The Dow on Gold’s terms:
– During January 2000 gold traded at an average price of $284.32
– January 2000 the Dow was 10,900
– 10,900/$284.32 per ounce = 38.33 gold ounces to buy the Dow
Today gold is trading at $1570.90 while the Dow Jones (DJIA) continues to break records, up another 30 points as I write to 14,284.
14,284/1570.90 = 9.09 ozs of gold to buy the Dow today.
38.33/9.09 = 4.2

The Dow on Silver’s terms:
– During January 2000 silver averaged $4.95 oz
– January 2000 the Dow was 10,900
– 10,900/$4.95 per ounce = 2202 silver ounces to buy the Dow
Today silver is trading at $28.62, the Dow is 14,284.
14,284/28.62 = 499 ozs silver to buy the Dow.
2202/499 = 4.4

The Dow has gone up roughly, and only, 3400 points since January 2000.
Gold, during the same period, has gone from an average of $284 to $1570.90 ($1570.90/$284 = 5.5x) while silver has gone from an average of $4.95 to $28.62 ($28.62/$4.95 = 5.7x) per oz.
In January 2000 the gold/silver ratio was $284.32/$4.95 = 57.43
Today, as I calculate these numbers, gold is $1570.90 oz while silver is $28.62 oz for a gold/silver ratio of 54.88.
Silver, a.k.a. ‘poor man’s gold’ trades in lockstep with gold – from a ratio of 57.4 in 2000 to a ratio of 54.8 today some 13 years later who can argue?
Joe and Suzie on Gold’s Terms

Today’s home prices are lower than they were during the Great Depression and are approaching their all-time lows.
“At first, the drop in the dollar simply offset the apparent rise in home prices, and prices in gold worked sideways until 2006. But when home prices began to fall in dollar terms, and dollars were themselves falling in value, the double-whammy pushed true home prices down to levels not seen since the late 1980s. In fact, they set a new record, the lowest level since the index was first published. This means that most homes purchased in the last 20 years are now worth less than the original purchase price, even if they show gains of 100%, 200%, or more, in dollar terms.” pricedingold.com
The average U.S. worker earned $13.75 an hour in January of 2000. As we already know the price of an ounce of gold averaged $284.
The average worker would have had to work 20.65 hours ($284/$13.75) to buy an oz of gold in January, 2000.
Today the average U.S. workers wage is $19.77 and gold is $1570.90 oz – the average working Joe/Suzie would have to work 79.45 hours to buy an oz.
Consider:
- Global conflicts are intensifying and raising already considerable tension levels.
- Zero interest rates, global quantitative easing and escalating currency wars – an international race to worthless that ends with everyone a loser and leads to a rise in protectionism and future trade wars
After mulling over all that’s happening in the world today ask yourself “what chance does Joe and Suzie have of buying gold and silver cheaper in the future than now?”
Conclusion
Buying some gold and silver should be on everyone’s radar screens. Is it on your screen?
If not, maybe buying either, or both, should be.
Richard (Rick) Mills
Richard is the owner of Aheadoftheherd.com and invests in the junior resource/bio-tech sectors. His articles have been published on over 400 websites, including:
WallStreetJournal, USAToday, NationalPost, Lewrockwell, MontrealGazette, VancouverSun, CBSnews, HuffingtonPost, Londonthenews, Wealthwire, CalgaryHerald, Forbes, Dallasnews, SGTReport, Vantagewire, Indiatimes, ninemsn, ibtimes and the Association of Mining Analysts.
If you’re interested in learning more about the junior resource and bio-med sectors, and quality individual company’s within these sectors, please come and visit us atwww.aheadoftheherd.com
***
Legal Notice / Disclaimer
This document is not and should not be construed as an offer to sell or the solicitation of an offer to purchase or subscribe for any investment.
Richard Mills has based this document on information obtained from sources he believes to be reliable but which has not been independently verified.
Richard Mills makes no guarantee, representation or warranty and accepts no responsibility or liability as to its accuracy or completeness. Expressions of opinion are those of Richard Mills only and are subject to change without notice. Richard Mills assumes no warranty, liability or guarantee for the current relevance, correctness or completeness of any information provided within this Report and will not be held liable for the consequence of reliance upon any opinion or statement contained herein or any omission.
Furthermore, I, Richard Mills, assume no liability for any direct or indirect loss or damage or, in particular, for lost profit, which you may incur as a result of the use and existence of the information provided within this Report.

 Today one of the wealthiest people in the financial world spoke with King World News about the shocking things that he witnessed at PDAC, and how the biggest money on the planet is now looking to get into the gold and silver sector. Regarding PDAC he stated, “What was of interest to me was the level of panic present at the place.” Rule also let KWN readers know invest to make fortunes right now in the gold and silver markets.
Here is what Rick Rule, who is the CEO of Sprott USA, had to say about creating great wealth: “The opportunities that are in front of me are so fantastic that it’s hard to focus. I am still interested in the developmental stage juniors, the ones that are financially accretive. I am also focused on explaining to investors that the pullback in bullion prices, never mind the bullion related equities, is a sale.”
…..Rick Rule continues HERE

 But how do we know when irrational exuberance has unduly escalated asset values?
Into this academic but high-staked market fog has stepped another Fed official, this time not a Chairman but a relatively new yet similarly quizzical Governor. Jeremy Stein’s February 2013 speech has not gained the attention that Chairman Greenspan’s did, but it is remarkably similar in its intent and initial question: Governor Stein asks, “What factors lead to overheating episodes in credit markets?… Why is it that sometimes, things get out of balance?” Without mimicking Chairman Greenspan’s phrase, Governor Stein renews the quest, asking nearly a decade and a half later, “How do we know when irrational exuberance has unduly escalated asset values?”
I suppose it’s fair to criticize both queries on two grounds: 1) Although asked by Chairman Greenspan, it was never really answered in the 1996 speech. 2) If the Fed’s so smart, why are some of us still poor? Why did our 401(k)s become 201(k)s in 2009 before recovering to near peak levels currently? If they’re so smart, why the roller coaster ride, the 30% decline in home prices since 2006, and our current 7.9% unemployment rate?
Well to answer for the absent Chairman and the necessarily silent Governor Stein, the Fed incorrectly assumed that as long as inflation was benign, and future productivity prospects were near historical proportions, then asset price exuberance was an indirect and much less significant influence on economic growth. The Chairman admitted as much in a public “mea culpa” several years ago. We’re not that smart, he seemed to intone. Sometimes we make mistakes. I’m with you there, Mr. Chairman. Sometimes we all do.
So let’s approach this new paper with eyes wide open and pant bottoms close to those mythical musical chairs. Governor Stein’s speech reflects importantly on the answer to the question asked by a recent Wall Street Journal headline: “Is (the) Bull Sprint Becoming a Marathon?” Is there indeed “A Boom Time” in markets as the Financial Times queried on the heels of Dell, Virgin Media, and then HJ Heinz?
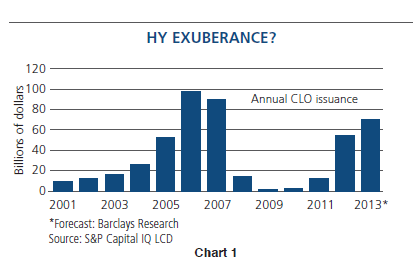
Governor Stein, as does PIMCO, suggests caution. On a scale of 1-10 measuring asset price “irrationality”, we are probably at a 6 and moving in an upward direction.Admittedly, Stein never ventures into the netherworld of stock market prices or leveraged buyouts. He appears to know better. What he does stake claim to however is a thesis for high yield spreads with the implication that other credit markets bear similar consequences. His initial starting point is that the pricing of credit is primarily an institutional as opposed to a household decision making process. Individuals may become unduly irrational when it comes to buying high yield ETFs or mutual funds, but it is the banks, insurance companies and pension funds, to name the most dominant, that influence the price of credit – high yield bonds – and by osmosis, investment grade corporates, municipals, and other non-Treasury risk credit assets. From this initial premise, he then points to recent research by Harvard’s Robin Greenwood and Samuel Hanson that suggests that while credit spreads are helpful future guides, that a non-price measure – the new issue volume (and perhaps quality) of high yield bonds – is a more trustworthy input. To quote: “When the high-yield share (of issuance) is elevated, future returns on corporate credit tend to be low.” And because of financial innovation and easier regulatory changes, institutional buyers such as banks, insurance companies and pension funds tend to match the mountains of issuance with an exuberance that eventually can be labeled irrational. Stein’s bottomline is that recent evidence suggests that we are seeing a “fairly significant pattern of reaching-for-yield behavior emerging in corporate credit.” In fact, investors bought over $100 billion of high yield and levered loan paper last year, a record level even exceeding the ominous levels in 2006 and 2007. Shown below in Chart 1 is a history of CLO issuance, admittedly a subset of high yield, but one which illustrates the supply pattern Governor Stein is leery of.
Now at this point, I suppose readers expect yours truly to jump all over the Governor’s speech/premise and to advance my own more learned thesis. Not really. With previously expressed reservations about the prescience of the Fed (or any of us!) I applaud his attempt to answer the initial 1996 question. I think Governor Stein’s speech was a little uni-dimensional, and a little too supply and model driven as opposed to behaviorally influenced, but I liked it, and PIMCO agrees with its conclusion. Corporate credit and high yield bonds are somewhat exuberantly and irrationally priced. Spreads are tight, corporate profit margins are at record peaks with room to fall, and the economy is still fragile. Still that doesn’t mean you should vacate your portfolio of them. It just implies that recent double-digit returns are unlikely to be replicated and that when today’s 5-6% high yield interest rates are adjusted for future defaults and recovery values, that 3-4% realized returns are the likely outcome. Just this past week the Financial Times reported that global corporate default rates are inching higher just as companies with fragile balance sheets sell large amounts of debt. Don’t say Governor Stein didn’t warn you.
But I would step now into the forbidden territory of equity pricing by presenting additional historical correlations compiled by Jim Bianco of Bianco Research – admittedly not a thickly populated academically staffed organization like the Fed, but a well-regarded one nonetheless. He points out in a recent daily release that high yield and corporate bonds are really just low beta equivalents of stocks. It appears that they are. The following charts show a rather commonsensical negative correlation of high yield spreads (and therefore future high yield returns) to stock prices.
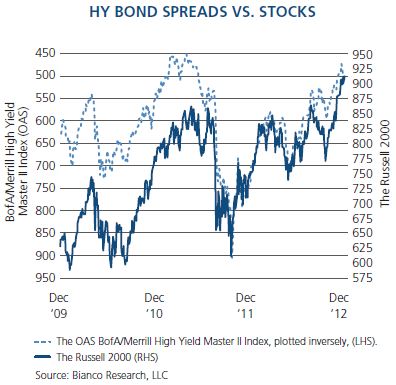
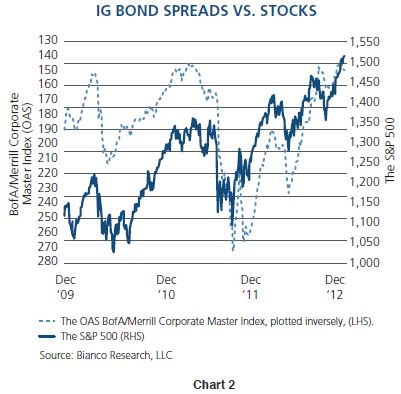
The conclusion would be that where high yield prices go, stock markets follow, or vice versa. Narrow yield spreads in high yield credit markets appear to be accompanied by “narrow” equity risk premiums in the market for stocks, which is another way of saying that the course of future equity returns may not resemble its recent exuberant past. 3-4% high yield returns over the next few years? Why shouldn’t that logically lead to a generalized 5-6% return forecast for stocks? Admittedly, returns for both high yield and equity markets have been unduly influenced in the past few years by Quantitative Easing, the writing of trillions of dollars of Federal Reserve checks and the exuberant migration of institutions and households alike to the grassier plains of risk assets dependent on favorable economic outcomes. It is what central banks encourage and to date it has been successful. If and when that support dissipates or if the economy remains anemic, investors should be cautious and temper their enthusiasm.
PIMCO’s and Governor Stein’s “rational temperance,” in contrast to excessive historical bouts of “irrational exuberance,” simply counsels to lower return expectations, not to abandon ship. PIMCO is a global investment manager – not one with a perpetual frown or even an ever-present half empty glass – but one which hopes to provide alpha and above market returns while still standing tall in the aftermath of future irrational bouts of exuberance. We join with Governor Stein and perhaps Alan Greenspan in encouraging not an exit but a reduced expectation. Credit spreads nor interest rates cannot be artificially compressed forever, nor can stock prices rise perpetually on their coattails. Be rational, be optimistic if so inclined, but temper it with a commonsensical conclusion that we have seen something similar to this before, and that previous outcomes seldom matched the exuberance.
IO Speed read:
1) Chairman Greenspan’s “irrational exuberance” speech in 1996 posed an excellent question, and history provided the answer.
2) Fed Governor Jeremy Stein asks the same question in 2013 with a uni-dimensional but useful model.
3) Stein’s paper, accompanied by correlations from Bianco Research, suggests caution in today’s high yield market.
4) High yield bonds, stock prices and other risk spreads move in relative tandem.
5) PIMCO cautions “rational temperance”: be bullish if you want, but lower return expectations on all asset classes.
Mr. Gross is a founder, managing director and co-CIO of PIMCO based in the Newport Beach office. He has been with PIMCO since he co-founded the firm in 1971 and oversees the management of more than $1.9 trillion of securities. He is the author of numerous articles on the bond market, as well as the book, “Everything You’ve Heard About Investing is Wrong,” published in 1997. Among the awards he has received, Morningstar named Mr. Gross and his investment team Fixed Income Manager of the Decade for 2000-2009 and Fixed Income Manager of the Year for 1998, 2000, and 2007 (the first three-time recipient). He received the Bond Market Association’s Distinguished Service Award in 2000 and became the first portfolio manager inducted into the Fixed Income Analysts Society’s hall of fame in 1996. Mr. Gross is a seven-time Barron’s Roundtable panelist (2005-2011), appearing in the annual issue featuring the industry’s top investment experts, and he received the Money Management Lifetime Achievement Award from Institutional Investor magazine in 2011. In a survey conducted by Pensions and Investments magazine in 1993, he was recognized by his peers as the most influential authority on the bond market in the U.S. He has 43 years of investment experience and holds an MBA from the Anderson School of Management at the University of California, Los Angeles. He received his undergraduate degree from Duke University.
The BofA Merrill Lynch High Yield Master II Index is an unmanaged index consisting of U.S. dollar denominated bonds that are rated BB1/BB+ or lower, but not currently in default. BofA Merrill Lynch Corporate Master Index is an unmanaged index comprised of approximately 4,256 corporate debt obligations rated BBB or better. These quality parameters are based on composites of ratings assigned by Standard and Poor’s Ratings Group and Moody’s Investors Service, Inc. Only bonds with minimum maturity of one year are included. The Russell 2000 Index is an unmanaged index generally representative of the 2,000 smallest companies in the Russell 3000 Index, which represents approximately 10% of the total market capitalization of the Russell 3000 Index. The S&P 500 Index is an unmanaged market index generally considered representative of the stock market as a whole. The index focuses on the Large-Cap segment of the U.S. equities market. It is not possible to invest directly in an unmanaged index.
This material contains the current opinions of the author but not necessarily those of PIMCO and such opinions are subject to change without notice. This material is distributed for informational purposes only. Forecasts, estimates, and certain information contained herein are based upon proprietary research and should not be considered as investment advice or a recommendation of any particular security, strategy or investment product. Information contained herein has been obtained from sources believed to be reliable, but not guaranteed. No part of this article may be reproduced in any form, or referred to in any other publication, without express written permission. PIMCO and YOUR GLOBAL INVESTMENT AUTHORITY are trademarks or registered trademarks of Allianz Asset Management of America L.P. and Pacific Investment Management Company LLC, respectively, in the United States and throughout the world. ©2013, PIMCO.

-
I know Mike is a very solid investor and respect his opinions very much. So if he says pay attention to this or that - I will.
~ Dale G.
-
I've started managing my own investments so view Michael's site as a one-stop shop from which to get information and perspectives.
~ Dave E.
-
Michael offers easy reading, honest, common sense information that anyone can use in a practical manner.
~ der_al.
-
A sane voice in a scrambled investment world.
~ Ed R.
Inside Edge Pro Contributors

Greg Weldon

Josef Schachter

Tyler Bollhorn

Ryan Irvine

Paul Beattie

Martin Straith

Patrick Ceresna

Mark Leibovit

James Thorne

Victor Adair