
Gold & Precious Metals
After averaging a record $1,669 an ounce in 2012, Bloomberg notes that gold is off to its worst start since 1988.
But that’s nothing compared to what’s happened to gold miners…
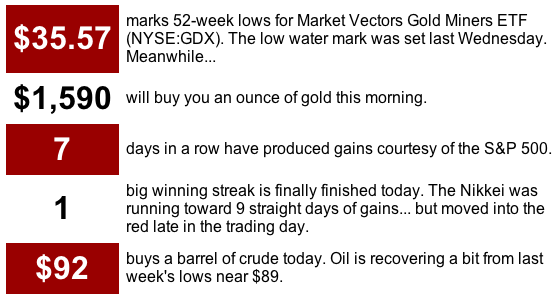
Mining stocks are having a no-good, horrible year. Prices of gold miners have fallen further and faster than physical gold in 2013, widening a performance gap nearly two years in the making. The Market Vectors Gold Miners ETF (NYSE:GDX) has shed more than 30% since mid-September. Over the same timeframe, spot gold has only dropped about 11%.
But that could all be changing soon.
Gold mining stocks are once again beginning to show subtle signs of life. And while price hasn’t risen too dramatically, other clues suggest the painful slump could finally end.
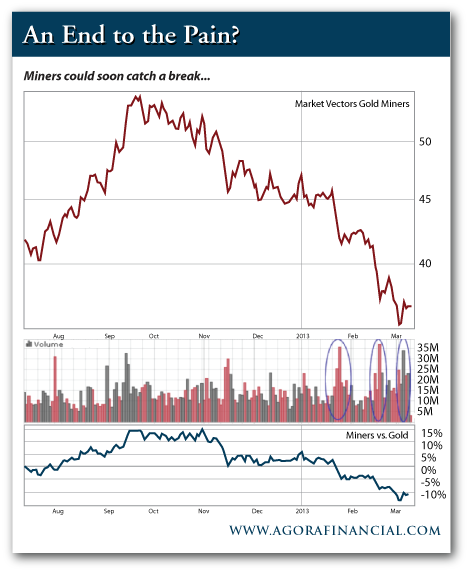
Take a look at the sharp declines GDX posted in January and February. Both of these powerful downside moves were accompanied by big volume. Complete capitulation was on full display during the January breakdown below $45 and the February crack of $40. Sellers clearly wanted out at any price.
But just when everyone was ready to bury miners for good, signs of a potential bottom began to emerge. Last week, after holding about $36 for two straight days, GDX opened at its low–then surged higher. Strong volume rushed in, chasing the price back above $37. That’s the first time during this six month drop where strong volume has accompanied a move higher.
If you’re looking for long-term buying opportunities in mining stocks, watch for GDX to hold $37 as it consolidates last week’s move off its lows. Then, you’ll need price to confirm that a bottom is in place. Once GDX is back above $40, you’ll have a perfect low-risk entry point.
Rude Numbers: Targets, Predictions and Wild Guesses
Rude Trends: When to Buy… When to Sell
“I’ve been hearing that some pros are concerned because the ‘dumb money’ is rushing into the market, citing big inflows into stock ETFs and mutual funds,” writes an alert reader…
“However, two recent surveys on Yahoo! Finance caught my eye. One was last week as the Dow was knocking on the all-time high door. It was something like: with the market near all-time highs, what are you doing with your money?
“42% of the responses were ‘I’m still waiting to get in.’
“The other survey was maybe a month ago, with very similar results, 41% of responses were ‘still waiting to get in’…
These are obviously not scientific surveys, but very interesting if that many folks are still watching and waiting.”
It is interesting… and understandable.
Yes, a lot of new money rushed into stocks to start the year. But that’s nothing compared to the $250 billion investors pulled from stock funds since early 2009.
Most people don’t trust this market–as evidenced by all these surveys you’re seeing. And my guess is that a majority of armchair investors won’t become comfortable buyers until their more adventurous neighbors start making money in the markets again.
Despite the fact that this bull cycle we’re experiencing is now 4 years old, we can still safely say few believe in stocks right now. The lost decade continues to weigh on everyone’s mind…
So your question got me thinking…
Why don’t I conduct my own survey?
Tell me… what are you doing with your money now that the Dow is posting new highs? You don’t need to get too specific– just tell me what your plans are. Are you buying stocks? Bonds? Gold? Or are you a seller? Or maybe–like most others–you’re still waiting it out. Tell me here: rude@agorafinancial.com
[Ed. Note: Don’t forget to follow me on Twitter: @GregGuenthner]
Ignore At Your Own Peril: Today’s Must-Read Links
- Discovered by accident: A chemical compound in tobacco that doctors are now recommending to slow aging!
- The Last Legal Currency Loophole in America
- Shocking gas price prediction released… Do this before gas hits $8 a gallon

 “Buy when there’s blood in the streets, even if the blood is your own.” – Baron Rothschild
This contradicts roots of basic human and animal nature, fight or flight.
Most of us think short term, smoke when we know it’s bad for us, eat junk food when we know we shouldn’t and make short term decisions on investing when we know there are long-term trends that are undeniable.
As far as I can see there are some strong arguments for macro trends that can’t be ignored… barring any material exogenous event. Populations are growing and people need more food, shelter, energy and clothing. Items that will be more valuable will be farmland, fertilizer, cheap energy, infrastructure and fibre to cloth these growing populations.
Economies in trouble, areas underserviced by infrastructure or job creation can offer opportunities for future growth and attractive government concessions or financing.
The Saudis just announced a renewable energy roadmap with plans to install 54 GW of renewable energy by 2032 including solar, wind, waste-to-energy and geothermal. The Saudis would end up being one of the largest green energy generators in the world. This irony is mindboggling.
Right now I am focussing on the long-term trend of increased future fibre needs;
- Increase in personal income and middle classes in China and India are driving food and fibre consumption

-
Food demand is projected to grow by 12% from 2010 to 2015, 24% by 2020 and is expected to reach 43% by 2030
-
Today there are over 1 billion undernourished people
-
Global consumption of meat has been growing much more rapidly than the consumption of grains and seeds. As the demand for meat rises, the demand for grain and protein feeds used to produce meat grows exponentially.


-
Production of natural fibers will remain constant or sink (Cotton for example has in the last sixty years fluctuated between 29 and 36 million hectares)
-
In the short term demand may be filled or exceeded, but long term Fiber requirements are projected to increase 20% by 2015, 40% by 2020 and 80% by 2030
-
Fiber consumption per capita has grown from 8.3 kg in 2000 to almost 12kg per capita per year in 2010
-
One third of the world’s population suffers from water shortage and is expected to grow to two thirds by 2025
-
Irrigated cotton grown in hot and dry environments requires 20-35 times more water than cellulose fibers
-
Some of the biggest environmental disasters were caused by “forcing” agriculture in less than idyllic locations. The Aral Sea in Kazakhstan formerly one of the four largest lakes in the world has mostly disappeared by using the water for irrigation over less than 20 years. Lake Chad is almost gone
Chad Wasilenkoff is the CEO of Fortress Paper, a TSX listed company with more than 700 employees in Europe and North America.

 Thomas Jefferson was opposed to a “national debt.” He thought it was immoral that one generation should spend on credit, forcing the next generation to pay the bill.
Jefferson knew what a burden debt could be — especially when it is debt for spending he didn’t enjoy himself. He had inherited debts from his father-in-law. You’ve heard of “something for nothing”? On the flip side is a second condition as disagreeable as the first is pleasant: nothing for something.
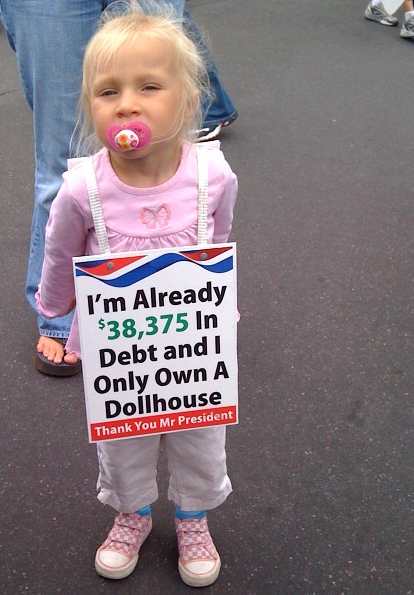
“Nothing for something” describes the financial situation of America’s youth. If things go according to plan, they will pay a large portion of their incomes (if they have incomes) to pay for social welfare “benefits” that they will never enjoy themselves.
Professor Laurence Kotlikoff of Boston University puts the total of U.S. government debt and unfunded pension and healthcare liabilities at $222 trillion. The biggest part of that money will be spent on the baby boomer generation… as it heads into retirement homes, nursing homes and hospitals. This is such a huge sum that it cannot be paid. But the burden of trying to pay it (and not succeeding) will fall heavily on younger generations.
Large debts also retard growth. This is the conclusion of professors Rogoff and Reinhart inThis Time It’s Different — their study of 800 years of financial folly. Much of current output must be used to pay for past consumption.
That is part of the reason that today’s growth rates are only about half of those in the 1960s and 1970s. Low growth means fewer new job opportunities. Those that do become available are generally at lower salaries. The real growth that doesn’t happen leads to the real jobs that will not be created and to the real careers your children and grandchildren may never have.
High debt levels also mean higher taxes. Taxes tend to be levied on earnings, not on pensions and healthcare consumption. You will see later in this week’s Outlook an estimate for how high taxes on young people would have to go (if it were possible) to finance this debt: about 80%.
Today, I take up the cause of our children and grandchildren. In the modern vernacular: They’re screwed.
Our job — and the job of the family offices we run — is to unscrew them. First, by trying to understand how the system works. And second, by setting up parallel or alternative systems of our own that help them protect themselves.
Nothing for Something
Let’s begin with the big picture. The economies of the U.S. and other modern, developed social welfare nations are based on several conceits and delusions.
Serious observers keep saying that if we continue doing what we’re doing bad things will happen “sooner or later.” We never know when sooner or later will get here. But it’s a fair bet that it will come during our children’s and grandchildren’s lives.
Remember Herb Stein’s law: Things we all know can’t last forever will come to a halt sometime. Most likely, it will be during the working careers of our children and grandchildren.
For example, the credit expansion that began after World War II had to end sooner or later. For the private sector, it ended in 2007. It almost ended, too, for many governments — such as Japan, Greece, Spain, California and others.
But large nations with their own printing presses are still going at it — with public debt-to-GDP ratios reaching up over 200% already. (If you included the aforementioned unfunded pension and health obligations, the ratio for the U.S. is already at nearly 1,400% and growing 20 times faster.)
The system of indirectly funding deficits through money printing (QE), while holding interest rates at the zero bound, will also have to end sooner or later. More alarmingly, the current system of fiat money is one for the record books. None has ever lasted this long. But it, too, will go away sooner or later.
So too will the system of intergenerational wealth transfers to fund health and retirement benefits. This system, developed in the 19th century, and brought into wide service in the 20th, was an illusion from the get-go.
In a stable society, the contributors — in the aggregate — can never get out of the system what they put in. Bureaucratically managed programs are too wasteful and beset by too much fraud. And it doesn’t really make sense for people to go along with a system where they get less out of it than they put in.
Nevertheless, there was — and still is — wide support for these programs. Why? Because people still expect to get “something for nothing” — or at least more than they put in. That has been the experience of the last 100 years.
Citizens were able to get more than they put in because the following generation was always bigger and richer — until now. Now, in the U.S., Japan and most of Europe, birthrates are so low that the native-born population is falling. And, for the first time in U.S. history, the next generation may actually be poorer than we are.
In other words, our children and grandchildren are getting a bum deal in more ways than one.
The short version of this story is simple: Old people vote. Politicians found they could be bribed. Promise them something they couldn’t get by honest labor — someone else’s money — and you are a shoo-in for elective office.
Year after year, the promises got to be more and more costly. How high have the promises gone? The median retiree has a total of about $120,000 in net savings. But he’ll consume about $275,000 worth of healthcare services before he finally adjourns. Who will pay the difference? Who bears the burden of this unfunded liability?
The Social Security Fund — which was the source of the phony “surpluses” of the Clinton era — is now in deficit. This year, it will pay out about $100 billion more than it takes in. That’s $100 billion more to retirees than working people contribute in Social Security tax payments. And the baby boomers have only just begun to retire!
Old people vote for higher Social Security payments. They vote for more healthcare. They vote for pills, wheelchair access and senior discounts. They vote for spending in the here and now… and a few brief tomorrows. As to the long term, it can take care of itself…
Editor’s note: I’ll share with you Part II of this report tomorrow. And here’s that link again, if you are interested in hearing more from Dad about preserving and growing family wealth.

The Dow Jones Industrial Average climbed a steep wall of worry and last Tuesday returned to its all-time high from late 2007. The Dow finished at 14253.77, topping the previous record set in October 2007 and is already up 8.8% for the year. The Fed’s expansive monetary policy to prop up the economy has kept stocks climbing higher despite a less than glowing global economy. By pumping trillions into the financial system, the Fed has convinced investors it will provide a safety net for future shocks. In addition, by keeping interest rates extremely low, the Fed is forcing investors to seek higher returns in the stock market.
The financial press is hailing it a historic day.
But we suggest stopping a moment before chilling the champagne. Despite reaching its all-time high, the stock market has provided investors with zip, zilch, zero return over the last five and one-half years. The Dow has just gotten back to where it was in October 2007 and many investors are still struggling to make up their losses after the credit crisis that erased $37 trillion from global equity values. When the housing bubble burst in 2008 the DOW plunged 34 percent in 2008 for the worst performance in 77 years.
During the five and a half year period since the crisis, gold has provided a return of approximately 119%.
We don’t mean to dump cold water on the celebration. We just want to keep things in perspective. Once we factor in inflation over the past few years, the all-time high looks less convincing. With consumer-price increases removed, the Dow has not been in real record territory in more than 13 years. A Wall Street Journal article contends that the last real, or inflation-adjusted, Dow record was on Jan. 14, 2000. Since then it looks like the Dow has risen 22% if you don’t take inflation into account. But if you do, Tuesday’s high is still more than 10% below that record.
Tuesday’s close is just 9256.38 once inflation is removed. That doesn’t even match the inflation-adjusted high of 10194.80 hit in 2007 – and we’re only taking the official inflation numbers into account here. And it is far from the real record of 10424.28 hit Jan. 14, 2000, according to calculations by Bespoke Investment Group.
Inflation is definitely something to take into account when investing to meet future needs. Central bankers can print all the fiat currency they like but they can’t manufacture gold. Its supply is more or less fixed (discoveries are made, but you can’t suddenly increase gold production by 500% and you can do that in case of fiat currencies). It cannot be inflated by central banks, which is why it is considered an inflation hedge and the ultimate alternative currency (or the only true one). The reason a glass of soda cost a penny in the beginning of the last century and now costs several dollars is not that soda water was cheaper then, but rather that the dollar had more value.
Some of the big hedge funds still are betting on the price of gold, even though a large number have sold most in the last quarter of 2012 (who knows if that happened in the past few weeks when volume was so high…), if not all, their shares in SPDR Gold Trust ETF (GLD -0.09%). Hedge fund manager John Paulson and his firm, Paulson & Co., remain solidly in the gold camp. Paulson continues to hold the largest position in GLD with nearly 22 million shares, worth an astonishing $3.344 billion.
Let’s see what’s next. We’ll start the technical part of today’s essay with the analysis of the USD Index medium-term chart (charts courtesy by http://stockcharts.com.)

The important thing to discuss here is the head-and-shoulders formation. This trading pattern has bearish implications for the USD Index and the question now is whether the formation is still present given the recent rally. We feel the answer is “yes”, because even though the index is now higher than the level of the left shoulder, the full formation is simply a bit skewed.
Local bottoms have been a bit higher each time so it is perhaps quite natural for the second shoulder to be above the first shoulder. Consequently, the formation could still be completed – though not yet – the other shoulder has yet to form. Declines in the index are needed for this to happen, and we feel this could still be seen.
Let’s take a look at the intermarket correlations to see how this rather bearish outlook for the dollar could translate into gold and silver prices.

The Correlation Matrix is a tool which we have developed to analyze the impact of the currency markets and the general stock market upon the precious metals sector, (namely: correlations between gold and other assets). The precious metals and the USD Index show a strong, negative correlation for the past 30 days. In the last several days however, gold prices did not continue their decline, that is, did not respond to the USD Index strength. This is a bullish combination and provides an indication that gold prices will rally if the dollar declines significantly (!). It also suggests that additional small (!) daily rally in the USD Index may not really hurt the price of gold (just like it was the case on Friday).
Speaking of gold, let’s take a look at the yellow metal from the long-term perspective. (click on chart below for larger image)

(click on chart above for larger image)
In this chart, very little change was seen, compared to two weeks ago. Gold’s price moved $0.10 higher last week, an increase of 0.01%, basically flat. With USD Index values moving up a bit last week, the situation isn’t all that bad here. It seems that gold prices bottomed in late February by correcting to the declining support line seen on the above chart.
RSI levels continue to describe the situation as very similar to 2008 when a major bottom formed. Back then, it took just a few months for gold to rally from about $700 an ounce to $1,000 an ounce. If a similar percentage increase is seen this year, gold could rally to $2,250 in just a few months (that’s not our official target, though). This appears possible based on the long-term cycles still present here as indicated by the vertical lines in our chart.
Summing up, although the cyclical turning point has passed for the USD, it still seems as though the index will soon reverse and move to the downside as it is now considerably overbought on a short-term basis. If the coming decline turns into a bigger one and the medium-term head-and-shoulders pattern is completed, it will likely translate into higher gold and silver prices. For now the bullish piece of information is that gold doesn’t seem to react to daily rallies in the USD Index.
Gold appears poised to move to the upside but the exact timing of such a move is still not crystal clear. Some indicators point to higher prices quite soon, there’s a possibility of a very sharp rally over the next few months, and it’s also possible that nothing major will happen for a week or two.
To make sure that you are notified once the new features are implemented, and get immediate access to our free thoughts on the market, including information not available publicly, we urge you to sign up for our free gold & silver newsletter. Sign up today and you’ll also get free, 7-day access to the Premium Sections on our website, including valuable tools and charts dedicated to serious Precious Metals Investors and Traders along with our 14 best gold investment practices. It’s free and you may unsubscribe at any time.
Thank you for reading. Have a great and profitable week!
Przemyslaw Radomski, CFA
Founder, Editor-in-chief
Gold Investments & Trading Sunshine Profits
* * * * *
About Sunshine Profits
Sunshine Profits enables anyone to forecast market changes with a level of accuracy that was once only available to closed-door institutions. It provides free trial access to its best investment tools (including lists of best gold stocks and silver stocks), proprietary gold & silver indicators, buy & sell signals, weekly newsletter, and more. Seeing is believing.
Disclaimer
All essays, research and information found above represent analyses and opinions of Przemyslaw Radomski, CFA and Sunshine Profits’ associates only. As such, it may prove wrong and be a subject to change without notice. Opinions and analyses were based on data available to authors of respective essays at the time of writing. Although the information provided above is based on careful research and sources that are believed to be accurate, Przemyslaw Radomski, CFA and his associates do not guarantee the accuracy or thoroughness of the data or information reported. The opinions published above are neither an offer nor a recommendation to purchase or sell any securities. Mr. Radomski is not a Registered Securities Advisor. By reading Przemyslaw Radomski’s, CFA reports you fully agree that he will not be held responsible or liable for any decisions you make regarding any information provided in these reports. Investing, trading and speculation in any financial markets may involve high risk of loss. Przemyslaw Radomski, CFA, Sunshine Profits’ employees and affiliates as well as members of their families may have a short or long position in any securities, including those mentioned in any of the reports or essays, and may make additional purchases and/or sales of those securities without notice.

 It was just about this time last year, in my columns inUncommon Wisdom, that I started warning …
![]() That we’d see a short-term rally in the dollar, mainly against the euro.
That we’d see a short-term rally in the dollar, mainly against the euro.
![]() That Europe would kick the sovereign debt can down the road.
That Europe would kick the sovereign debt can down the road.
![]() That the U.S. economy would start to look a bit better.
That the U.S. economy would start to look a bit better.
![]() That China would largely engineer a soft landing, and the yuan would appreciate.
That China would largely engineer a soft landing, and the yuan would appreciate.
![]() And that commodities would enter an interim period of disinflation.
And that commodities would enter an interim period of disinflation.
Let’s see how things have panned out so far …
U.S. Dollar Leaping Higher
Since March of last year, the U.S. dollar, judging by the U.S. Dollar Index that’s traded on the New York Board of Trade, has gained nearly 4 percent.
That’s not a lot. But the latest in the dollar is telling. It’s starting to rally strongly, mainly as the euro starts to tumble again due to Europe’s sovereign debt crisis.
 The dollar, on my system, has much more to go on the upside over the next few months, as Europe and Japan begin to devalue their currencies.
Mind you, currencies are a relative gain. The dollar is going to rally, but it too remains in a long-term bear market. It’s only a matter of time before the dollar succumbs to Fed money-printing and Washington’s fiscal follies.
As for Europe, it indeed did kick its sovereign debt can of worms down the road a bit over the past year. But the latest results and stalemate in the recent Italian elections has renewed Europe’s crisis, and now, the euro is plunging anew.
As to the U.S. economy, I said it would start looking better. And indeed, it has, with unemployment coming down a tad, corporate earnings surging, durable goods orders robust, and more.
But don’t kid yourself. The U.S. economy is improving a bit mainly because it’s bottom-bouncing and because Europe’s economy is looking so bad.
Don’t get too used to it, though. While there may be further improvement coming, I don’t think the U.S. economy will get back to where it was pre-financial crisis anytime soon, perhaps not even in my lifetime.
As for China, woe to all those China pundits who predicted a crash in China’s economy. It didn’t happen, and it won’t happen.
Instead, China’s economy put in a soft landing, and started taking off again, with full year 2012 GDP coming in at 7.8 percent.
What about the latest fears on China’s economy, due to Beijing clamping down in property speculation again?
No, China’s economy is not going to implode. It’s not even going to slow down. Beijing’s efforts to reign in property speculation are largely targeting second home purchases, not the entire property market. China’s economy is going to pick up further steam.
Commodities Hit Hard
Now, to that sector that we all love so much, commodities. Since my warnings of just about a year ago …
• Coffee prices have fallen a whopping 30.14 percent
• Cocoa prices are down 15.69 percent
• The price of sugar is down 21.78 percent
• Cattle prices are down 17.59 percent
• Copper is down 10.46 percent
• Platinum is down 8 percent
• Silver is down 16.89 percent
• Crude oil has fallen more than 19 percent
• Gold is down 9.23 percent
I say this not to boast, by any means, but to prove to you one major point: There can be big disinflationary waves in commodities, even when there’s massive money-printing going on.
Why’s that important? Because nine out of 10 investors (and analysts) think all too linearly about the markets.
They think that, if there’s money-printing happening, in any part of the developed world, it’s inflationary. And that commodity prices must therefore go up.
Not true. The markets are dynamic, complex systems. If you’re to get the big picture right, you simply have to throw out all of the old rules you’ve been taught or told — and stop thinking about the markets linearly.
Instead, you have to realize that markets can do anything at any time. They can defy linear logic … they can defy the fundamentals … they can defy the news. They can also defy the authorities.
Just consider gold. It’s down $343 since its record high of $1,925 in September 2011, a whopping 17.8 percent decline. This, despite massive European money-printing … continual bad news out of Europe … alleged buying of gold by Beijing and other central banks … money-printing in Japan …
And the biggest money-printing of all time by our own Federal Reserve!
Silver’s down even more — a whopping 41.1 percent since its high in April 2011!
Look. The markets take no prisoners. Be the least bit stubborn or biased, and the markets take your money.
That’s why I always stress being open-minded when it comes to markets and to investments and trading …
Why I always stress that you question everything and everyone, myself included.
And why I think it’s imperative that you throw all of the old rules out, and instead, think dynamically.
My Forecast for the Dow
Many readers have recently emailed me questioning my long-term forecast for the Dow, wondering how the heck the Dow Industrials could ever run to substantial new record highs if the U.S. economy is never going to fully recover and even lose its status as the world’s largest economy, falling behind China.
But here we are, at new record highs. My answer is the same as before. Just go back to the 1932 to 1937 period. The U.S. economy sank deeper and deeper into depression, yet the Dow Industrials soared 287 percent.
Why? Because even though the U.S. economy was sinking, Europe’s economy was sinking even more. Capital fled the European stock and bond markets in droves, pushing the Dow substantially higher.
The thing is, this time around, the flight of capital out of sovereign bond markets will be worse. Not only is Europe in trouble, so is Japan and the United States. Therefore, the gains in the Dow — despite the economy and what else you might throw at it — could soar even more.
What about the disinflation we’re seeing in commodities? It’s bound to continue. Right now, savvy money and investors want their capital out of bonds and into something that is more liquid than commodities, so they are putting their money largely to work in the equity markets, where they can buy great companies with great balance sheets, not to mention all the great income producing stocks out there.
Later, when the sovereign debt crisis fully infects Washington, you will see commodities bottom and stocks and commodities go up together hand-in-hand. Even if the economy looks bad, and even if interest rates are rising.
I’ll go on the record right now: We are now entering a period in the financial markets unlike anything we’ve seen before in our lifetime. One that will require new ways of thinking about the world.
Stay tuned …
Best wishes,
Larry
P.S. The March issue of my Real Wealth Report publishes this Friday. Don’t miss it! If you’re not a subscriber, simply click here now to join. At a mere $89 for an annual subscription, it’s a bargain

-
I know Mike is a very solid investor and respect his opinions very much. So if he says pay attention to this or that - I will.
~ Dale G.
-
I've started managing my own investments so view Michael's site as a one-stop shop from which to get information and perspectives.
~ Dave E.
-
Michael offers easy reading, honest, common sense information that anyone can use in a practical manner.
~ der_al.
-
A sane voice in a scrambled investment world.
~ Ed R.
Inside Edge Pro Contributors

Greg Weldon

Josef Schachter

Tyler Bollhorn

Ryan Irvine

Paul Beattie

Martin Straith

Patrick Ceresna

Mark Leibovit

James Thorne

Victor Adair