
Gold & Precious Metals

We have been writing about a bullish outlook for gold, silver and precious metals mining stocks for quite some time now, even though the seemingly bad situation in these markets. This opinion is based on a sound rationale (excellent fundamental situation for precious metals and extremely negative investors’ sentiment often seen at important turnarounds, among others) but we understand that it is still hard to be bullish, looking at the charts that have been full of moves down for the last couple of weeks. We have received an interesting question from one of our subscribers that shows one misconception (in our opinion) about what is needed for a rally in the yellow metal that we would like to comment on:
Q: Hello, “The fundamentals, such as open-ended QE, have been factored into prices. So ‘higher gold’ needs a new story. Investors are no longer excited about the QE story. If there is no other bullish story (how can a story be more bullish than open-ended QE?), the price of gold price will likely go lower.” Could you please comment on this? Thanks! Regards.
A: Yes.
The fundamentals, such as open-ended QE, have been factored into prices.
Yes, we can agree with that. The information has been around for a while, people are aware of that.
So, ‘higher gold’ needs a new story.
Here we disagree. If a story as bullish as open-ended QE doesn’t make gold go higher, then what story could? Maybe it’s not a new story that is necessary?
Investors are no longer excited about the QE story
Exactly. Investors are no longer excited (!) and that’s the whole point. Open-ended QE and other fundamental factors are positive. All that is missing is this “excitement.” This is another way of saying that the situation looks good but people just don’t want to buy because they are afraid of losing money. Is the fear really rational? If we agree that the fundamentals are positive, then it’s not rational – it’s purely emotional and caused by extensive consolidation.
If there is no other bullish story (how can a story be more bullish than open-ended QE?), the price of gold will likely go lower.
When the sentiment becomes extreme enough (extremely negative that is), we will see a turnaround even without an additional story. The fundamentals are already great. Now, a great story (Cyprus-led bank run?) could trigger the rally faster, but it’s not required for the gold market to move higher in our view.
What is exactly gold doing now? Let’s take a look (click on chart below or HERE for larger image)

Gold’s rally is finally visible here, and the RSI levels (based on weekly closing prices) reflect this as well. This indicator is back above the horizontal red line after staying below it for several weeks. This same action was seen back in 2008 and was quickly followed by a significant rally in gold prices. Back then, after the final bottom formed, gold moved to its previous high shortly.
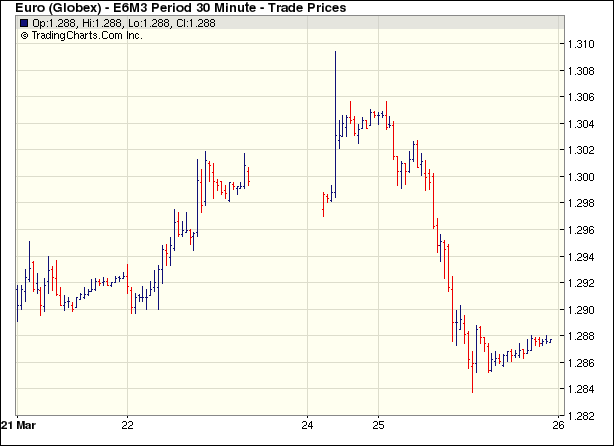
Last week we wrote about a small breakout in gold viewed from the euro perspective – let’s have a look at this chart to see how the situation progressed.
We saw a break above the declining resistance line early last week. The breakout has been confirmed in terms of range and time. Prices moved high enough to be visible in the long-term perspective and stayed above this line for three consecutive trading days. The situation here is very bullish.
Let us now move on to the chart that shows us the yellow metal’s performance from the general non-USD perspective (the average of gold priced in major currencies), as a similar situation to the above chart seems to have developed there. In short, the following chart represents and average of gold price from the previous chart and other non-USD ones.
Here we see what amounts to a small breakout so far. Prices are close to but slightly above the declining resistance line and have been there for three consecutive trading days. However, since this is a long-term chart, we prefer to see at least one weekly close above this line to say that the breakout is confirmed. In any case, the outlook has improved this week from a non-USD perspective. Actually, gold closed last week right at this line, but moved above it on Monday as gold didn’t do much from the USD perspective, but the USD Index rallied.
Summing up, gold recently broke above important resistance lines so when viewed from the euro perspective or when non-USD averages are taken into account, an already bullish situation has improved even further. Overall, the outlook remains bullish for gold and – as we’ve mentioned at the beginning of this essay – we don’t think that any breaking-news story is really needed to spark off the long-awaited rally in the yellow metal as the situation is already extreme. It could, however, cause the rally to start sooner.
Thank you for reading. Have a great and profitable week!
Przemyslaw Radomski, CFA
Founder, Editor-in-chief
Gold Investment & Gold Trading Website – sunshineprofits.com
* * * * *
Disclaimer
All essays, research and information found above represent analyses and opinions of Przemyslaw Radomski, CFA and Sunshine Profits’ associates only. As such, it may prove wrong and be a subject to change without notice. Opinions and analyses were based on data available to authors of respective essays at the time of writing. Although the information provided above is based on careful research and sources that are believed to be accurate, Przemyslaw Radomski, CFA and his associates do not guarantee the accuracy or thoroughness of the data or information reported. The opinions published above are neither an offer nor a recommendation to purchase or sell any securities. Mr. Radomski is not a Registered Securities Advisor. By reading Przemyslaw Radomski’s, CFA reports you fully agree that he will not be held responsible or liable for any decisions you make regarding any information provided in these reports. Investing, trading and speculation in any financial markets may involve high risk of loss. Przemyslaw Radomski, CFA, Sunshine Profits’ employees and affiliates as well as members of their families may have a short or long position in any securities, including those mentioned in any of the reports or essays, and may make additional purchases and/or sales of those securities without notice.

“In 40 years of watching markets closely, I have never seen more dangerous conditions than exist in the stock market today…”
What Bob has published is so exceptional that it’s best for me to show instead of tell — and I’d like to provide you with one more example of what that means.
Please take a moment to consider the six decades of data this chart presents, via the S&P 500 (above) and the mutual funds cash-to-asset ratio (below). The vertical dotted lines help show a clear correlation.

Thank you for reading,
![]()
Robert Folsom
Elliott Wave International
The above is one of more than a dozen recent sentiment charts presented in Prechter’s latest Theorists.
Follow this link to see them now — on your screen in moments — all risk-free for 30 days >>
Summary: The most positive aspect of last night’s deal was that a deal was reached at all, and that some steps have been taken to counter moral hazard. However, overall, this is a bad deal for Cyprus and the Cypriot population. Cypriot GDP is likely to collapse in the wake of the deal with the possible capital controls hampering the functioning of the economy. The large loan from the eurozone will push debt up to unsustainable levels while the austerity accompanying it (along with the bank restructuring plan) will increase unemployment and cause social tension. There is a strong chance Cyprus could become a zombie economy – reliant on eurozone and central bank funding, with little hope of economic growth. Meanwhile, the country will remain at the edge of the single currency as tensions increase between members with Germany, the ECB and the IMF now looking intent on a more radical approach to the crisis.
The eurozone took this one down to the wire. But late last night, after a week of intense back and forth negotiations, a deal was reached on the Cypriot bailout. Below we lay out the key points of the deal (the ones that are known, there are plenty of grey areas remaining) and our key reactions to the deal.
The Euro and European stocks nosedive on the news:
……key points of the deal & what it means HERE

Peter Grandich on the Future of the TSXV. Resources Wire editor Kevin Michael Grace interviewed Peter Grandich March 14, 2013. In this second part of that interview, Grandich discusses the prospect for junior miners. (See Part 1 Gold Has Not Peaked HERE)
RW: The PDAC Mining Conference was in Toronto last week. I read all the stories coming out of it, and it was like hearing from members of the German High Command in January 1945. That’s how bad the sentiment was. We’ve been talking about a bottom in mining equities for quite some time, but every time we supposedly hit the bottom, there’s another bottom.
 PG: The good thing going is that there is nothing good going at the moment. That is really the only positive thing I can say now. There is such an overwhelming amount of bearishness, and the last of the enthusiasm from people that kept hoping there would be a bottom has disappeared. I hear this from mainly retail investors, but I wouldn’t be surprised if professional investors feel the same way—even when there is a rally, they just want to get out of mining stocks and never see them again.
What we have going for us is that there have been, I think, 11 or 12 bear markets in juniors over the last 30 years, which is the amount of time I’ve been in this, although this one is clearly the most severe.
There was a sense of hopelessness—that we could never get back to former heights.
But those markets recovered, and so the question is whether this time the market will recover as well.
There have been structural changes that make it harder to operate, and these will probably cap the type of rebound we can have.
One thing is absolutely certain. For the rest of 2013, it will only be the type of deals that are closer to the top of the pyramid that can move forward. Companies with advanced-stage deposits or already transitioning into development or production will see the bulk of whatever dollars are available for financing. The smaller, earlier-stage exploration deals, no matter where they are, no matter what the structure of the company is pricewise or the amount of shares outstanding, will suffer greatly. Financing will go to those companies that can go into production, as opposed to the swing-for-the-fence companies in early-stage exploration.
I think we’ll see a one-tier recovery in the juniors. It’s sad to say, but a lot of them will cease to exist. That’s providing that the Toronto Stock Exchange doesn’t lower its listing standards so it can still collect money, so that that on paper these companies can exist but will have no real life outside of that.
RW: John Kaiser thinks a cull of 500 companies would be a good thing, but he adds that things have come to such a pretty pass it’s possible that the TSXV itself could die.
PG: I don’t know if it would die, but that’s what I was getting at. Knowing what I know about how exchanges are run, they will look to lower the standards to continue to bring fees in. Hundreds of companies will disappear, but some will find the old route that’s always been taken by companies: rollbacks, changes of names and new projects. But the difficulties those guys will have is there won’t be the ample refunding dollars that are normally available.
…..read pages 2 & 3 HERE

-
I know Mike is a very solid investor and respect his opinions very much. So if he says pay attention to this or that - I will.
~ Dale G.
-
I've started managing my own investments so view Michael's site as a one-stop shop from which to get information and perspectives.
~ Dave E.
-
Michael offers easy reading, honest, common sense information that anyone can use in a practical manner.
~ der_al.
-
A sane voice in a scrambled investment world.
~ Ed R.
Inside Edge Pro Contributors

Greg Weldon

Josef Schachter

Tyler Bollhorn

Ryan Irvine

Paul Beattie

Martin Straith

Patrick Ceresna

Mark Leibovit

James Thorne

Victor Adair