
Timing & trends
First, let me introduce myself. I’m Douglas Davenport, editor of theAll-Weather Investor and Inflation Survival Strategy investment services. If you have already joined one or both of these portfolios, you know that they’re based on an objective, trend-following trading model I developed years ago with my mentor, the legendary investor Sir John Templeton.
This proprietary trading model has helped my clients beat the S&P 500 by a wide margin, quarter after quarter, year after year, in both up and down markets. The model allows me to dispense with forecasting, guessing and wishful thinking, and focus strictly on what the markets are doing right now. In this way, we’re able to catch every major move across a variety of asset classes, and successfully navigate difficult market environments such as the one we’re seeing now.
Of course, I can’t tell you exactly what my trading model is saying at the moment, or which ETFs I’m investing in to take advantage of the market trends. But I can tell you about the risks I’m seeing in each of the major asset classes, and how they’re likely to affect the markets over the next quarter.
Overall, my outlook for global growth is improving, mainly due to the continued flow of money from central banks around the world. The U.S. Federal Reserve, the European Central Bank, the Bank of England, and the Bank of Japan, among others, are still concerned enough about the state of the global economy that they have pledged to keep monetary expansion alive and interest rates low for the foreseeable future.
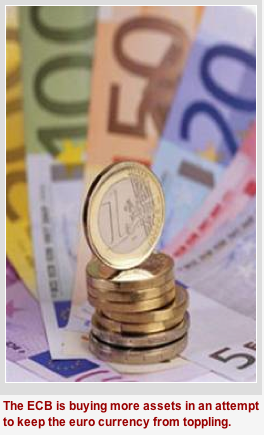 The ECB in particular is back in the crosshairs following the recent bank panic and bailout in Cyprus. And now there’s talk that Slovenia could be the next domino to fall in the ongoing sovereign debt crisis. Meanwhile, the unemployment numbers across the region, especially in Spain, are unacceptably high, and there is growing social unrest in the PIGS countries (Portugal, Italy, Greece and Spain), not to mention political gridlock in Italy. European central bankers know that their problems are far from solved, and they’ve responded by stepping up their asset purchases.
And what about the emerging markets? The engines of global growth over the past decade or so are also showing troubling signs of weakness, acting as an anchor on economic expansion.
It’s clear that the global debt crisis will take a long time to work out. And while the slowdown in the emerging markets has cut into demand for commodities and kept a lid on inflation, eventually price inflation will have to increase in order to shrink the real value of debt. How this plays out will be very important to sustained growth worldwide.
Are Equities in Line
for a Pullback?
Despite all these problems, the global equity markets have been doing remarkably well.
Is this another case of “irrational exuberance”?
Or did the market bottom in March 2009, barely four years ago, mark the beginning of a new secular bull market?
I think the answer may be somewhere in between, but it does look like markets are very much overbought. Equity investors have priced in a great deal of good news on growth for 2013. However, earnings forecasts for the S&P 500 have been trimmed by about $9 per share over the past year. Profit margins are also likely to fall.
So in my opinion, the odds of another correction are growing rapidly. But keep in mind that the central banks are still keeping the markets propped up. Their massive quantitative easing programs won’t allow for a major downturn. Instead, I think we’re likely to see a relatively mild event, marked by a drop of 4 percent to 9 percent in the S&P 500, similar to other pullbacks since 2009. When that happens, it should be treated as a buying opportunity.
When Will Bond Yields Start to
Reflect Inflation Risks?
Meanwhile, despite the recent rally to a record high on the Dow Jones Industrial Average, it appears that investors in the U.S. are still under-allocated to equities and over-allocated to fixed income.
Globally, bond yields reached a multi-decade low last summer and have risen since that time in most countries. But the current U.S. bond real yield is still about zero (after inflation and taxes), and it does not reflect inflation risks.
Inflation is generally tame in most countries considering the massive amount of monetary injections. However, the central banks want and need inflation, and they will eventually get it. If you’re not prepared, you could get caught flat-footed.
When Will Gold’s
Consolidation Phase End?
Gold and other precious metals are clearly in a corrective phase and have been since topping out in 2011. Why has gold consolidated for this long?
The answer is a combination of factors, including improving confidence in the financial system, weak inflation, a major slowdown in demand from China and India and a much stronger U.S. dollar. In addition, gold is still primarily a hedge, and may not turn around as long as the stock market stays on a roll.
In fact, these trends could all carry on for a while longer. But in the longer term, I believe the fundamentals for precious metals remain positive. It appears gold is just building a new base to launch its next upswing. However, keep an eye on the support level around $1,550 an ounce. If gold breaks down through that price, it could fall even further before the trend turns positive.
How Long Will Commodities
Weakness Persist?
As I mentioned earlier, China’s weak growth has limited demand for most commodities. And reports of build-ups in copper and aluminum stockpiles imply that weakness could persist for a while.
In the energy markets, crude oil has traded in a very narrow range since 2011 and near-term risks appear to be to the downside. But one asset that has shown marked improvement is North American natural gas. It has started to recover from the lows of 2008, and it has nearly doubled since the low in 2012. Natural gas prices may have more upside due to larger depletion rates that were originally expected from many gas fields.
Will the U.S. Dollar Remain Strong?
The dollar has certainly benefitted from the strong performance of the U.S. stock market, but it may also simply look good compared to its competition.
Expectations for U.S. growth are stronger than other G-7 nations, and the dollar still has the benefit of being the world’s reserve currency.
In addition, the dollar is helped by the continued weakness in the euro zone. The euro has to be weak to pull the region out of its ongoing slump, and in fact, the shared currency has been in a downtrend since 2008. But I think it still remains overvalued versus the dollar.
Risks and Rewards in the Coming Years
In the short term, floods of liquidity from the central banks will continue to support global stock markets. U.S. equities should continue to outperform and emerging markets will underperform in the coming months. Europe should see some boost from additional monetary policy, but progress on structural reforms in southern Europe and political friction make that challenging to say the least. The choppiness in the gold market will continue before its next long-term leg up begins. And we may soon begin to see signs of inflation in the U.S. bond market in the form of higher yields and lower bond prices.
Longer term, it’s an understatement to say that we are facing huge risks. It’s obvious to everyone by now that the global rally has been primarily driven by central bank money printing, creating an artificial financial environment.
The world’s biggest central banks have added an astounding $8.7 trillion of liquidity since 2008, while slashing interest rates well below the rate of inflation. This massive amount of liquidity has found its way into the markets.
At some point, all this quantitative easing will end. The resulting worldwide deleveraging will create massive problems for the equity markets. There’s no telling when this sea change will happen, so it’s imperative that you develop an exit strategy now.
The fact is, most of the world’s economies remain very fragile without central bank intervention, and their markets’ confidence could be easily shaken at the first hint of stimulus withdrawal. Members of my All-Weather Investor and Inflation Survival Strategy services are preparing for just such an eventuality.
Sincerely,
15430 Endeavour Drive
Jupiter, FL 33478-6400
1-800-291-8545
Overseas: 1-561-627-3300
Fax: 561-625-6685

Silver “Acting More Like Base Metal than Store of Value”
U.S. DOLLAR prices to buy gold dipped back below $1600 an ounce Tuesday morning, though they remained close to that level by lunchtime in London, as the physical bullion market re-opened following the Easter break.
Stock markets edged higher in Europe despite news of record high unemployment and contracting manufacturing sectors, while major government bond prices dipped.
“Looking at gold for six months shows the metal making successively lower lows and lower highs,” says the latest technical analysis from Scotia Mocatta.
“The last major lower high was $1620…We feel that while this $1620 level holds, the risk is for another drop to $1555 and possibly the one year low of $1528.”
“We saw buying interest from the general public on TOCOM this morning,” says one dealer in Tokyo, referring to the Tokyo Commodity Exchange.
“But then it disappeared. [People] don’t want to buy or sell because of the matters concerning North Korea.” North Korea said over the weekend that it is in a ‘state of war’ with South Korea, technically true since the 1950-53 Korean War ended with an armistice rather than a peace treaty. Pyongyang, which conducted a third nuclear test in February, has also said it will restart all facilities at its Yongbyon nuclear complex.
In the south, “people do seem a bit more concerned than before,” says one BullionVault contact based in Seoul, adding that a colleague of his has “bought lots of noodles and canned food ‘just in case'”.
“People’s fear is more based on the fact that the North has done small attacks in recent years to force a return to the negotiating table, and that if they do the same again, it could escalate this time because the South’s new president will need to show a reaction.”
BullionVault‘s Gold Investor Index fell for the third month running in March, figures published Tuesday show, despite the online precious metals exchange seeing its busiest week since mid-October following the Cyprus bailout news.The world’s biggest gold exchange traded fund meantime continued to see outflows Monday. The volume of gold backing shares in the SPDR Gold Trust (ticker: GLD) fell to its lowest level since July 2011 at just over 1217 tonnes.
On the Comex exchange, the so-called speculative net long position of gold futures and options traders, calculated as the difference between the number of bullish and bearish contracts held by hedge funds and other money managers, fell by 0.2% to the equivalent of 397.3 tonnes in the week ended last Tuesday, weekly data published by the Commodity Futures Trading Commission show.
Silver meantime fell below $28 an ounce Tuesday, trading near seven-month lows, while other commodities were broadly flat on the day. “In the past two weeks silver has been performing more like a base metal and less like a store of value,” says today’s commodities note from Commerzbank.
(Ed Note: Below is what silver looked like trading Tuesday 6:35 am PST)
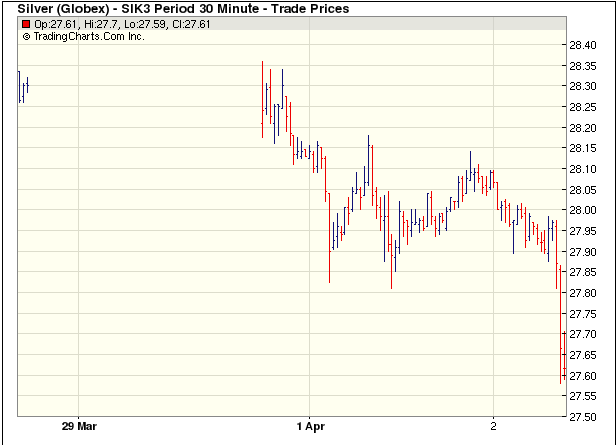
“Silver’s underlying demand/supply fundamentals remain weak…inventory is abundant,” says Standard Bank’s monthly Precious Metals Definer, estimating that China’s surplus is equivalent to 18 months’ of fabrication demand. “The situation within China implies that one of two scenarios should happen before silver can rise substantially higher on a sustainable basis:
(1) internal demand (fabrication and investment demand) must grow faster to decrease the stockpiles, or
(2) China must become a net exporter of silver again.” Standard’s analysts add that the second scenario “would only imply that the metal has shifted location and not been consumed — the result of which would be price neutral at best.”
Although the Dollar silver price ended the first quarter down more than 4%, the US Mint recorded its strongest quarter for silver coins sales since it began keeping records in 1986.
Over in Europe, the Eurozone unemployment rate hit a record 12% in January, according to revised figures published this morning, maintaining that level in February.
Eurozone manufacturing meantime continued to contract last month and a faster rate than a month earlier, according to purchasing managers index data published Tuesday. Germany’s manufacturing PMI fell back below 50, also indicating contraction, while Britain’s PMI fell further below 50.
India is unlikely to raise gold import duties again, having raised them to 6% in January, according to the country’s finance minister.
“There are limits to which tariffs can be raised on gold,” P. Chidambaram told Reuters Tuesday, “because if you raise tariffs prohibitively, gold smuggling will increase.”
Turkey imported 18.26 tonnes of gold last month, up from 17.34 tonnes a month earlier, according to data from the Istanbul Gold Exchange. Turkish gold imports in 2012 were up 51% from a year earlier at 120.78 tonnes. Turkey’s gold exports also jumped last year, with reports suggesting it was using gold in trade with sanctions-hit Iran.
Ben Traynor
Gold value calculator | Buy gold online at live prices

This Week’s Trading Lesson
I have often said that making money trading stocks is simple, but not easy. Once you learn basic technical analysis techniques, have good tools to identify opportunities and gain some experience at identifying good trading opportunities, the actual job of picking stocks is relatively straightforward. Where most traders fail is in the application of a methodology. The simple and undeniable fact is that we are all human, and therefore, we are all blessed with emotion. When money is on the line, our emotional attachment to it can take over our decision making process. (continued below)
…………………………………………………………………………………………………………………………………………………………
Stockscores Market Minutes Video
Before you take any trade, make sure you analyze the stock’s chart on multiple time frames. Watch this week’s Market Minutes video to see how. Plus, Tyler’s regular weekly market analysis. Watch it byclicking here.
…………………………………………………………………………………………………………………………………………………………With that said, I thought it would be helpful to examine the common problem areas that are a result of mental breakdowns. By examining the emotional conduits to decision making, hopefully I can provide some solutions to correct common trading mistakes.
Trading Problem #1 – No Patience on Entry
Anticipating a signal that never comes is common for traders monitoring the market closely and eager to get some money working. For example, a good buying opportunity arises when a stock breaks from an ascending triangle. Jumping in ahead of the breakout is not an ideal situation because the probability of success buying an ascending triangle is not as good as buying a breakout from one.
What causes this mistake? I think a fear of missing out on the maximum amount of profit or the fear of too much risk in buying a stock are the two most common mistakes. Essentially, the two guiding forces of the stock market are at work here; fear and greed.
By buying early, we can realize a greater profit when the stock does breakout since we will have a lower average cost. Or, by buying early we can reduce risk since a breakout followed by a pull back through our stop will result in a smaller loss as we have a lower average cost.
What tends to happen, however, is that the stock does not break out when expected and instead pulls back. This either leads to an unnecessary loss or an opportunity cost of the capital being tied up while other opportunities arise.
The Solution
The simple and obvious solution is to wait for the entry signal, but there are also some things you can do to help yourself stay disciplined. Rather than watch potentially good stocks tick by tick, use an alarm feature to alert you to when they actually make the break. Watching stocks constantly is somewhat hypnotic, and I think the charts can talk you in to making a trade. However, letting the computer watch the stock may help you avoid the stock’s evil trance.
Another good solution is to focus on different thoughts when considering a stock. Don’t think about potential profits, don’t think about minimizing losses. Instead, focus in on the desire to execute high probability trades. It takes time to reprogram yourself, so persevere.
Trading Problem #2 – Selling Too Soon
We have all felt the disappointment of not selling a stock at the high. When a stock is marching higher, we set a point where we intend to sell so that we can lock in the gain before it goes down. The problem is that after we sell the stock, it continues to go higher leaving us with an opportunity missed.
Selling too soon is a problem that I continue to wrestle with after 23 years of trading stocks. I want to lock in that good feeling of taking a profit off the table. I want to avoid the negative feeling of watching a good profit get cut in half by a rapid sell off. And so, I break my selling rules and sell the stock in anticipation of weakness, rather than when the market tells me I should.
The result is that profitability over the long term is not maximized. Once in a while, I may get out of a trade at a better price than I would if I followed my rules, but over 10 or more trades, my net profitability is not as good as if I had maintained my selling rules. Keeping in mind that trading stocks is a probability game, it is important to maximize gains on the winners so that the inevitable losers can be overcome.
The Solution
There are few things that can help you avoid falling in to this trap. First, go through a number of past trades and apply your selling rules to see what your net profitability would have been if you have been disciplined, and compare those with what you actually achieved. I did this and it gave me powerful proof that maintaining discipline pays off, and is worth striving for. In fact, when I did this over one particular one week period, the difference amounted to a pretty nice new car! That gave me the leverage on my emotions I need to overcome them.
Second, turn off the profit and loss indicator that most brokerages and trading platforms give you. How much you are up or down is irrelevant to the decision making process. Since we have an emotional attachment to the money, knowing that we are up a certain amount and then seeing that shrink on a normal pull back in a stock leads us to make an emotional decision.
Finally, remember to sell at floors, not ceilings. Do not limit the upside movement of a stock by setting a price target, but instead, limit the downside movement by setting a price floor. Sell a stock when it pulls back to a floor, rather than selling it in anticipation of it reaching a ceiling price.
Trading Problem #3 – Letting Small Losses Turn in to Big Losses
As I just mentioned, trading stocks is a probability game. You will not be right all the time, which means that one of the most important aspects of trading stocks is to never let small losses grow in to big, portfolio debilitating losses. You have to limit losses at a risk level if you are going to be successful over the long run.
Solution
The simplest and I think most effective solution for most people is to set a stop loss point before purchasing a stock, and apply it immediately after purchasing a stock. Use basic chart analysis to determine where the market will have proven your decision to enter a trade wrong, and set your stop just below that. Automated stop losses are best because they do not require you to have the discipline to pull the exit button. Do not change your stop once you are in the trade. Making the stop loss judgment before you enter the trade is best since you will not have an emotional attachment to the stock at that point since you have not put your money on the line yet.
Trading Problem #4 – Trading Low Probability Opportunities
My dad is one of those do it yourself guys who would rather work hard than have someone else do the job for him. As a kid growing up, that meant that I helped build fences, garages, basement developments, pour concrete driveways, do yardwork and generally learn that same ethic to work hard. I am thankful that I have that spirit, but in the early stages of being a trader, it was something that hurt me.
The stock market cannot be made to go your way by hard work. There are times when the market giveth, and there are times when the market taketh away. The legendary Vancouver stock promoter Murray Pezim once said that all abnormal profits in the stock market are just short term loans. His point is that people do not know when to leave the market alone, and when it is time to work hard.
Traders will tend to take low probability trading opportunities at the worst time, because it is during weak market conditions that the market only shows marginal opportunities. By working really hard, traders can find opportunities that are pretty good, but not great. By taking these lower probability trades, the trader sets him or herself up for failure, since their rate of success will not be as good.
The Solution
I have said it many times, when the going gets tough, tough traders get lazy. You must always be picky about the kind of trades you make, particularly when the market is weak. Working hard to find opportunities will not make you more money, working hard at being disciplined will.
Teach yourself to look forward to the slow times. Make a list of things that you are going to do when the market slows down. Plant a tree, play golf, kill the ants that are crawling around your house. Just make the list.
Perhaps most importantly, if you depend on the market for a paycheck, make sure that you bank money when the market is good so that you don’t have to trade when the market slows down. Making a trade because you need to pay some bills is not a good way to trade.
Trading Problem #5 – Overtrading
There are stock traders who make 150 or more trades in a single day. I am not sure they make a lot of money. I firmly believe that you can make more money by making fewer trades because it will make you focus on only the best of opportunities, and play them with a larger amount of capital so the pay off is better. By being patient and disciplined with the really high probability trades, you can maximize profitability.
The Solution
If you are currently making 50 trades a week, tell yourself that next week you will only be allowed to make 10. If you are making 20 a week, promise yourself that you can only make 5. Don’t just tell yourself that you are going to stick to your new rule, write it down!
By setting this limit, you will hopefully change your outlook and try harder to only consider very high probability trades. We want to focus on great trading opportunities, not just those that are good.
Trading Problem #6 – Hesitation
You are watching a stock that has all the signals you look for in an opportunity. The proper point to enter comes, but you wait. You second guess the opportunity and don’t buy the stock. Or, you bid for the stock at a price that is not likely to get filled if the opportunity does pan out the way you anticipate it will. As a result, you get left behind while the market pushes the stock higher.
A short while after the initial entry signal, when the stock has made a decent gain, you decide to finally enter the trade. After all, the market has proven your analysis correct, so you must be smart, and right! Not long after you enter, the stock turns south and you end up with a losing trade. If only you had bought when you first thought about it.
The Solution
This is really just a confidence issue. You are either not confident in your ability to analyze stocks, or you are not confident in the methodology that you are using to pick trades. Therefore, you have to research your method so that you have the confidence that it works. Then, you have to start small, making trades that have a potential loss that you are comfortable with. As you gain confidence in your method and your ability, increase the trade size. With your new found confidence, stand in a crowded room and scream, “I am great!” Well, maybe don’t carry it that far.
Trading Problem #7 – Letting Winners Turn in to Losers
The final trading problem that I want to focus on is allowing winning trades to turn in to losers. Many of us have probably had a time when a trade was making big loot, and we started to count the profits like they were ours before we exited the trade. When the stock started to lose the ground it had gained, we avoided selling because we had built up an emotional attachment to the paper profits we had seen. Instead of selling the stock to lock in some gain, we opted to hold out for the stock to go back to where it used to be, promising to sell when it came back to the point where we felt good about the trade. The stock drifts lower, and eventually the gain turns in to a loss. We ultimately sell it at the bottom, swearing never to do it again. But without some reprogramming, we probably will.
The Solution
Like Kenny Rogers used to sing, “Don’t count your money, when you are sitting at the table, there will be time enough for counting, when the dealing’s done.” Do not calculate your profits before you lock them in. Avoiding the profit watch will help you avoid an emotional attachment to the paper profits, giving you greater clarity to take the exit door when the market tells you it is time to do so.
I hope this outline of mental problems and some solutions helps you become a better trader. The difference between those who succeed in trading and those who fail is not the system they play, but how well they play it. Your mind is a powerful thing, don’t let it beat you in the market.
STRATEGY OF THE WEEK
The staple of my position trading strategies is the Stockscores Simple. It seeks stocks with Sentiment Stockscores of 60 or better and Signal Stockscores of 80 or higher. There is an element of skill to this strategy as you have to know what to look for in the charts of stocks that the Market Scan identifies. We want stocks that are breaking through resistance from an optimistic chart pattern with some evidence of market excitement in the recent trading activity.
Here are two stocks that showed some good trading action on a quiet day of trading Monday:
STOCKS THAT MEET THE FEATURED STRATEGY
1. BTH
BTH is breaking out through resistance after breaking its downward trend in January. The break today is an abnormal price move from a rising bottom, a sign of investor optimism. Support at $16.75.

2. GA
GA is already well in to an upward trend but it has paused for about three months, setting up resistance at $6.50. Today the stock broke through that resistance level with good volume, setting the stock up for the next leg of the upward trend. Support at $6.45.

- References
- Get the Stockscore on any of over 20,000 North American stocks.
- Background on the theories used by Stockscores.
- Strategies that can help you find new opportunities.
- Scan the market using extensive filter criteria.
- Build a portfolio of stocks and view a slide show of their charts.
- See which sectors are leading the market, and their components.
Disclaimer
This is not an investment advisory, and should not be used to make investment decisions. Information in Stockscores Perspectives is often opinionated and should be considered for information purposes only. No stock exchange anywhere has approved or disapproved of the information contained herein. There is no express or implied solicitation to buy or sell securities. The writers and editors of Perspectives may have positions in the stocks discussed above and may trade in the stocks mentioned. Don’t consider buying or selling any stock without conducting your own due diligence.

Contents:
Three Days that Saved the World Financial System
Does a Yes to the Swiss Gold Referendum Imply an End of the CHF Cap?
Texas Wants its Gold Back! Wait, What?
Cyprus and the Unraveling of Fractional-Reserve Banking
Slovenia Faces Contagion from Cyprus as Banking Crisis Deepens
Luxembourg Warns of Investor Flight from Europe
The German Professor Who Wants to Get Rid of the Euro in Order to Save Europe
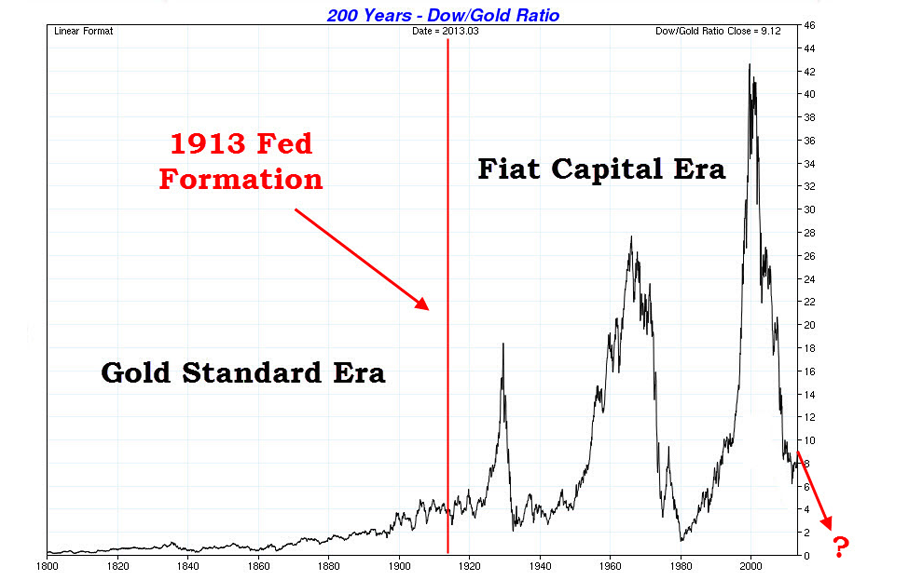
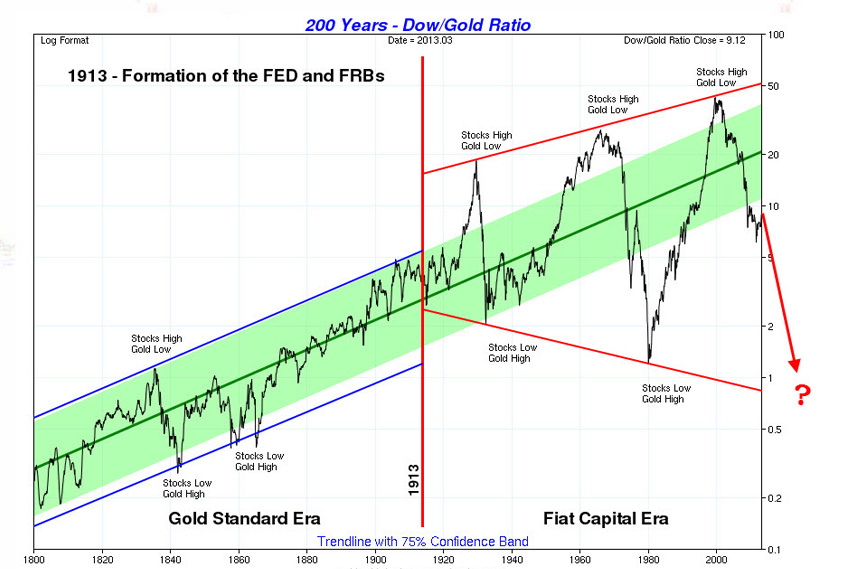
One of the more fascinating reminders of what may be to come for the remainder of this gold bull market, is the charted history of the dow/gold ratio. Below are two charts illustrating the upward potential in gold which remains for the duration of this market.
The first chart is a normal 200-year look at the dow/gold ratio. What’s particularly shocking here is the staggering levels of volatility injected into the economy and financial system following the US Federal Reserve’s formation in 1913…. [This] volatility has wreaked havoc on many, while creating excellent one-way bets for long term speculators…. [T]he second and more alarming ratio chart is illustrated with a “confidence trend band”:
.…….read it all HERE (Delay Of Game. Five (point eight) Yards)
“Despite the continued reverberations regarding the Cyprus bailout and its involvement of bank deposits, gold struggled to maintain the positive momentum created in the first two weeks of March and instead now looks very likely to move lower, towards $1580/oz,” wrote Deutsche Bank commodities analyst Xiao Fu
 Faber’s response:
When you print money, the money does not flow evenly into the economic system. It stays essentially in the financial service industry and among people that have access to these funds, mostly well-to-do people. It does not go to the worker. I just mentioned that it doesn’t flow evenly into the system.
Now from time to time it will lift the NASDAQ like between 1997 and March 2000. Then it lifted home prices in the U.S. until 2007. Then it lifted the commodity prices in 2008 until July 2008 when the global economy was already in recession. More recently it has lifted selected emerging economies, stock markets in Indonesia, Philippines, Thailand, up four times from 2009 lows and now the U.S.
So we are creating bubbles and bubbles and bubbles. This bubble will come to an end. My concern is that we are going to have a systemic crisis where it is going to be very difficult to hide. Even in gold, it will be difficult to hide.
…….read more copy – THE SCARIEST CHARTS IN THE WORLD


-
I know Mike is a very solid investor and respect his opinions very much. So if he says pay attention to this or that - I will.
~ Dale G.
-
I've started managing my own investments so view Michael's site as a one-stop shop from which to get information and perspectives.
~ Dave E.
-
Michael offers easy reading, honest, common sense information that anyone can use in a practical manner.
~ der_al.
-
A sane voice in a scrambled investment world.
~ Ed R.
Inside Edge Pro Contributors

Greg Weldon

Josef Schachter

Tyler Bollhorn

Ryan Irvine

Paul Beattie

Martin Straith

Patrick Ceresna

Mark Leibovit

James Thorne

Victor Adair