
Gold & Precious Metals

 In the years following the global financial crisis, economists and investors have gotten very comfortable with very high, and seemingly persistent, government debt. The nonchalance may be underpinned by the assumption that globally significant countries that can print their own currencies can’t get trapped in a sovereign debt crisis. However, it now appears that Japan is preparing to put this confidence to the ultimate stress test.
For the better part of 20 years, successive Japanese governments and central bankers have been trying, unsuccessfully, to use quantitative easing strategies to pump up a deflated asset bubble. The economy has by and large not responded. The sustained and impressive growth that Japan delivered during the 45 years following the Second World War (which had made the country one of the most successful economic stories in world history), has never returned. For the last 20 years Japan has offered a “zombie” economy characterized by low growth, stagnation, and exploding government debt. The Japanese government now owes approximately $12 trillion, a figure representing more than 200% of GDP. The IMF expects that this figure will reach 245% by the end of this year. This gives Japan the unenviable title of having the world’s highest government debt-to-GDP ratio. But Shinzo Abe, the newly elected Prime Minister of Japan, and Haruhiko Kuroda, his newly-appointed Governor of the Bank of Japan, feel much, much more debt needs to be issued to turn the economy around.
The hope that Abe would be a new kind of prime minister with a bold economic formula helped revive the long dead Japanese stock market. Between May and November of 2012, the Nikkei traded within a range of 8200-9400. As Abe’s victory began to be expected, the Nikkei started moving up, reaching 10,000 by the time he was sworn in on December 26 of last year. The euphoria continued throughout the spring and by April 2 the Nikkei stood at 12,003 points. Then on April 4, BOJ Governor Kuroda made good on Abe’s dovish rhetoric and announced a plan to end years of mildly declining prices by doing whatever necessary to create 2% inflation (in reality these price declines have been one of the few consolations to Japanese consumers). To achieve its goals, the government is prepared to double the amount of Yen in circulation. Stocks immediately rallied, and in less than a week the Nikkei had breached 13,000 points, taking the index to a 4 1/2-year high. It is rare that any major stock market can achieve a 50% rally in less than a year. But the rally will be costly.
The Japanese government already spends 25% of tax revenue to service outstanding debt (compared to 6% in the US). These costs become even more astonishing when one considers the extremely low rates Japan pays. Ten-year Japanese government bonds now pay less than 0.6%, and five-year yields are now a little more than 0.20%. How much will debt service costs increase if Abe succeeds in pushing inflation to 2.0%? Two percent rates would triple long term borrowing costs. Given the size of its debts, increases of such magnitude could hit Japan with the force of 10 Godzillas.
Japan has an aging demographic and as more time goes by, the pool of potential bond buyers continues to shrink. Unlike the United States, where individual savers are mostly irrelevant in the sovereign debt market, Japanese investors have largely set the market in their own country. There is evidence to suggest that Japanese savers are increasingly considering overseas sources of yield for protection from the inflation that Abe is so determined to create.
As the Nikkei has moved upward, the Japanese Yen has taken the opposite trajectory, falling more than 20% against the U.S. Dollar since the beginning of 2012, and nearly 12% since the beginning of this year (the decline has been even greater in terms of several other currencies). This steep drop, which has taken a huge bite out of the nominal gains in Japanese stocks is unusual in the foreign exchange markets, and has threatened to destabilize an already weak global financial system.
Earlier this year the falling yen issue sparked a full-fledged headline war. On February 16th, participating members of the G20 issued a statement, clearly aimed at Japan, warning against competitive devaluations and currency wars. A day later, Japan’s Finance Minister stated flatly that Japan was not attempting to manipulate its currency. After some hesitation, the G20 seemed to accept this statement. For now it seems the international powers have fallen in behind Japan. Both IMF Chief Christine Lagarde and Ben Bernanke have praised Abe’s policies. The prevailing opinion seems to be that weakening a currency should not be considered manipulation as long as it’s done to revive a domestic economy, not specifically to harm competitors. Such an opinion qualifies as a great moment in rhetorical shamelessness.
In addition to his plans for inflationary monetary policy, Abe is also attempting to wage war from the fiscal side as well. His Liberal Democratic Party has called for over $2.4 trillion USD worth of public works stimulus over the next 10 years. This spending represents approximately 40% of Japan’s current GDP and, adjusted for population, would be the equivalent of nearly $600 billion USD annually in the United States.
It should be obvious to anyone with even half a brain that Japan’s prior experiments with ever larger doses of quantitative easing have failed. Leaders in both Japan and the United States, however, are following this path with reckless abandon. According to Abe, the entirety of Japan’s economic problems can be blamed on the fact that consumer prices have been declining by one tenth of one percent per year. If only Japanese consumers were forced to pay two percent more per year for the things they need or desire, all would be well.
Abe’s wish may already be coming true. McDonald’s announced this morning that, for the first time in 5 years, the price of hamburgers and cheeseburgers in Japan will be rising by 20% and 25% respectively. This is much needed relief for bored Japanese consumers who have likely grown tired of paying the same low prices year after year. No doubt they will be so excited by this development that they’ll will rush to the stores to buy more burgers before prices go up again. Of course there is no official concern that low-income Japanese will now have to pay more for low cost food.
The idea that informs Abe’s plan, that rising prices entice consumers to buy before the prices go up, is clearly suspect as economic law dictates that demand increases when prices fall. Any store owner will tell you that cutting prices is the best way to move merchandise. Apart from this problem, how does Abe expect consumers to buy more when their currency is losing purchasing power and more of their incomes will be needed to pay interest on the national debt?
The boldness of Abe’s plans should provide the rest of the world with a crash course in the ability of debt accumulation to jumpstart an economy. The good news is that the effects should not take too long to be seen. I believe that we will be treated with a stark lesson on the limitations of inflation as an economic panacea.
Hopefully, failure of this latest Japanese experiment will help convince leaders in the U.S. and Japan that the only true path to prosperity is free market capitalism. Rather than trying to reflate busted bubbles and micro-manage Keynesian style recoveries, politicians and central bankers should recognize their respective roles in creating the problems and get out of the way.
To order your copy of Peter Schiff’s latest book, The Real Crash: America’s Coming Bankruptcy – How to Save Yourself and Your Country, click here.
For in-depth analysis of this and other investment topics, subscribe to Peter Schiff’s Global Investor newsletter. CLICK HERE for your free subscription.

- Many economists believe the price of gold has fallen because institutional investors have become more interested in owning the general stock market.
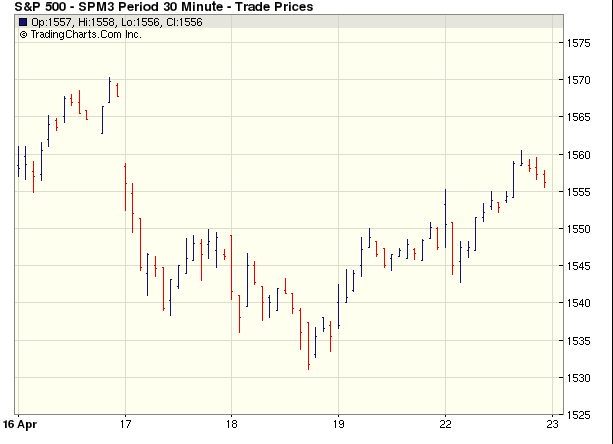
- May is a time when institutional investors often sell stocks. Please click here now . An ominous head & shoulders top pattern appears to be forming on the Dow.
- “If you look at the economic growth story, it’s just not really there” –David Bloom, head of FOREX for HSBC, April 23, 2013.
- Gold imports in India are surging. “Imports have been phenomenal since April 15. Banks are getting the lion’s share in this profit,” -Daman Prakash Rathod, MNC Bullion, Chennai, India.
- The banks have an “interesting habit” of making the largest profits in most markets, most of the time. Since gold crashed, dealer spreads have increased dramatically, benefitting the bullion bank dealers.
- Last year, gold bottomed in May. Will it bottom there again, this year?
- I want you to take a look at the daily gold chart, through the eyes of a bear. Please click here now . The gold bears believe there is a flag pattern in play, and prices of $1100, and lower, are coming very quickly.
- I view the market more as a fight, than an “investment”, so I like to know what’s in the mind of my opponent. There is a bearish flag pattern in play, at least on that chart, but that doesn’t necessarily mean the bears will make any profits from their analysis.
- Why would that be? Well, please click here now . That’s another view of the daily gold chart, highlighting the action of my “Stokeillator” (14,7,7 Stochastics series).
- The Stokeillator gave a very clear sell signal several days in advance of this gold crash. It’s beginning to turn up, and a crossover buy signal seems imminent.
- Most investors want to avoid pain. Traders can use my Stokeillator to do that, but longer term investors can also use my sell signals to simply grit your teeth, and get ready for a bit of a rough ride.
- The current position of the Stokeillator suggests, at bare minimum, that a pause in the bearish price action is very near.
- In the bigger picture, I’ve always asked subscribers to act as “investing marines”. That entails looking at the long term weekly and monthly charts, and defining key HSR (horizontal support and resistance) areas.
- When the gold price arrives (whether gently or in a wild crash is irrelevant to the marine) at one of these key HSR zones, the marine goes into action, and buys gold in a pyramid formation.
- Please click here now . You are looking at the weekly gold chart. Since the August 2011 highs near $1923, my view is that only 2 long term buying opportunities have occurred.
- The first occurred almost immediately after that August top, at $1577. Numerous rallies occurred from that key HSR zone.
- I maintain a “3 strikes and you’re out” HSR-area rule, for gold. It’s critical to buy the first time that price arrives at an HSR zone. Put the fear demon aside, and just buy. Analyse the situation later, but make sure you do some immediate buying, even if it is just a little bit.
- When gold crashed, it happened after the fourth touching of the HSR at $1577. Gold struck out, and so did investors who called the bottom there.
- Focus on buying an asset that is timeless, without hesitation, analysis, or procrastination. If you try to predict a parabola for gold, long after HSR is first touched, you are more likely to strike out than hit a home run.
- I have some minor concern that the violence of the crash into massive HSR in the $1432 area may be enough to send gold down to the next zone of key HSR, at $1266.
- That’s not far below the current $1320 area lows, so it’s very important that investors don’t panic. Instead, prepare to start buying at $1266, if gold goes there.
- For investors who can’t fight their personal fear of lower prices, put options are the best solution.
- The key fundamental question right now is, “what demand factor can overwhelm the ETF selling?” Well, if gold were to decline to the $1200 area, Indian scrap sales, which are already dropping, could cease altogether.
- What about the short term? Please click here now . I think a test of the $1400 area is coming, but not yet. First, I think gold will retest the highs near $1435. This chart also provides a closer look at the supposed “bear flag” pattern. I don’t see a flag at all. I see a bottoming process, fuelled by dwindling Indian scrap sales and central bank purchases. You should be ready to buy at $1266, but $1470 is the more likely price objective, in the immediate term!
Apr 23, 2013
Stewart Thomson
Graceland Updates
website: www.gracelandupdates.com
email for questions: stewart@gracelandupdates.com
email to request the free reports: freereports@gracelandupdates.com
| Tuesday Apr 23, 2013 Special Offer for 321Gold readers: Send an email to freereports@gracelandupdates.comand I’ll send you my free “GDX & GDXJ Rise From The Ashes” report. Learn why I’m an aggressive buyer of gold stock here, and how to use put options to protect your positions! |

- Markets in Asia were mostly lower in overnight trading. The Japanese Nikkei fell 0.3% while the Shanghai Composite dropped 2.6%. European markets are higher across the board, with Spain leading the way, currently up 1.6%. In the United States, futures point to an unchanged open.
- HSBC’s flash China manufacturing PMI fell to 50.5from last month’s 51.6 reading, missing expectations of a tick down to 51.5. Any number over 50 indicates expansion, so this latest reading indicates that manufacturing activity just barely continues to grow.
- The German manufacturing PMI fell to 47.9 in Aprilfrom last month’s 49 reading, indicating an accelerating pace of contraction in Germany’s manufacturing sector. French manufacturing PMI rose to 44.4, ahead of estimates for a tick up to 44.1 from last month’s 44 reading. While the positive surprise is welcome, the numbers still suggest a deep contraction in French manufacturing.
- According to the latest polling, Italy’s center-left party, which came out ahead in national elections several weeks ago, has now fallen into third place, behind Silvio Berlusconi’s center-right coalition and Beppe Grillo’s anti-establishment 5-Star Movement. The center-left party has suffered significant setbacks as it failed to form a government in the wake of the elections. Last week, its leader, Pier Luigi Bersani, resigned.
- Netflix reported first quarter earnings that exceeded analysts’ consensus estimates, while revenues were right in line with expectations. The company added 3 million new subscribers in the quarter. Shares rose 24% in after-hours trading.
- Coach is expected to report earnings of $0.81 per share and revenues of $1.18 billion this morning before the opening bell. Johnson Controls, also out this morning, is expected to report earnings of $0.42 per share on revenues of $10.48 billion.
- The first economic data release in the United States is Markit’s flash PMI reading for April, due out at 8:58 AM ET. Economists expect the headline index to moderate to 53.9 from last month’s 54.6 reading, indicating a slowing yet robust pace of expansion in American manufacturing this month.
- Released immediately thereafter at 9 AM is the February House Price Index. Economists predict that house prices rose 0.7% in February after advancing 0.6% in January.
- March new home sales figures are released at 10 AM. Economists predict sales rose 1.2% from the previous month to a seasonally adjusted annual rate of 416,000 units after registering a 4.6% decline in sales in February.
- The Richmond Fed’s monthly index of regional manufacturing conditions is also out at 10 AM. Economists expect the index to fall to 2 from last month’s 3 reading. Follow all of the data LIVE on Business Insider >
- BONUS: Real Housewives of Atlanta star Porsha Stewart says she first found out about her divorce from former NFL quarterback Kordell Stewart on Twitter.

Market Psychology changes from bullish to bearish…to bullish…whether it’s Gold or AAPL or Nat Gas…or any other market…our job as traders/investors is to try to CLEARLY SEE if a market is in bullish mode or bearish mode and trade accordingly…we want to avoid the confusion that comes from trading a market the way we think it OUGHT TO BE rather than the way it is.
Record volume and a huge price break may signal a downside capitulation in gold:
We saw all-time high (ATH) volume of ~750,000 contracts in Comex gold futures on Monday April 15 as prices fell more than $160. The previous ATH record daily volume was ~ 500,000 contracts made on Nov 28/2012…also a big down day. Last week’s volume was also an ATH weekly record.
On April 16 gold prices made a 2 ½ year low…down ~$610 (over 30%) from the September 2011 ATH of $1930 (hitting several downside targets – Greg Weldon.) In 5 trading days (Apr 10 to 16) gold dropped ~$268 or ~17%. The record high volume and dramatic price break may signal a downside capitulation…and indeed the gold price has rebounded over $100 from the April 16 lows.
Gold Shares/Indices:
American Barrick touched levels ($17.50) not seen since the depths of the 2008 wipeout. ABX was $42.00 just last September…it had several ATHs above $55 in 2011.
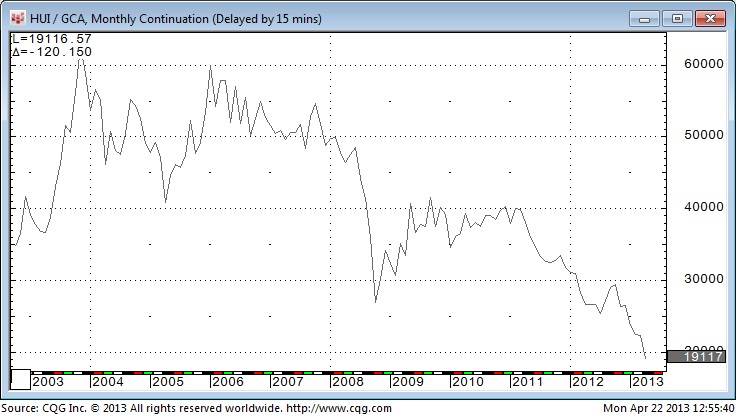
The broader gold share indices (GDX, HUI) held up better than ABX but the ratio of the gold share indices to gold dropped to a new 12 year low last week…the momentum of the decline in gold share indices relative to gold has accelerated sharply since October of last year. On this blog and on Moneytalks radio I have repeatedly cautioned against buying gold shares because they were CHEAP…when a market is going down you have no idea how far down DOWN IS!
….continue reading HERE

-
I know Mike is a very solid investor and respect his opinions very much. So if he says pay attention to this or that - I will.
~ Dale G.
-
I've started managing my own investments so view Michael's site as a one-stop shop from which to get information and perspectives.
~ Dave E.
-
Michael offers easy reading, honest, common sense information that anyone can use in a practical manner.
~ der_al.
-
A sane voice in a scrambled investment world.
~ Ed R.
Inside Edge Pro Contributors

Greg Weldon

Josef Schachter

Tyler Bollhorn

Ryan Irvine

Paul Beattie

Martin Straith

Patrick Ceresna

Mark Leibovit

James Thorne

Victor Adair