

Market Psychology changes from bullish to bearish…to bullish…whether it’s Gold or AAPL or Nat Gas…or any other market…our job as traders/investors is to try to CLEARLY SEE if a market is in bullish mode or bearish mode and trade accordingly…we want to avoid the confusion that comes from trading a market the way we think it OUGHT TO BE rather than the way it is.
Record volume and a huge price break may signal a downside capitulation in gold:
We saw all-time high (ATH) volume of ~750,000 contracts in Comex gold futures on Monday April 15 as prices fell more than $160. The previous ATH record daily volume was ~ 500,000 contracts made on Nov 28/2012…also a big down day. Last week’s volume was also an ATH weekly record.
On April 16 gold prices made a 2 ½ year low…down ~$610 (over 30%) from the September 2011 ATH of $1930 (hitting several downside targets – Greg Weldon.) In 5 trading days (Apr 10 to 16) gold dropped ~$268 or ~17%. The record high volume and dramatic price break may signal a downside capitulation…and indeed the gold price has rebounded over $100 from the April 16 lows.
Gold Shares/Indices:
American Barrick touched levels ($17.50) not seen since the depths of the 2008 wipeout. ABX was $42.00 just last September…it had several ATHs above $55 in 2011.
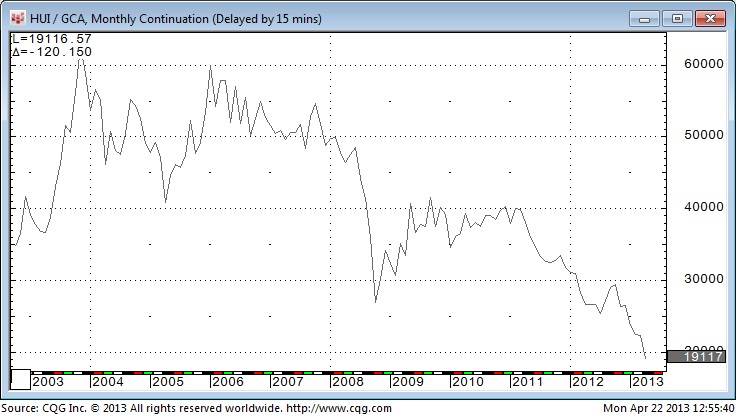
The broader gold share indices (GDX, HUI) held up better than ABX but the ratio of the gold share indices to gold dropped to a new 12 year low last week…the momentum of the decline in gold share indices relative to gold has accelerated sharply since October of last year. On this blog and on Moneytalks radio I have repeatedly cautioned against buying gold shares because they were CHEAP…when a market is going down you have no idea how far down DOWN IS!
….continue reading HERE


