Bonds & Interest Rates

The Great Debate: Economy Or Markets

In any contest there can only be one victor. For investors – that contest is between the markets and the economy. Only one can be ultimately be right. Historically, the stock market has led the economy by reflecting investors’ expectations of a deteriorating or expanding economy. We no longer live in normal historical times.

There is little doubt that the ongoing interventions of the Federal Reserve is having an artificial effect on asset prices. Since the end of the financial crisis there has been a 85% correlation between the rise of the Fed’s balance sheet and the rise of asset prices. However, the economy has only grown by roughly 1.5% during that same period of time and employment growth has failed to keep pace with population growth.

The ongoing disconnect between the market and the real economy has become glaringly obvious in recent months. This week will take a look at the latest GDP report – was the bump to 2.5% due to the temporary effects of Hurricane Sandy or were there signs of organic growth. The outcome of this analysis will be very important to the future of the stock market participants.

Despite the Central Bank interventions, which are distorting asset prices, eventually economic reality will collide with market fantasy.   It is then that the greatest damage is incurred by investors who have been lured into complacency.

The Great Debate: Economy Or Markets

In any contest there can only be one victor. For investors – that contest is between the markets and the economy. Only one can be ultimately be right. Historically, the stock market has led the economy by reflecting investors’ expectations of a deteriorating or expanding economy. We no longer live in normal historical times.

There is little doubt that the ongoing interventions of the Federal Reserve is having an artificial effect on asset prices. Since the end of the financial crisis there has been a 85% correlation between the rise of the Fed’s balance sheet and the rise of asset prices. However, the economy has only grown by roughly 1.5% during that same period of time and employment growth has failed to keep pace with population growth.

The ongoing disconnect between the market and the real economy has become glaringly obvious in recent months. This week will take a look at the latest GDP report – was the bump to 2.5% due to the temporary effects of Hurricane Sandy or were there signs of organic growth. The outcome of this analysis will be very important to the future of the stock market participants.

Despite the Central Bank interventions, which are distorting asset prices, eventually economic reality will collide with market fantasy. It is then that the greatest damage is incurred by investors who have been lured into complacency.

NOTE: Next week I will be in California for the annual investor conference. Please join me on our daily blog on Thursday and Friday of next week for transcripts of my favorite speakers on the markets and the economy

There will be no newsletter next weekend due to travel. But I willv update analysis on our blog if anything important occurs.


GDP – A Disappointing Miss

For the last several months I have been consistently writing that the economy was much weaker than headlines, particularly the media, suggested. This really begin to show up in the 4th quarter of 2012 has the economy churned out a growth rate, if you can call it that, of just 0.1%.

We stated several times during that period that Hurricane Sandy would give a slight bump to GDP due to inventory draw downs and rebuilding, post- hurricane construction and development, and automobile replacement. It is the old theory of the “broken window” which states that if a window is broken it creates economic activity because the window has to be replaced.

The problem with that theory is that you are replacing things that had already been built or bought. Therefore, the dollars spent replacing items are detached from future purchases to boost further economic growth. This “drag forward” of activity ultimately leaves a “hole” in the future.

The chart below shows our economic composite indicator which we discussed in detail recently stating:

“The EOCI is a composite index consisting of the CFNAI, the Chicago PMI, the ISM Composite Index (an average of the Manufacturing and Non- Manufacturing Surveys), several Federal Reserve manufacturing surveys, the NFIB Small Business Survey and the Leading Economic Indicators. This index is meant to cover a broad measure of economic inputs to provide a clearer understanding of what is occurring in the overall economy.”

For March the index ticked up to 30.16 from 29.96 in February. The bounce in the data can be primarily attributed to a surge in economic activity in the later part of 2012 and early 2013 due to Hurricane Sandy. However, recent data readings suggest that much of that activity has occurred and weakness in the underlying data is likely to return over the next few months at least. Importantly, readings below 30 have historically been associated with the onset of recessions.

Screen shot 2013-04-28 at 9.45.03 PM


…..Download the latest 23 X-Factor Newsletter HERE

Faber: U.S. Stocks overbought, could Crash this summer

Unknown-1U.S. stocks are overbought, , and any more near-term gains are going to be big trouble for the market. As we continue to move higher, the probability of a crash becomes higher as well. The next crash, he says, could be worse than the one that crushed world markets in 2008. “The next crisis could lead to a deflationary bust. And a bust in governments. In other words, we may have a total collapse in confidence in the system.” – in CNBC

It is not a very good time to Buy Stocks

Marc Faber: “We could on the S&P make a new high,” “but with very few stocks making new highs.” “It’s not a very good time to buy stocks,” Faber warned, arguing that stocks are not at the beginning of a bull market as many analysts have predicted on “Squawk Box” over the past few weeks. “The next crisis could lead to a deflationary bust. And a bust in governments. In other words, we may have a total collapse in confidence in the system.” – in a recent interview on CNBC

WE ARE JUST CLIMBING TO A HIGHER DIVING BOARD

Marc Faber: “I love it because we are just climbing to a higher diving board…if we don’t get the correction in February or March and we go straight up like in ’87, the probability of a crash increases.” – in Bloomberg Surveillance
 

WE ARE CREATING BUBBLES AND BUBBLES AND BUBBLES

 Marc Faber : “We are creating bubbles and bubbles and bubbles. This bubble will come to an end. My concern is that we are going to have a systemic crisis where it is going to be very difficult to hide. Even in gold, it will be difficult to hide.” – in Bloomberg Surveillance
 
 
About Marc Faber:
 
Marc Faber is a Swiss investor. Faber is publisher of the Gloom Boom & Doom Report newsletter and is the director of Marc Faber Ltd which acts as an investment advisor and fund manager. These postings above can be found on his marcfaberchannel.blogspot.ca


Michael’s HOT Interview W/ Jim Rogers: Listen Here

Screen shot 2013-04-27 at 12.12.12 PMListen HERE to the Legendary Jim Rogers was Michael’s Money Talks Guest for April 27th . Amazing? Yes, for after attending Yale and Oxford University, Jim Rogers co-founded the Quantum Fund, a global-investment partnership. During the next 10 years, the portfolio gained 4200%, while the S&P 500 rose less than 50%. One of the most significant investors, right up there with Warren Buffet, Rogers has to be one of the most difficult interviews to obtain. It was only because Michael is such a respected man that Jimmy Rogers agreed to be Money Talks guest on Saturday April 27th . Listen to Rogers perspective and advice on all the markets, with a special focus on one of the markest he likes – Gold – in the “Latest Radio Show & Michael’s Market Minute section you can access in full HERE 


The Grandest Larceny of All Time – Recovery for the Rich

Gold seems to be coming back fast. It rose $38 per ounce yesterday.

Of course, the Fed’s monetary meddling doesn’t work. And it will most likely cause a financial disaster.

But the biggest scandal of today’s central bank policy is that it is essentially the grandest larceny of all time.

The normal ways in which wealth is distributed may not be perfect, but they are the best nature can do. People earn it. They save it. They steal it. Or they get richer by investing.

Or they just get lucky…

Normally, in other words, wealth ends up being distributed in an unplanned and uncontrolled way. People do their best. The chips fall where they may.

But along come the central banks. They’re creating a new type of wealth. It is not wage income. It is not the product of capital investments. It is not the result of technology or productivity increases or hard work or self-discipline… or any of the other things that lead to wealth and prosperity.

Instead, it is created by the central bank “out of thin air.”

Not Your Grandfather’s Wealth

This new wealth is not like the regular kind. These chips don’t fall where they may; they get pushed around first.

The Fed creates new money (not more wealth… just new money). This new money goes into the banking system, pretending to have the same value as the money that people worked for. And people with good connections to the banks take advantage of the cheap credit this new money creates to aid financial speculation.

That’s what we’ve been watching in the financial markets for the last four years.

From Chris Martenson at PeakProsperity.com:

The central plank of Bernanke’s magic recovery plan has been to get everybody back borrowing, spending and “investing” in stocks, bonds and other financial assets. But not equally so, as he has been instrumental in distorting the landscape toward risky assets and away from safe harbors.

That’s why a two-year loan to the US government will net you only 0.22%, a rate that is far below even the official rate of inflation. In other words, loan the US government $10 million and you will receive just $22,000 per year for your efforts and lose wealth in the process because inflation reduced the value of your $10 million by $130,000 per year. After the two years are up, you are up $44,000 but out $260,000, for a net loss of $216,000.

That wealth, or purchasing power, did not just vanish: It was taken by the process of inflation and transferred to someone else. But to whom did it go?

Where do the chips come to rest?

While the Fed punishes honest savers, stocks and bonds rise every time a hint of more money printing is announced. And the yacht sales continue to rise, too, as long as the Fed promises more.

A Recovery for the Rich

The result? From Pew Research:

During the first two years of the nation’s economic recovery, the mean net worth of households in the upper 7% of the wealth distribution rose by an estimated 28%, while the mean net worth of households in the lower 93% dropped by 4%, according to a Pew Research Center analysis of newly released Census Bureau data.

From 2009-2011, the mean wealth of the 8 million households in the more affluent group rose to an estimated $3,173,895 from an estimated $2,476,244, while the mean wealth of the 111 million households in the less affluent group fell to an estimated $133,817 from an estimated $139,896.

These wide variances were driven by the fact that the stock and bond market rallied during the 2009-2011 period while the housing market remained flat.

Affluent households typically have their assets concentrated in stocks and other financial holdings, while less affluent households typically have their wealth more heavily concentrated in the value of their home.

From the end of the recession in 2009 through 2011 (the last year for which Census Bureau wealth data are available), the 8 million households in the US with a net worth above $836,033 saw their aggregate wealth rise by an estimated $5.6 trillion, while the 111 million households with a net worth at or below that level saw their aggregate wealth decline by an estimated $0.6 trillion.

There may be a “recovery” going on. But it is a recovery for the rich, not for the middle class.

Regards,

Bill

Ed: Found this chart of the US Dollar, which obviously needs to be updated

usapower

Trends in Asset Classes set to Shift

The latest warning sign on US equities came from the recent issue of Barron’s. A recent survey of big money managers showed extreme bullish sentiment. 86% polled were bullish on stocks over the next six to 12 months while only 7% were pessimistic. Meanwhile only 11% were bullish on bonds. The cover of Barron’s emphasized the view of the participants with its title “Dow 16,000” and picture of a bull, leaping away from a bear. In regards to Gold and commodities, 50% were bullish on commodities with 35% bullish on Gold.

I’ve provided a chart from the recent Merrill Lynch Fund Manager survey which I find more instructive. It shows fund managers as the most underweight commodities since January 2009. Also note that commodity prices have yet to surpass their 2012 low though fund managers are more bearish than at that time.

abc

So we have extreme bullish sentiment on stocks and a different view on bonds and commodities. If equities are due for a fall, which asset class would benefit? My initial guess would be bonds. In recent months commodities have really struggled while bonds have started to turn higher amid negative sentiment. The bullish consensus is only 43% for bonds. Last summer when bonds peaked it was 80%. The fact that bonds are rallying amid terrible sentiment is a sign of strength and sustainability. More money could move into bonds and propel them to another all-time high while stocks go sideways and commodities try to find a bottom.

With respect to hard assets, let’s remember that fears of deflation often act as a catalyst for Gold and commodities. Need an example? How about the performance of gold stocks from 1931 to 1935. Commodities were in a bull market from 1933 to 1951. Remember the fears of deflation in 2001 and 2002? That was a marvelous time to buy commodities. Oh and let us not forget 2008. This is not to say you should run out and buy commodities at this moment. Fears of deflation usually instigate large declines in precious metals and hard assets before they eventually rebound and move much higher. That is what history tells us.

History also shows us that Gold can rally with bonds. The chart below shows bonds, Gold and a 50-week rolling correlation between the two. We’ve highlighted times when both assets have gained together. Also note how often the correlation is in positive territory.

apr26edgoldbonds


Given that precious metals usually lead commodities, it’s possible that precious metals have discounted to a large degree the coming breakout in bonds and growing fears of deflation.

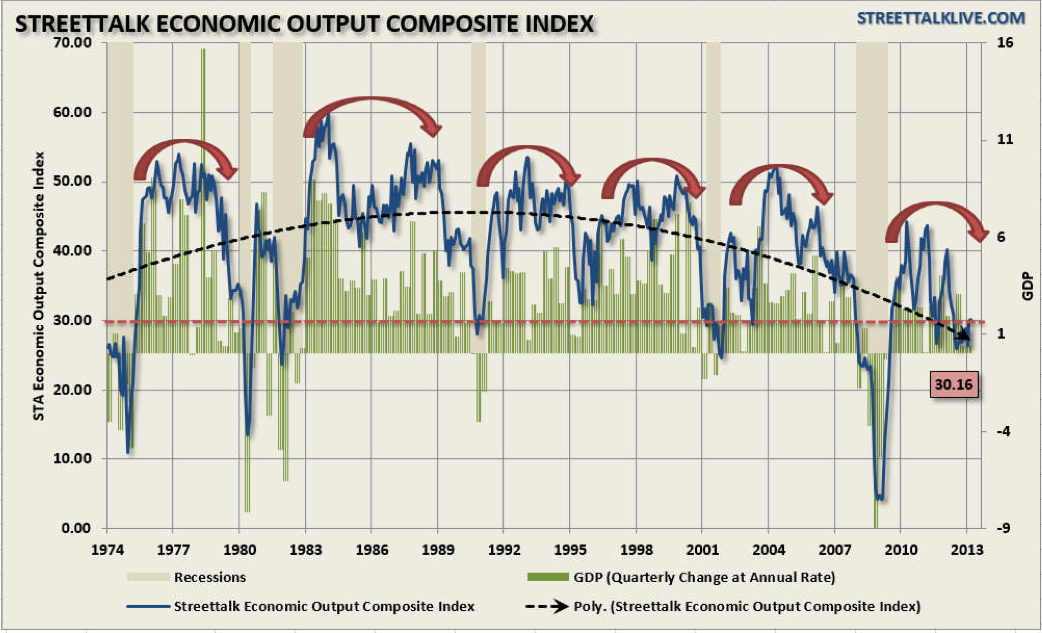
Why do stocks continue to perform well? The market is being lead by safe sectors and dividend paying companies. Investors are not worried about inflation but they are worried about the economy. Thus, they have piled into safe dividend paying companies where they can get yield better than most bonds.

Europe is mired in recession and the only positive, Germany, looks headed for recession. This would obviously bode well for bonds and precious metals being so oversold, could rally on hopes of some action from the ECB.

In the coming weeks and months, look for bonds to assume market leadership, stocks to stagnate and precious metals to recover some losses from the devastating selloff. This view is not only supported by technicals and sentiment but by economic fundamentals. Weakness in Europe is spreading to Germany while the US economy is likely to slow further in the spring (if it’s even mathematically possible to slow from an already slow rate).

More importantly, the relationship between precious metals and stocks (over the past 20 months) is very instructive. Precious metals have performed poorly recently because of receding inflation and because stocks have performed well. (When stocks perform well, precious metals will struggle). As we noted above, stocks are performing well because dividend yields are higher than you can get in a savings account or on government bonds. It’s a safe-haven, anti-inflation play that is a step up (risk-wise) from bonds. Ultimately, when inflation picks up (late 2014) money will move out of stocks and bonds and into precious metals and secondarily, commodities. That is the big driver for the next cyclical bear market in stocks, the start of the next secular bear market in bonds and the final cyclical bull market in precious metals and commodities.

As for the short-term, I would watch precious metals miners for hints. The stocks lead the metals and they lead this big move down. Currently they are more oversold than 2008 (according to RSI, bullish percent index and volume) and have started to rally a bit. Look for the HUI to fill its gaps up to 320 in the short-term. If you’d be interested in professional guidance in uncovering the producers and explorers poised for big gains in the next few years then we invite you to learn more about our service.  

Good Luck!


Jordan Roy-Byrne, CMT

Jordan@TheDailyGold.com


test-php-789