
Personal Finance

»» Commodities and commodity stocks bounced back, and equities rallied— a reversal of the previous week.
»» With lackluster economic data and few signs of impending improvement,
why have many equity markets remained close to their recent highs? (page 2)
»» Up Next: The Fed and ECB. (page 3)
»» Global Roundup: Overview of U.S. corporate bond issuance, analysis of U.K.
GDP and European earnings, and highlights of Chinese and Japanese data. (page 3 & 4)
For the complete report as well as Daily Updates CLICK HERE.

The Wall Street Journal had an especially colorful metaphor to describe what has happened to the price of gold that fateful week when gold tumbled 13% in the two sessions through April 15, the biggest drop in 33 years. “Slick with the viscera of crushed gold bugs, the world’s trading floors look even more treacherous than usual.”
Do we feel like crushed bugs? Not at all.
Do we think that the bull market in gold is over? Not yet.
Do we know that markets can be cruel? Hell, yes.
Needless to say the gold bears have been feeling lately like they have landed in a huge vat of honey. They are smug, to say the least. But we see this as an opportunity to get back into gold at a lower price and in the meantime, we made money shorting some of the downside (and on the pullback). We are not alone. Jim Rogers, who foresaw the start of a commodity secular bull market in 1999, said this may be the correction that gold needs. “If it goes down enough, I will start buying it,” he told reporters.
Marc Faber, publisher of the Gloom, Boom & Doom report, could hardly contain his glee at the opportunity offered by the steep drop. “I love the fact that gold is breaking down because it will give a good entry point. The fundamentals for gold are intact.”
He pointed out that while gold may be down 21% from its September 2011 high, Apple is 39% lower than last year’s high. The S&P is almost 1% higher than its peak in October 2007, but over the same period gold is up 100%.
Pundits have given a garden variety of reasons for the decline. We have already covered some of them in our last essay. But there’s more — Goldman Sachs in an April 10 report reduced its gold futures forecast and made a self-fulfilling prophecy to short gold, hurting gold sentiment and likely triggering stop-loss orders. (They must be laughing all the way to the bank. Wait, they are the bank.) Cyprus said it might unload 10 tons of reserves to help fund its bank bailout — the biggest sovereign sale for several years. It stoked fears that similar gold sales may be forced on other troubled Eurozone countries. Italy has the fourth largest gold holdings in the world of 2,452 tons.
Gold prices have been slowly gaining back some of the lost ground as traders and investors step in to buy bargains. Since making the call that started the downward spiral Goldman Sachs has covered its gold short this week.
There has been strong demand for physical gold, especially from Asia, which continues to underpin the gold market. Asia is witnessing one of the strongest waves of physical gold buying in 30 years. Retail sales of gold tripled across China April 15 to April 16, the China Gold Association said. The feverish buying has left many of Hong Kong’s banks, jewelers and even its gold exchange without enough gold to meet demand.
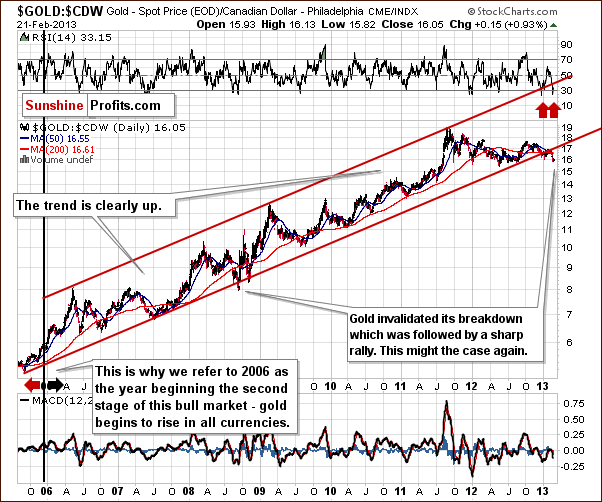
Is it time to be back in the market? Let’s take a look at gold charts to find out (charts courtesy ofhttp://stockcharts.com).

On the above long-term gold chart, we see a pullback, which will be more visible when we zoom closer in our next chart. A local bottom may have been reached, though it seems that further declines are likely.
At this point, this major long-term cycle is still several weeks away, and with the precision of this cycle in the past, we expect that the final bottom will be seen much closer to it than what we’ve seen recently.
Please note that gold could decline to as low as $1,100 and still be in a long-term uptrend. In fact, technically, it could decline all the way to the 61.8% Fibonacci retracement level close to $900 and still remain in a bull market.
Let us now zoom in a bit and see how the situation looks like from the medium-term perspective.

In the chart, we saw a correction last week as gold’s price rallied first to the 38.2% Fibonacci retracement level and after a brief pause, moved to the second one (50%) — on Friday it closed slightly below it. Prices are currently consolidating around this level and the correction could actually be over. We have a situation where a moderate pullback was already seen — the bound is no longer likely because it was already seen. The RSI indicator reflects that — the market was extremely oversold on a short-term basis, but it’s no longer the case.
We see that volume levels were low on Wednesday when prices rallied, the same happened on Thursday and volume peaked on Friday where the price actually declined, which is not a good sign and suggests that further declines are likely.
Now, we’ll have a look at Dow:Gold ratio to see whether it indicates any important moves for gold.
Click to enlarge.
Here, we see that the ratio moved close to the declining resistance line but didn’t really reach it. There is still some room for the ratio to move higher. If gold declines to its previous low or slightly lower, this declining resistance line will be reached, so basically further weakness could be seen here. The important point here is the Dow to gold ratio chart does not imply a move higher for gold prices just yet.
Summing up, generally this week’s gold charts indicate that the yellow metal’s decline is not over yet. To the contrary, it could take a few more weeks before the rally really starts. There are also some indications that the correction (within the decline) is already over or close to being over.
Thank you for reading. Have a great and profitable week!
About the Author

Przemyslaw Radomski, CFA, is the founder, owner and the main editor of SunshineProfits.com.
STOCK MARKET – ACTION ALERT – NEUTRAL – SELL ‘MAY AND GO AWAY’. AT THE VERY LEAST, I HAVE BEEN LOOKING FOR A CORRECTION DOWN TO 14,150 IN THE DJ. That said, A Dow at 16000 and an S&P 500 at 1700 are not unreasonable targets over the next year or so.
Ed Note: I found this table listing the May Performances back to 1928
 With the month of May beginning today, we wanted to highlight the best and worst S&P 500 performances during the month since 1928. Overall, the S&P 500 has averaged a decline of 0.15% during the month, which is among the weaker average monthly performances of the year.
While investors debate the merits of ‘Sell May and Go Away’, it is worth pointing out that May has increasingly become a volatile month in recent years. Two of the ten worst months of May going all the way back to 1928 have both occurred during the current bull market (2010 & 2012). Furthermore, one of the ten best Mays of all time also came during the current bull market (2009). In other words, three of the four Mays during the current bull market have qualified as one of the ten best or worst Mays of all time. That leaves 2011 as the only year where May was not one of the ten best or worst Mays ever. In that year, the S&P 500 declined 1.4%. With the month of May averaging a decline of 2.64% during the current bull market, you can’t blame bulls for wanting to take the month off in 2013.
Turnaround Tuesday certainly had its impact in early trading yesterday with the Dow Industrials off 85.00 points, but the market (with the help of the PPT) rallied with the S&P 500, Nasdaq 100, the VTI and the NYSI posting new bull market highs. With the Fed on tap tomorrow and the European Central Bank after that, traders were content to sit this one out, making it a pretty slow day. Tthe Dow Jones Industrial Average (DJI) was able to post its 16th consecutive positive Tuesday. This is an all-time record for Tuesdays, and is within shouting distance of the Dow’s streak of 24 consecutive Wednesday wins posted in 1968.
For the first time in more than 20 years, Apple Inc. (NASDAQ:AAPL) announced plans to sell debt and will issue $17 billion in bonds. The market reacted positively to this news, sending the shares more than 3% higher. (CNBC).
The prices of single-family homes rose 9.3% in February, the largest year-over-year increase in nearly seven years, per the S&P Case-Shiller home price index. All 20 metropolitan areas tracked by the index enjoyed positive gains on the housing-price front. (The Washington Post).
The prices of single-family homes rose 9.3% in February, the largest year-over-year increase in nearly seven years, per the S&P Case-Shiller home price index. All 20 metropolitan areas tracked by the index enjoyed positive gains on the housing-price front. (The Washington Post).
Consumer confidence ticked up to 68.1 in April from 61.9 last month, as the percentage of respondents expecting improved business conditions over the next six months rose to 16.9% from 15% in March. (Los Angeles Times).
The Dow Jones Industrials were up 21.05 at 14839.80 or +0.14%. On April 19 we traded down to 14444.03 which was a new low as compared to the 14887.51 record high from April 11. The October, 2007 peak of 14198.10 is a theoretical pullback number, but unless we take out 14444.03, forget about the correction to 14198.
The Dow Transports were up 27.92 at 6177.95 or +0.45%. The Transports have held recent lows: 5902.82 from April 15 and 5878.12 from April 5. That’s a positive. The Transports formed a double-top, i.e., 6215.90 from April 10 versus 6291.65 from March 19. That’s a negative. Confirmation of the resumption of the decline would be confirmed under the April 5 low of 5878.22, look for the 5500-5600 area as next support. Bigger picture, possible bullish reverse ‘head and shoulders’ patterns have formed: 1) From July, 2011 to present and 2) May, 2008 to present. The upside measurements are astronomical anywhere from 2600 points from the former to 3400 points to the latter ABOVE CURRENT HIGHS! If this is true and if the Transports are indeed the market leader I believe it is, we have a long way to go in this bull market! But, we would have to take the ‘double-top’ first to give this bullish scenario any more credence.
The S&P 500 was up 3.96 or +0.25% at 1597.57, a new bull market high! I have written it sure likes we’re headed to 1625.00 in the SPX. That said, the next theoretical downside target is 1497 if and when we take out 1536.03.
The Nasdaq Composite closed at a new bull market high of 3328.79 up 21.77 or +0.66% .
The broad-based NYSI (New York Stock Exchange Index) was up 31.66 at 9276.88 or +0.34% which is a new bull market high.
The CBOE Volatility Index (VIX), which measures the cost of using options as insurance against declines in the S&P 500 (i.e., the higher the number, the more fear in the marketplace) is down .19 at 1352. On April 18 it surged to 18.20 intraday. On Friday, March 15, it traded as low as 11.21, the lowest level since February 2007, so I guess these are our parameters going forward. The higher we go in the VIX, the more likely a bear cycle is upon us. It looks like we may be headed into the 20s.
—————————————-
Welcome To VRTRADER.COM Trial Signup:
The 30 day trial is allowed one time only. By taking this 30 day 50% trial, you agree to be charged the full cost of the monthly Silver or Platinum service (choose one only) at the end of the 30 day trial subscription period, unless you cancel first. The regular Silver monthly rate is $55.00 and the Silver quarterly rate is $145.00. The regular Platinum monthly rate is $145.00 and the Platinum quarterly rate is $390.00.
Michael Campbell’s EMERGENCY GOLD SUMMIT – MAY 23 in Vancouver! The big four who predicted the drop in gold will you what’s next: Mark Leibovit, Martin Armstrong, David Bensimon and Michael Campbell.
http://moneytalks.net/2013-world-outlook-financial-conference-event-info.html
About Mark Leibovit
Mark Leibovit, CIMA, is Chief Market Strategist for VRTrader.Com. His technical expertise is in overall market timing and stock selection based upon his proprietary VOLUME REVERSAL ™ methodology and Annual Forecast Model.
He began his, thus far, 35 year career in the financial industry as a market maker on the Chicago Board Options Exchange where he made a market in such issues as Newmont Mining and later continuing on to serve as Director of Research at Rodman and Renshaw. He is both a Certified Investment Management Analyst (CIMA) and Accredited Investment Fiduciary (AIF) and is also a member of the Market Technicians Association (MTA) and the CFA Institute. Mr. Leibovit’s extensive media profile includes seven years as a consultant ‘Elf’ on Louis Rukeyser’s WALL STREET WEEK television program and over thirty years as a ‘Market Monitor’ guest for PBS’ THE NIGHTLY BUSINESS REPORT. His specialty is Volume Analysis and his proprietary Leibovit Volume Reversal Indicator is well known for forecasting accurate signals of trend direction and reversals in the equity, metals and futures markets. His comprehensive study on Volume Analysis , ‘The Traders Book of Volume’ was recently released by McGraw-Hill. Mr. Leibovit is currently Timer Digest’s #2 Gold Market Timer for 2011 and has also been named the #1 Gold Market Timer for the 5 year period ending in 2010. And, he was named the #1 Intermediate Market Timer for the 10-year period ending in 2007.
Past performance does not guarantee future results.

 The fall of gold is a major story, yet the bigger story is the weakness of commodities as an asset class we are seeing right now.
After a decade of climbing prices, commodity bulls should be relieved to see stabilization.
In the late 1990s, as the dot-com bubble burst and once-high-flying tech stocks came crashing back down to Earth, another important global macroeconomic event was taking place across the globe that would have far-reaching implications for the world economy for years to come: the rise of China as an economic superpower.
While the two events aren’t necessarily correlated, the latter has had a major impact on global economic output, with a specific effect on commodities.
It is not a stretch to claim that China may now be the most important global driver in the commodities markets. For instance, China now accounts for more than 30 percent of consumption in key base metals such as iron ore and copper. China is on track to import more crude oil than the United States next year, a fact that would have been quite unthinkable in the late 1990s. And China is the largest purchaser of many soft commodities, such as soybeans and corn.
Many countries have depended heavily on the Chinese consumer market for these raw materials, which has helped countries in the Persian Gulf, Latin America and Africa to ship gargantuan amounts of raw materials to the Asian nation. In the process, many governments in these countries ran up huge trade surpluses and many businessmen generated lots of value by taking advantage of this unique trade wave.
Troubles In China?
As the saying goes, whatever goes up must come down, and China has been on an uptrend year in and year out for over a decade. As many countries were relying on Chinese growth above double digits, when that growth is removed, a lot of people start feeling the pain. The weakness we’re seeing right now in the commodities markets across the board can be traced back in some form to the decline in Chinese economic activity.
China is expected to grow 7.7 percent this quarter, well below the double digits of a few years ago, and also below the 7.9 percent from this quarter. While any country would be envious of enjoying growth in the high single digits, those numbers are so ingrained in economic models that even a slight miss will have a devastating impact on industries relying on that growth—and this also includes commodities.
…..read page two HERE


Fifteen Days in April
Editor’s note: Assembled below are fifteen of the best insights and observations on one of the strangest and confusing fifteen day periods in the history of the gold market — a flash crash, a global rush to purchase and a healthy bounce.
1. Peter Grant/USAGOLD (as quoted at Kitco News):
“The price discovery occurs in the paper market. The paper market drove the price down for physical. And there had been a large amount of pent-up demand that just absolutely came out of the woodwork. We were as busy last week and into this week as we’ve been since the financial crisis of 2008-09. It was absolutely unbelievable demand for physical. Physical buyers are not speculators,” he continued. “Our clients are primarily concerned with wealth preservation, portfolio diversification, hedging and so forth. They are not speculators. When the paper market provides a gift (of lower prices), and it was an unnerving gift to be sure…the physical buyers do indeed tend to come out in force to underpin the market.”
2. Chris Hart/Johannesburg Sunday Times:
“Of major interest is the state of the physical market. Over the past six months, gold has been subjected to relentless selling and has frequently been ‘bombed’ — where a large number of contracts are dumped on the New York Commodities Exchange (Comex) over a very short period. On April 12 the market was bombed with more than 500 tons of gold in a manner that caused great downward price pressure and panicked the market into selling. . . The drop in Comex inventories [See Egon von Greyerz below], U.S. gold trade data and Hong Kong trade data suggest the mobilisation of physical gold has resulted in a large transfer from western to eastern vaults.
3. Egon von Greyerz/Matterhorn Asset Management, Switzerland,KingWorldNews:
“Coming back to what is happening in the gold market, it’s extraordinary. The attack on the gold price through the paper market has totally backfired and failed. The $300 drop that we saw, in a few days, has already retraced 50%. That’s nothing compared to what will happen.
The attack in the paper market was always doomed to fail in the light of unprecedented demand and major shortages in the physical market. If you look at the Shanghai gold exchange, deliveries from January are 1,030 tons. That (1,030 tons) is against world gold production for the same period (since the beginning of 2013) of only 934 tons. That is absolutely astonishing volumes (of physical gold demand) you are talking about in China.
If you look at JP Morgan, their eligible gold, which is the stock they can deliver, has been down 65% just in the last couple of days. And COMEX, their stock is also down to about half of what it was over a year ago. Premiums now in Singapore are up $3 per ounce. If we now look at the Swiss refiners, remember Swiss refiners refine 70% of the world’s gold, the Swiss refiners are increasing premiums substantially.”
….read 4-15 HERE


-
I know Mike is a very solid investor and respect his opinions very much. So if he says pay attention to this or that - I will.
~ Dale G.
-
I've started managing my own investments so view Michael's site as a one-stop shop from which to get information and perspectives.
~ Dave E.
-
Michael offers easy reading, honest, common sense information that anyone can use in a practical manner.
~ der_al.
-
A sane voice in a scrambled investment world.
~ Ed R.
Inside Edge Pro Contributors

Greg Weldon

Josef Schachter

Tyler Bollhorn

Ryan Irvine

Paul Beattie

Martin Straith

Patrick Ceresna

Mark Leibovit

James Thorne

Victor Adair