Gold & Precious Metals

The Cross of Death A Dead Cat Bounce & Lots of Money

In the last seven months or so we have seen the Gold Bugs index, HUI, fall from 520 in October 2012 to 283 today 01 May 2013, registering a loss of 45% in the value of its constituents. The last four weeks has seen the HUI drop 100 points followed by a bounce of 23 points. Many are of the opinion that the bottom is in and are hopeful of a decent rally from this point in order to restore some normality to this tiny sector and repair their investment accounts. The chart below depicts the plight of the gold miners and the severity of the recent carnage that has decimated the stock prices at a time when they need all the friends they can get.

The HUI Chart:

Screen shot 2013-05-03 at 2.08.06 AM

Their fortunes are predicated on the gold and silver prices and unfortunately they have been put to the sword in what might be seen as a final capitulation as disgruntled investors throw in the towel and take their hard earned cash to more favourable pastures. The stock market in general would be an obvious candidate as it heads relentlessly higher as the S&P500 flirts with the 1600 level.

The Gold Chart:

Gold Chart 01 May 2013

….continue reading about:

The FOMC and the ECB

This week ushers in the FOMC meeting where policy remains pretty much unchanged as they will “increase or reduce the pace of its purchases” as necessary. We also have the latest unemployment report due, should the figures be as expected at around 150,000 new jobs then QE will continue as is, maintaining the status quo. This would do little for gold prices as it is more or less factored into analysts’ expectations. A very poor number might raise the spectre of QE being increased, but we doubt that this will happen.

We also have the European Central Bank meeting on Thursday and given that the Eurozone is up against it with rising unemployment causing great difficulties for many of its member states, a rate cut is a strong possibility. Gold prices may get a small boost should this reduction eventuate as the interest earned on the Euro becomes less attractive. Then there is the long dark shadow of a ‘bail-in’ by depositors when the next member state pleads poverty. Investors looking to avoid such events have many alternatives to consider, and the precious metals space is one of them.

Beyond these two events it is difficult to see just what will be the ignition for gold prices to go higher. The world is already a dangerous place and we are aware of the friction that exists at the pinch points and therefore the geo-political situation is already accounted for in the current price.

Physical market and the paper market

From what we understand from the dealers there is increasingly strong demand in the physical market with various mints running out of some products, however, the paper market currently determines the price so we do need to keep a watchful eye on the COMEX. Should the COMEX falter and be unable to deliver, then this could be a game changer. However, if they settled the account in cash, then the blow would be softened, after all we are living with the ABN AMRO banks decision to make cash settlements on requests for gold withdrawals. A precedent has been set and others will no doubt adopt a similar stance when investors decide to take physical delivery of their gold.

Acquisitions:

Acquisitions are good for the pipeline but not so good for the bottom line, if the newly acquired production doesn’t come on line in the next year or two. A lot can go wrong in the design/permit/construction phase and it requires an enormous amount of cash to bring a project to fruition. It’s too much to ask an investor to wait three to five years for a potential return on such an investment. Miners have to decide which the highest priority is, the interests of the investor or the expansion of their empire

The US Dollar:

The US Dollar appears to be rolling over having formed a recent double top and it has also failed in its attempt to form a higher high. The dollar had rallied largely on the fall of other currencies such and the British Pound and the Japanese Yen, however, that rally is now fading. Should the dollar’s decline accelerate then gold prices should improve in dollar terms.

Conclusion

The producers are between a rock and a hard place; faced with falling prices and rising production costs. This squeeze on their operational ability makes it difficult for them to pay a reasonably attractive dividend; in fact many do not pay a dividend. So we have a situation whereby some producers pay no dividend and their stock price has tumbled, a recipe for disaster.

It is now more important than ever to select the quality producers in this sector, a well-managed mining company, operating in a mining friendly jurisdiction, with low cash costs, generating sufficient revenue so as not to need a loan, etc.

On the surface it looks as though the bottom is in and stock prices are cheaper now then they have been for some time. However, that does not mean that they can’t go any lower as disgruntled investors sell into any rally that presents them with an opportunity to exit their positions.

The HUI could be the next dead cat on the block so investors must exercise great caution at this juncture as the short term will continue to be volatile as this white knuckle ride gathers pace.

With gold and silver stocks being out of favor one must decide if this is a problem or an opportunity. We have steadfastly refused to buy gold and silver mining stocks for the last two years and as evidenced by the HUI we feel that our decision to hold back has been vindicated. The damage done to the mining sector may not be over yet but this demise is starting to offer up some exciting opportunities in my view.

Take care.

Bob Kirtley

  • Our model portfolio is up 605.20% since inception
  • An annualized return of 69.57%
  • An average return of 31.56% per trade
  • 123 closed trades, 107 closed at a profit
  • An average trade is open for 51.33 days

If you would like to sign up for our premium options trading service, SK OptionTrader, you can do so by clicking  Sign-Up via PayPal  HERE – URL: www.skoptionstrading.com

URL: www.gold-prices.biz

Email: bob@gold-prices.biz

Sign-Up for Gold-Prices.biz HERE

Buy 12 months of subscription time via PayPal – $199 HERE

Don’t forget if you are new to investment in the precious metals sector then you can subscribe of our FREE newsletters regarding gold stockssilver stocks and uranium stocks, just click on the links and enter your email address and we will email you our articles along with other interesting posts.

About Us

We are a small group of investors who primarily invest our own funds in various trading opportunities. We first traded gold back in 1980 when our charts consisted of simple graphs updated manually on a daily basis for the calculation of moving averages, etc. These days you can find moving averages, stockastics, Relative strength Index, MACD and a multitude of other indicators at the push of button. We are of the firm belief that it is the correct interpretation of these indicators along with a good understanding of the fundamentals and market timing that are crucial to sound decision-making. We trade only on the North American markets, as this is where we see the real action being based.

My qualifications include being Chartered (which is similar to being a Professional Engineer in Canada) along with a Masters Degree in Project Management from South Bank University, London, England. I spent many years working on Oil projects in Alberta including the tar sands installations in Fort McMurray.
 
My partner is much younger and provides valuable input and views in line with his generations thinking.
 
The purpose of our website is to publish our research and strategies for you to take on board and use as you wish. We also encourage you to comment on our articles as we may have overlooked a vital piece of data and always appreciate positive input.
 
Try to enjoy your trading in a relaxed, calm and happy manner. Never hit a play too hard, it may hit you back.
 
The Gold Prices Team:
 
Editor:
Bob Kirtley
 
Co-Editor:
Sam Kirtley


Disclaimer: www.gold-prices.biz or www.skoptionstrading.com makes no guarantee or warranty on the accuracy or completeness of the data provided. Nothing contained herein is intended or shall be deemed to be investment advice, implied or otherwise. This letter represents our views and replicates trades that we are making but nothing more than that. Always consult your registered adviser to assist you with your investments. We accept no liability for any loss arising from the use of the data contained on this letter. Options contain a high level of risk that may result in the loss of part or all invested capital and therefore are suitable for experienced and professional investors and traders only. Past performance is not a guide nor guarantee of future success.


Perspective – “Like There is No Tomorrow”

Signs Of The Times

“Fed Vice Chair, Janet Yellen, doesn’t see ‘Significant asset bubbles that would threaten financial instability’.”

– Bloomberg, April 16

“Extraordinarily loose monetary policy risks sparking credit bubbles that threaten to tip the world back into financial crisis.”

– IMF Warning, Financial Times, April 18

Financial bubbles are not new and the following quotes from our files date back to 1599.

Bubble: A delusive commercial or financial scheme (1599)

– Shorter Oxford Dictionary

“The use of the term ‘Bubble’ in this connection is often supposed to have been the creation of the South Sea period, and it is sometimes derived from ‘Bob’. Shakespeare has a ‘bubble reputation’, and Wycherley describes one of his characters as ‘Bubbled of his mistress’. The plates in HET GROOTE TAFEREEL DER DWAASHIED, 1720, show that the word was understood literally, and was closely connected with air bubbles – as something unsubstantial, which was capable of ‘being blown up’ rapidly and was liable to burst.”

– William Robert Scott, 1911, The Constitution and Finance of English, Scottish and Irish Joint-Stock Companies to 1720


The pamphlet, The Bubblers Mirrour of English Folly, published in 1725, provided:

“A list of ye bubbles with the prices they were subscribed at, and what each sold at when highest, together with Satyrical Eppigrams upon each, by ye author of ye S. Sea Ballad.”

– quoted by Charles Duguid in The Story of the Stock Exchange

One such “eppigram” is provided in JOHN LAW: The Father of Paper Money, by Robert Minton:

“My shares which on Monday I bought were worth millions on Tuesday I thought; So on Wednesday I chose my abode; In my carriage on Thursday I rode; To the ball-room on Friday I went; To the workhouse next day I was sent.”

Fed Chairman, Alan Greenspan, stated that a bubble could not be identified until it was over. In the final stages of the infamous 1720 South Sea Bubble the term was used by participants in real time, with no ambiguity.

“A senior Chinese auditor has warned that local government is ‘out of control’ and could spark a bigger financial crisis than the US housing market crash.”

– Financial Times, April 17

“China’s property rebound gathered pace in March as new home prices jumped the most in 10 years.”

*****

Perspective

Interesting times – the gold futures market gets hit with some 400 tons of a suddenly unwanted position. Then someone hacks into the Associated Press wire and plants a rumor about another bomb in the White House. The first one has been there since January 2009. Tuesday’s “bomb” drove the S&P down from 1578 to 1563 in an instant, then revealed as a fraud and the market bounced back. The other White House bomb is political and yet to be defused.

Legitimate news reports continue to surprise with “sudden” drops or numbers below the consensus. That’s in a number of countries, some of which have become very bold, if not belligerent, in buying bonds. The notion that a serious policy move will “kick start” a slowing economy seems endemic to central banking. And yet there is no evidence of intervention materially changing the business cycle, which comes and goes on its own. The only thing the Fed does is enhance price inflation on the recoveries.

Then when the “recovery” does not need any more credit the extra goes into whatever the public decides to speculated in. Lately it has been in lower-grade bonds and the US stock markets.

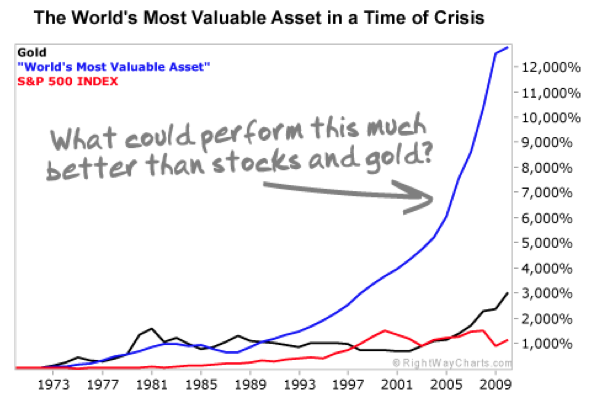
Some people are talking about where the speculation is not going. This would gold and silver as well as many commodities. Weakness in the latter has been signaling a weakening global economy and as the “inflationists” discovered this they have sold precious metals. Unfortunately this liquidation has been faster than the increase in investment demand as orthodox investments become increasingly risky.

The result has been panic selling of gold and silver and almost panic buying of stocks and bonds. The intensity of each side has been enough to indicate ending action.

On the political side, America is not as ungovernable as it seems. It is mainly the administration that has become ungovernable.

Commodities

On the intermediate term, base metal prices (GYX) have been under selling pressure since the nice high at 404 in February. It was unable to get above that resistance level and rolled over.

Tuesday’s low of 338 took out the low of 346 set with the last summer’s European credit crisis. On the longer term, this confirms our view that the “speculative surge” to 502 in 1Q2011 would set a cyclical peak.

This also confirms that the global economy is in the early stages of a cyclical global recession.

On the near term, Sunday’s ChartWorks noted that copper was oversold and had registered a “Sequential Buy” pattern. A brief rally has started.

This could prompt a stock market rotation whereby some cyclical sectors could do well for a while. An intermediate rally seems unlikely.

Going the other way, natural gas has become overbought.

In early 2011, we also thought that the grains (GKX) could set a cyclical peak. The high was 571 in March 2011 and the key low was 381 just before last summer’s European debt crisis. The drought high was 533 and a steady decline to 413 followed. That was set yesterday and it is uncertain if “joy” in base metals will inspire a grain rally.

The 8% plunge in only two days at the end of March was a “heads up” on all commodities. It also contributed to the failure in gold and silver.

Agricultural prices could trade sideways for around six weeks.

Crude’s plunge from the “Reversal” at 97.80 on April 1st to 85.90 on Monday was dramatic. The Daily RSI was oversold and the pop in prices to day’s 94 is rather fast. There is resistance at this level. The Weekly RSI is neutral.

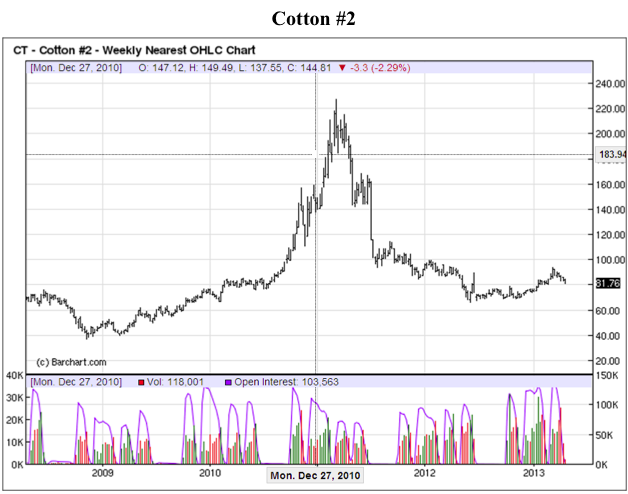
Of interest is the action in cotton. From a low of 70 last summer it climbed to 94 in mid- March. The last four weeks of the rally drove it to overbought. The breakdown was at the 88 level and now it is at support at 83.

This appears to be another “broken” commodity. The big low was 40 in the 2008 Crash. The big high was 205 set in the fateful 1Q2011. The subsequent low at 68 last summer confirmed the cyclical bear.

Screen shot 2013-05-02 at 4.46.00 PM

Credit Markets

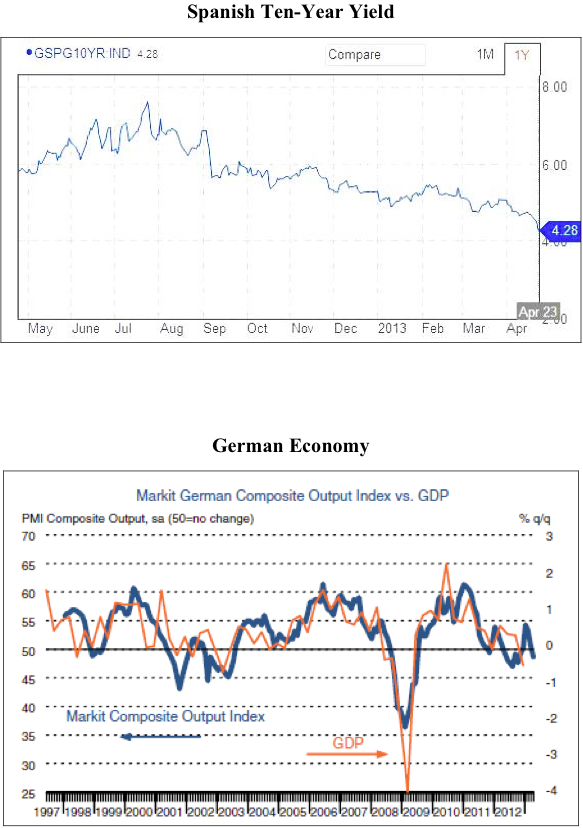
Hot action in lower-grade bonds has continued “like there is no tomorrow”. The yield on the benchmark Spanish 10-Year has plunged from 5.45% in early February to 4.28% today (chart follows). In considering it in price terms, and to use another cliché, “breakouts don’t count if it is your buying”. The high yield in last year’ panic was 7.50% and the low in the halcyon days of late 2010 was 3.71%.

The problem is that it is not just central bank buying, “everyone” is in the game. Reaching for yield has become a compulsion and it seems like one of “those” booms in the old Vancouver Stock Exchange. Enjoying the mania a veteran broker would shout “Buy 20,000 AOT!”. Of course, AOT is the symbol for “Any Old Thing”.

The more intense this becomes the more interesting it is for us. Often hot action going into May can be met by a serious reversal. It is a long-running seasonal item that could underlie the old “Sell in May and go away”.

One monitor of spread action is the JNK/TLT (junk/treasuries) which set a high of .356 in early March and declined (widened) to .333 in early April. The rebound has been to .344 and the slip has been to .333 on the 15th. Now at .338, taking out .333 would be deadly.

In anticipation of last year’s debacle, it declined from .342 in early March to .278 in late June. It was a “killer” May reversal in spreads. The calamity climaxed in July 2012.

In 2008, the pattern completed later in the season with the reversal accomplished in the middle of June.

Also as noted, in 1998 the full force of the establishment was fully committed to narrowing credit spreads. The experiment crashed with LTCM. The establishment was also dedicated to the bear raid on gold. The unwinding of LTCM short positions involved selling of England’s gold – right down to 253 dollars.

As noted last week, a similar pattern in the spring of 1998 set up the LTCM disaster that was discovered in that fateful August. The overall panic lasted into October as Citigroup, for example, plunged by 40 percent.

This spread monitor is providing what has been a reliable warning as participants, including central banks, are “Buying AOT!”.

As in 2008 and 1998, Wall Street and its central bankers are vulnerable to a seasonal reversal.

Screen shot 2013-05-02 at 4.45.32 PM

Currencies

Over the past four weeks the US dollar has been in a narrow trading range, essentially, between 82 and 83. Daily and Weekly momentum readings are neutral. It seems that the DX could decline a little over the next few weeks.

However, on the bigger picture the last important low was 72.70 set in May 2011. That was at the most oversold Weekly RSI since just before the 2008 Crash. The reversal to rising was part of the disaster that was maximized at the key high of 88.71 in May 2010.

A sharp down tick could set the dollar up for the next serious rally.

There has been support for the Canadian at 97, which became a test last week. The rise with firming metal prices could take it up to the 98 level.


BOB HOYE, INSTITUTIONAL ADVISORS E-MAIL

bhoye.institutionaladvisors@telus.net

WEBSITE: www.institutionaladvisors.com


Grandich – Things


Screen shot 2013-05-02 at 8.49.51 PM1.
 Sink QE (the money printing plan, that Is)

2. Global bond markets look eerily like 2005 (consider your position when the music stops)

3. Pensions: How Big is the Problem

4. Sink the dollar – Year of the yuan: China’s explosive currency goes global

5. A buy signal on juniors? (Junior mining stocks see record insider buying)

6. They’re coming for you next

7. Are you *%@# kidding me?

About Peter

Though he never finished high school, Peter Grandich entered Wall Street in the mid-1980s with no formal education or training and within three years was appointed Vice President of Investment Strategy for a leading New York Stock Exchange member firm. He would go on to hold positions as a Market Strategist, portfolio manager for four hedgefunds and a mutual fund that bared his name.

His abilities has resulted in hundreds of media interviews including GMA, Neil Cavuto’s Your World on Fox News, The Kudlow Report on CNBC, Wall Street Journal, Barron’s, Financial Post, Globe and Mail, US News & World Report, New York Times, Business Week, MarketWatch, Business News Network and dozens more. He’s spoken at investment conferences around the globe, edited numerous investment newsletters, and is one of the more sought after commentators.

Grandich is the founder of Grandich.com and Grandich Publications, LLC, and is editor of The Grandich Letter which was first published in 1984. On his internationally-followed blog, he comments daily about the world’s economies and financial markets and posts his views on social and political topics.  He also blogs about a variety of timely subjects of general interest and interweaves his unique brand of humor and every-man “Grandichism” expressions with his experience gained from more than 30 years in and around Wall Street. The result is an insightful and intuitive look at business, finances and the world, set in a vernacular that just about anyone can understand. In his first year, Grandich’s wildly-popular blog had more than one million views. Grandich also provides a variety of services to publicly-held corporations on a compensation basis.

Grandich’s autobiography, Confessions of a Wall Street Whiz Kid, was publiched in fall 2011.

He is the also the founder of Trinity Financial Sports & Entertainment Management Co. [www.TrinityFSEM.com], a firm with a Christian perspective which he started in 2001 with former NY Giant and two-time Super Bowl champion Lee Rouson.  The firm offers services to celebrities, athletes and average folks.  Peter Grandich is a member of the National Association of Christian Financial Consultants, and a long-standing member of The New York Society of Security Analysts and The Society of Quantitative Analysts.

Grandich is also very active in Christian sports ministries including the Fellowship of Christian Athletes and Athletes in Action.

He resides in New Jersey with his wife Mary and daughter Tara.


The Rising Dollar Myth

Year-to-date, the U.S. dollar is up; does that mean we are in a rising dollar environment? Or is it an opportunity to diversify out of the greenback?

1

Last year, with all the turmoil in the Eurozone, the euro was up 1.79% versus the dollar; that appeared to be the best the U.S. dollar could do in times of turmoil. Of the major currencies only the Japanese yen was down versus the U.S. dollar:

2

……read more HERE

What an Astonishing Performance – Farmland Outstrips Gold During Crisis

“The World’s Most Valuable Asset in a Time of Crisis”

There’s one reliable, common and briliant investment that has proved to be even better than gold or silver in crisis. In fact, since 1970, a year before the U.S. went off the gold standard, this investment has easily outpaced both stocks and gold.

Farmland vs Gold - SP 500

Its certainly reasonable to expect a crisis with the troubles in the US and Europe alone

Its FARMLAND: Click on either chart or HERE to read the full report


test-php-789