
Timing & trends
Since the middle of April everyone and including their grandmother seems to have been building a short position in the equities market and we know picking tops or bottoms fighting the major underlying trend is risky business but most individuals cannot resist.
The rush one gets trying to pick a major top or bottom is flat out exciting and that is what makes it so darn addicting and irresistible. If you have ever nailed a market top or bottom then you know just how much money can be made. That one big win naturally draws you back to keep doing it much like how a casino works. The chemicals released in the brain during these extremely exciting times are strong enough that even the most focused traders fall victim to breaking rules and trying these type of bets/trades.
So if are going to try to pick a top you better be sure the charts and odds are leaning in your favor as much as possible before starting to build a position.
Below are a few charts with my analysis and thoughts overlaid showing you some of the things I look at when thinking about a counter trend trade like picking a top within a bull market.
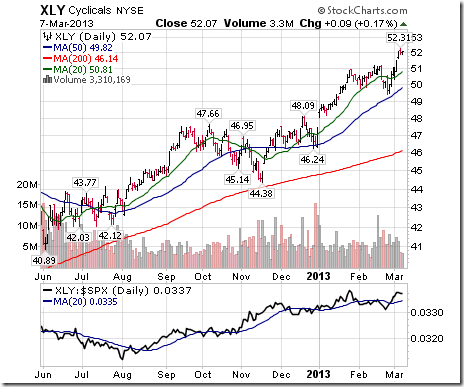
UTILITY STOCKS VS SP500 INDEX DAILY PERFORMANCE CHART:
The SPY and XLU performance chart below clearly shows how the majority of traders move out of the slow moving defensive stocks (utilities – XLU) and starts to put their money into more risky stocks. This helps boost the broad market. I see the same thing in bonds and gold this month which is a sign that a market top is nearing.
That being said when a market tops it is generally a process which takes time. Most traders think tops area one day event but most of the times it takes weeks to unfold as the upward momentum slows and the big smart money players slowly hand off their long positions to the greedy emotion drove traders.
Look at the chart below and notice the first red box during September and October. As you can see it took nearly 6 weeks for that top to form before actually falling off. That same thing could easily happen again this time, though I do feel it will be more violent this time around.

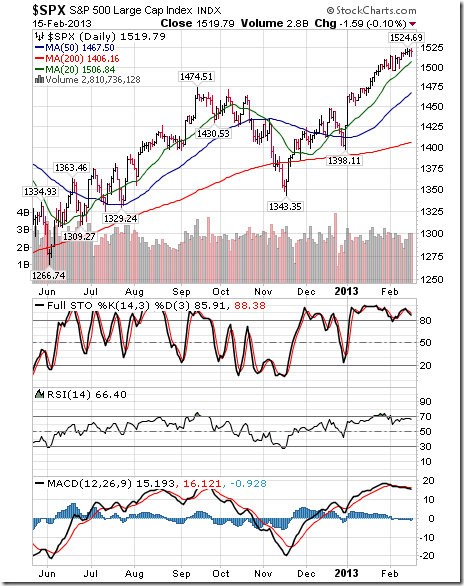
SPY ETF TRADING CHART SHOWS INSTABILITY AND RESISTANCE:
Using simple trend line analysis we see the equities market is trading at resistance and sideways or lower prices are more likely in the next week or two.

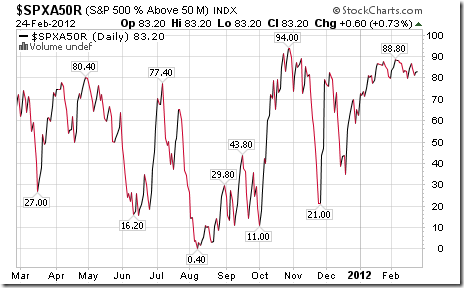
STOCKS TRADING ABOVE 150 DAY MOVING AVERAGE CHART:
This chart because it’s based on a very long term moving average (150sma) is a slow mover and does not work well for timing traded. But with that said it does clearly warn you when stocks are getting a little overpriced and sellers could start at any time.
General rule is not to invest money on the long side when this chart is above the 75% level. Rather wait for a pullback below it.

STOCKS TRADING ABOVE 20 DAY MOVING AVERAGE CHART:
This chart is based on the 20 day moving average which moves quickly. Because it reacts quicker to recent price action it can be a great help in timing an entry point for a market top or bottom. It does not pin point the day/top it does give you a one or two week window of when price should start to correct.

How to Spot and Time Stock Market Tops Conclusion:
As we all know or will soon find out, trading is one of the toughest businesses or and one of the most expensive hobbies that one will try to master. Hence the 95-99% failure rate of individuals who try to understand how the market functions, position management, how to control their own emotions and to create/follow a winning strategy.
With over 8000 public traded stocks, exchange traded funds, options, bonds, commodities, futures, forex, currencies etc… to pick from its easy to get overwhelmed and just start doing more or less random trades without a proven, documented rule based strategy. This type of trading results in frustration, loss of money and the eventual closure of a trading account. During this process most individuals will also lose friends, family and in many cased self-confidence.
So the next time you think about betting against the trend to pick a top or a bottom you better make darn sure you have waited well beyond the first day you feel like the market is topping out. Stocks trading over the 150 and 20 day moving averages should be in the upper reversal zones and money should be flowing out of bonds and other safe haven/defensive stocks to fuel the last rally/surge higher in the broad market.
Also I would like to note that I do follow the index futures and volume very closely on both the intraday and daily charts. This is where the big money does a lot of trading. Knowing when futures contracts are being sold or bought with heavy volume is very important data in helping time tops and bottoms more accurately. And the more experience you have in trading also plays a large part in your success in trading tops and bottoms.
Download my FREE eBook on Controlling Your Trades, Money & Emotions:http://www.thegoldandoilguy.com/trade-money-emotions.php
Chris Vermeulen


 Why we are still bullish on stocks?
“If the financial system has a defect, it is that it reflects and magnifies what we human beings are like. Money amplifies our tendency to overreact, to swing from exuberance when things are going well to deep depression when they go wrong. Booms and busts are products, at root, of our emotional volatility.” – Niall Ferguson
As we enter the second quarter of 2013, I’m writing to summarize market developments since the start of the year and to share my thoughts on positioning portfolios for the period ahead. First though, a quick recap of the first quarter of 2013…….
 In the last few weeks, I have become more and more persuaded that we are entering the bubble phase of the current bull market. Investing in such an environment is tricky. The opportunities for windfall profits are high – as are the risks of catastrophic losses.
In investing, it is crucial to distinguish between the market and the economy. Too often people make the mistake of equating the two. They assume that if the stock market is up, the economy must be good and vice versa. Same thing for individual stocks.
However, the truth is that the market is its own world. It is a world of perception dominated by professional investors trying to be one step ahead of their competition. (For an excellent recent articulation of this position, see Josh Brown’s “My Edge And The Crossroads”, April 27). In such an environment, the fundamentals often take a backseat to factors internal to the market itself.
….read more HERE
The Bottom Line
Strength in equity markets continues to surprise on the upside. However, a lack of favourable seasonal influences, mixed responses to quarterly reports, a slowdown in U.S. economic growth, concerns about a slowdown in monetary stimulus and virtually no progress on U.S. fiscal policy suggest that upside potential is limited and downside risk is significant. Appropriate action is recommended.
(Editor’s Note: Jon Vialoux is scheduled to appear on BNN’s “Money Talks” at 8:00 PM EDT)
U.S. equity index futures were lower this morning. S&P 500 futures were down 3 points in pre-opening trade. Futures are responding to less than expected growth in China’s industrial production.
Index futures recovered after April retail sales were released.Consensus was a decline of 0.3% versus a revised decline of 0.5% in March. Actual was a gain of 0.1%. Excluding auto sales, consensus was a decline of 0.2% versus a drop of 0.4% in March. Actual was a gain of 0.1%.
Boeing eased $0.67 to $93.57 despite an increase in target price by Sterne Agee from $100 to $120.
Autozone (AZO $420.95) is expected to open lower after Deutsche Bank downgraded the stock from Buy to Hold.
Cisco (CSCO $21.10) is expected to open higher after FBR Capital upgraded the stock from Under Perform to Market Perform. Target was raised from $17 to $19.
AuRico Gold (AUQ C$4.86) is expected to open higher after Desjardins upgraded the stock from Hold to Buy.
Equity Trends
The S&P 500 Index gained 19.28 points (1.19%) last week. Trend remains up. The Index remains above its 20, 50 and 200 day moving averages. Short term momentum indicators remain overbought.

Percent of S&P 500 stocks trading above their 50 day moving average increased last week to 89.20% from 80.80%. Percent remains intermediate overbought
Percent of S&P 500 stocks trading above their 200 day moving average increased last week to 93.98% from 90.60%. Percent remains intermediate overbought
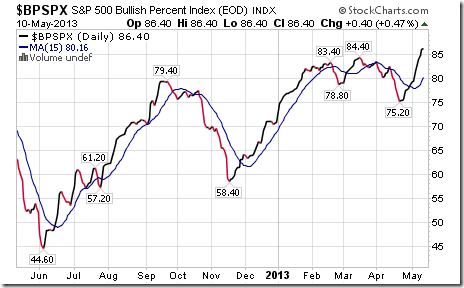
Bullish Percent Index for S&P 500 stocks increased last week to 86.40% from 81.40% and remained above its 15 day moving average. The Index remains intermediate overbought
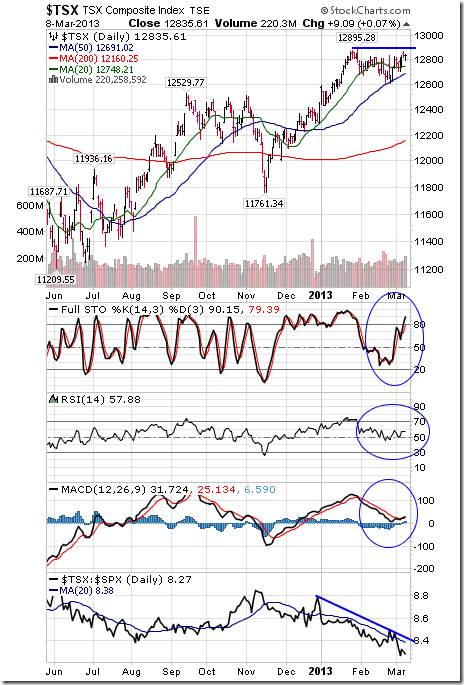
Bullish Percent Index for TSX Composite stocks was unchanged last week at 59.58% and remained above its 15 day moving average. The Index remains intermediate overbought.

The TSX Composite Index added 151.06 points (1.21%) last week. Trend remains down. The Index remains above its 20 and 200 day moving averages and moved above its 50 day moving average. Strength relative to the S&P 500 Index remains negative, but showing early signs of change. Technical score based on the above technical indicators remains at 1.0. Short term momentum indicators remain overbought.
Percent of TSX Composite stocks trading above their 50 day moving average increased last week to 50.42% from 46.25%. Percent has recovered to a slightly overbought level.

Percent of TSX Composite stocks trading above their 200 day moving average increased last week to 55.42% from 52.08%.Percent has recovered to a slightly overbought level.
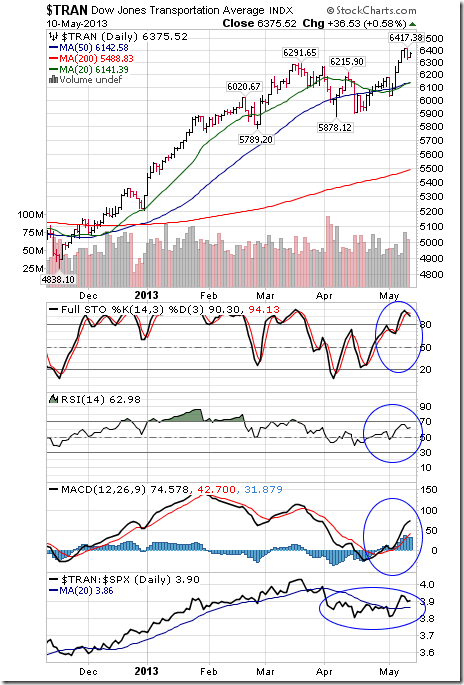
The Dow Jones Transportation Average gained 156.62 points (2.52%) last week. Trend changed from neutral to up on a move above 6,291.65. The Average remains above its 20, 50 and 200 day moving averages. Strength relative to the S&P 500 Index changed from negative to positive. Technical score improved from 1.5 to 3.0. Short term momentum indicators remain overbought.
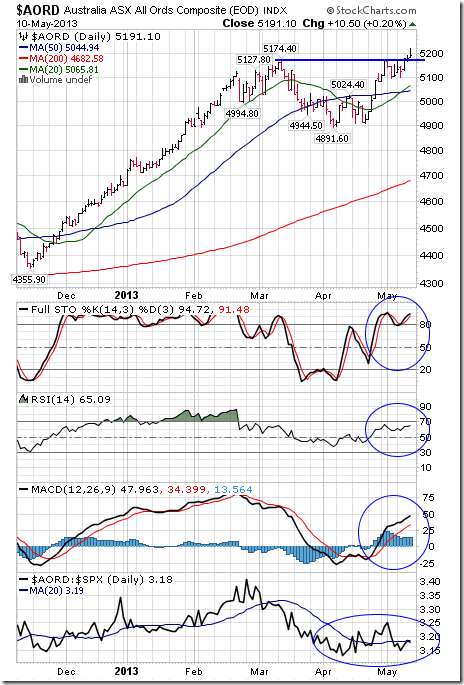
The Australia All Ordinaries Composite Index added 85.70 points (1.68%) last week. Trend remains up. The Index remains above its 20, 50 and 200 day moving averages. Strength relative to the S&P 500 Index changed from positive to neutral. Technical score eased from 3.0 to 2.5. Short term momentum indicators remain overbought.
The Nikkei Average jumped 913.50 points (6.67%) last week. Trend remains up. The Average remains above its 20, 50 and 200 day moving averages. Strength relative to the S&P 500 Index remains positive. Technical score remains at 3.0. Short term momentum indicators remain overbought.

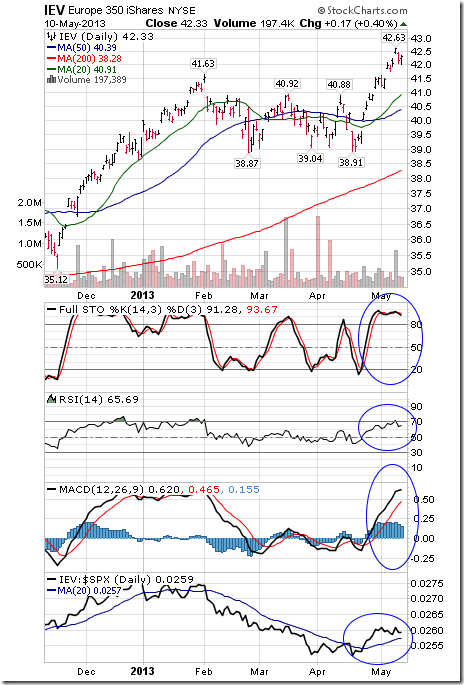
Europe 350 iShares added $0.35 (0.83%) last week. Trend remains up. Units remain above their 20, 50 and 200 day moving averages. Strength relative to the S&P 500 Index remains positive. Technical score remains at 3.0. Short term momentum indicators remain overbought.
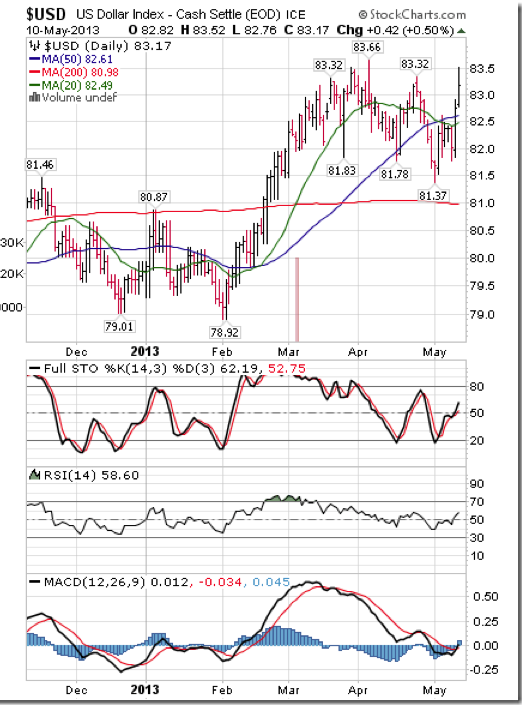
Currencies
The U.S. Dollar Index gained 1.03 (1.25%) last week. The dollar moved above its 20 and 50 day moving averages. Short term momentum indicators are trending up.
Gold fell $27.60 U.S. per ounce (1.88%) last week. Trend remains down. Gold remains above its 20 day moving average. Strength relative to the S&P 500 Index remains negative, but showing early signs of change. Technical score remains at 1.0. Short term momentum indicators are mixed.

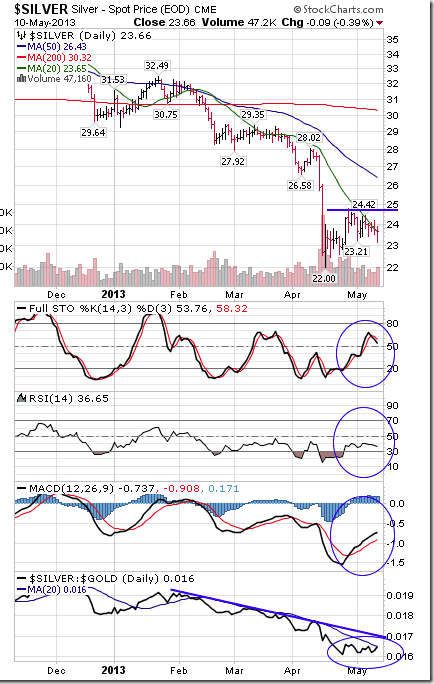
Silver dropped $0.35 per ounce (1.46%) last week. Trend remains down. Silver moved above its 20 day moving average. Strength relative to Gold and the S&P 500 Index remains negative. Technical score improved from 0.0 to 1.0. Short term momentum indicators have recovered to neutral levels.
…..40 more Charts HERE


-
I know Mike is a very solid investor and respect his opinions very much. So if he says pay attention to this or that - I will.
~ Dale G.
-
I've started managing my own investments so view Michael's site as a one-stop shop from which to get information and perspectives.
~ Dave E.
-
Michael offers easy reading, honest, common sense information that anyone can use in a practical manner.
~ der_al.
-
A sane voice in a scrambled investment world.
~ Ed R.
Inside Edge Pro Contributors

Greg Weldon

Josef Schachter

Tyler Bollhorn

Ryan Irvine

Paul Beattie

Martin Straith

Patrick Ceresna

Mark Leibovit

James Thorne

Victor Adair