

The Bottom Line
Strength in equity markets continues to surprise on the upside. However, a lack of favourable seasonal influences, mixed responses to quarterly reports, a slowdown in U.S. economic growth, concerns about a slowdown in monetary stimulus and virtually no progress on U.S. fiscal policy suggest that upside potential is limited and downside risk is significant. Appropriate action is recommended.
(Editor’s Note: Jon Vialoux is scheduled to appear on BNN’s “Money Talks” at 8:00 PM EDT)
U.S. equity index futures were lower this morning. S&P 500 futures were down 3 points in pre-opening trade. Futures are responding to less than expected growth in China’s industrial production.
Index futures recovered after April retail sales were released.Consensus was a decline of 0.3% versus a revised decline of 0.5% in March. Actual was a gain of 0.1%. Excluding auto sales, consensus was a decline of 0.2% versus a drop of 0.4% in March. Actual was a gain of 0.1%.
Boeing eased $0.67 to $93.57 despite an increase in target price by Sterne Agee from $100 to $120.
Autozone (AZO $420.95) is expected to open lower after Deutsche Bank downgraded the stock from Buy to Hold.
Cisco (CSCO $21.10) is expected to open higher after FBR Capital upgraded the stock from Under Perform to Market Perform. Target was raised from $17 to $19.
AuRico Gold (AUQ C$4.86) is expected to open higher after Desjardins upgraded the stock from Hold to Buy.
Equity Trends
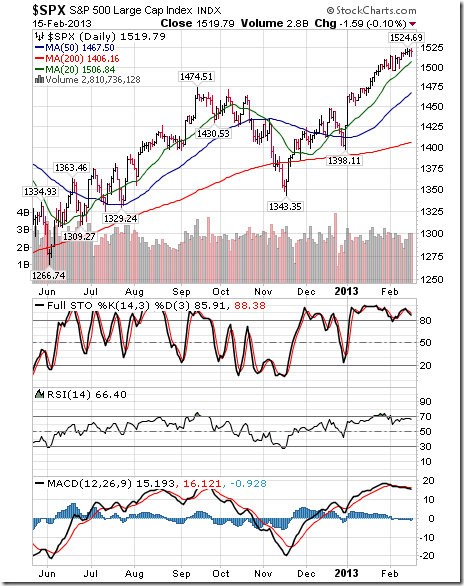
The S&P 500 Index gained 19.28 points (1.19%) last week. Trend remains up. The Index remains above its 20, 50 and 200 day moving averages. Short term momentum indicators remain overbought.

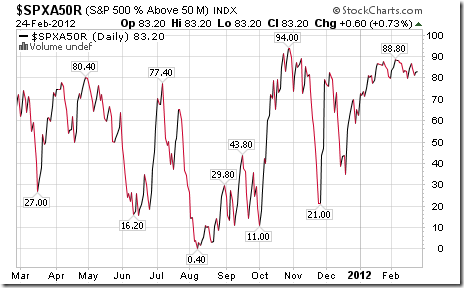
Percent of S&P 500 stocks trading above their 50 day moving average increased last week to 89.20% from 80.80%. Percent remains intermediate overbought
Percent of S&P 500 stocks trading above their 200 day moving average increased last week to 93.98% from 90.60%. Percent remains intermediate overbought
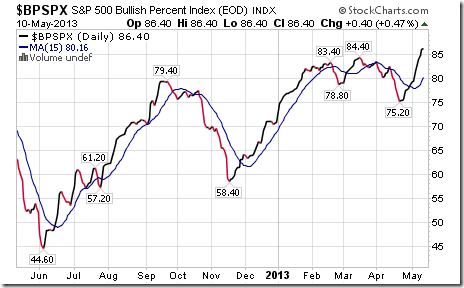
Bullish Percent Index for S&P 500 stocks increased last week to 86.40% from 81.40% and remained above its 15 day moving average. The Index remains intermediate overbought
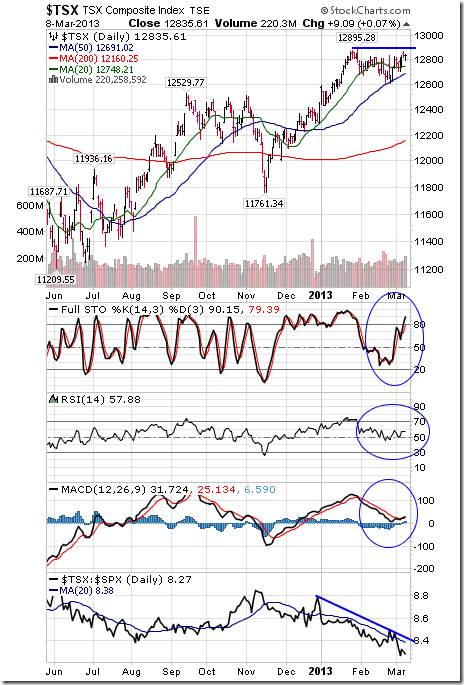
Bullish Percent Index for TSX Composite stocks was unchanged last week at 59.58% and remained above its 15 day moving average. The Index remains intermediate overbought.

The TSX Composite Index added 151.06 points (1.21%) last week. Trend remains down. The Index remains above its 20 and 200 day moving averages and moved above its 50 day moving average. Strength relative to the S&P 500 Index remains negative, but showing early signs of change. Technical score based on the above technical indicators remains at 1.0. Short term momentum indicators remain overbought.
Percent of TSX Composite stocks trading above their 50 day moving average increased last week to 50.42% from 46.25%. Percent has recovered to a slightly overbought level.

Percent of TSX Composite stocks trading above their 200 day moving average increased last week to 55.42% from 52.08%.Percent has recovered to a slightly overbought level.
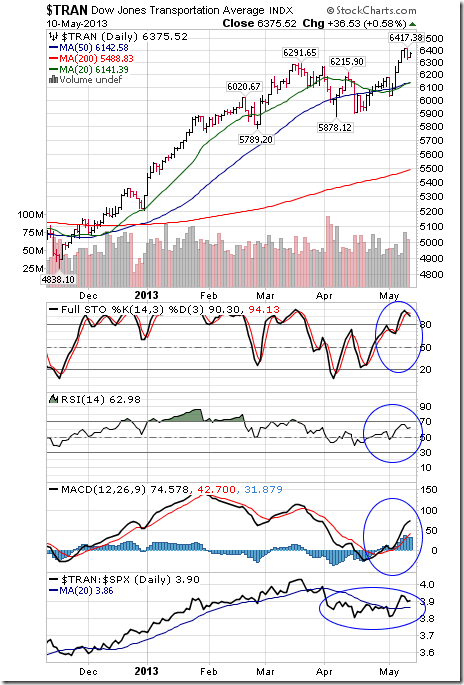
The Dow Jones Transportation Average gained 156.62 points (2.52%) last week. Trend changed from neutral to up on a move above 6,291.65. The Average remains above its 20, 50 and 200 day moving averages. Strength relative to the S&P 500 Index changed from negative to positive. Technical score improved from 1.5 to 3.0. Short term momentum indicators remain overbought.
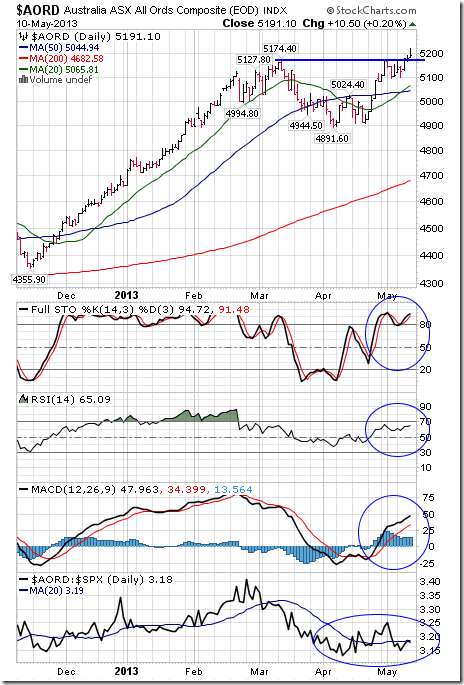
The Australia All Ordinaries Composite Index added 85.70 points (1.68%) last week. Trend remains up. The Index remains above its 20, 50 and 200 day moving averages. Strength relative to the S&P 500 Index changed from positive to neutral. Technical score eased from 3.0 to 2.5. Short term momentum indicators remain overbought.
The Nikkei Average jumped 913.50 points (6.67%) last week. Trend remains up. The Average remains above its 20, 50 and 200 day moving averages. Strength relative to the S&P 500 Index remains positive. Technical score remains at 3.0. Short term momentum indicators remain overbought.

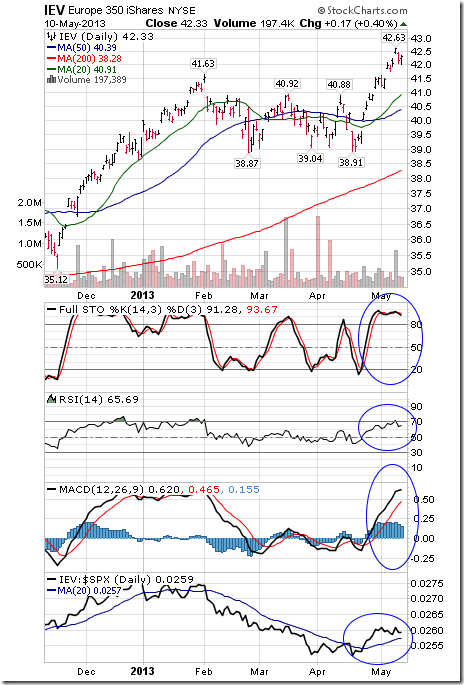
Europe 350 iShares added $0.35 (0.83%) last week. Trend remains up. Units remain above their 20, 50 and 200 day moving averages. Strength relative to the S&P 500 Index remains positive. Technical score remains at 3.0. Short term momentum indicators remain overbought.
Currencies
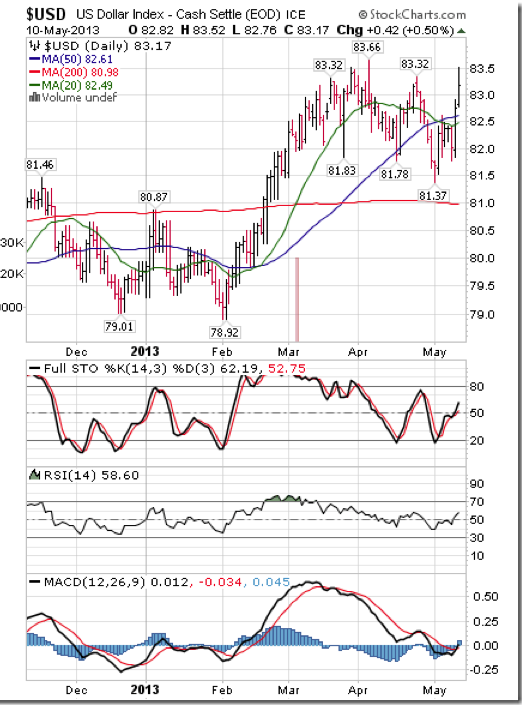
The U.S. Dollar Index gained 1.03 (1.25%) last week. The dollar moved above its 20 and 50 day moving averages. Short term momentum indicators are trending up.
Gold fell $27.60 U.S. per ounce (1.88%) last week. Trend remains down. Gold remains above its 20 day moving average. Strength relative to the S&P 500 Index remains negative, but showing early signs of change. Technical score remains at 1.0. Short term momentum indicators are mixed.

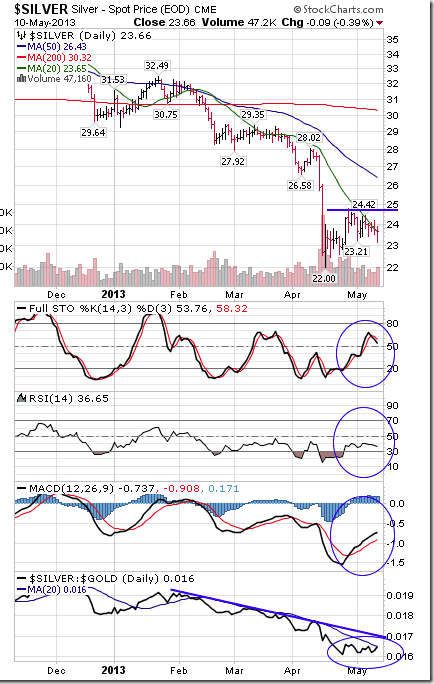
Silver dropped $0.35 per ounce (1.46%) last week. Trend remains down. Silver moved above its 20 day moving average. Strength relative to Gold and the S&P 500 Index remains negative. Technical score improved from 0.0 to 1.0. Short term momentum indicators have recovered to neutral levels.
…..40 more Charts HERE


