
The following is a partial transcript of Dr. Marc Faber’s interview airing for subscribers on Friday:
Timing & trends

»» Japan was once again in the spotlight this week. Volatility and the rise in government bond yields led to a shift in global investor sentiment.
»» Global economic indicators were mixed, with China weaker, Europe stronger, and the U.S. resilient once again.
»» Central banks and their bold moves continue to be a key focus for investors. During the week, the focus was on Fed Chairman Ben Bernanke and his
testimony to Congress. (pages 2-3)
»» Global Roundup: Updates from the U.S., Canada, Europe, and Asia Pacific. (pages 3-4)
For the complete report as well as Daily Updates CLICK HERE.

Precious metals and their related mining stocks continue to underperform the broad market. This year’s heavy volume breakdown below key support has many investors and trader’s spooked creating to a steady stream of selling pressure for gold and silver bullion and mining stocks.
While the technical charts are telling me prices are trying to bottom we must be willing to wait for price to provide low risk entry points before getting involved. Precious metals are like any other investment in respect to trading and investing in them. There are times when you should be long, times to be in cash and times to be short (benefit from falling prices). Right now and for the last twelve months when looking at precious metals cash has been king.
Since 2011 when gold and silver started to correct the best position has been to move to cash or to sell/write options until the next trend resumes. This is something I have been doing with my trading partner who focuses solely on Options Trading who closed three winning positions last week for big gains.
In 2008 we had a similar breakdown in price washing the market clean of investors who were long precious metals. If you compare the last two breakdowns they look very similar. If price holds true then we will see higher prices unfold at the end of 2013.
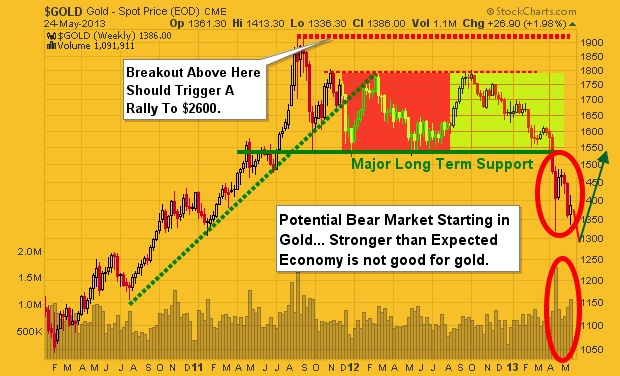
The key here is for the price to move and hold above the major resistance line. A breakout would trigger a rally in gold to $2600 – $3500 per ounce. With that being said gold and silver may be starting a bear market. Depending what the price does when the major resistance zone is touched, my outlook may change from bullish to bearish. Remember, no one can predict the market with 100% accuracy and each day, week and month that passes changes the outlook going forward.
The chart below is on I drew up on May 3rd. I was going to get a fresh chart and put my analysis on it but to be honest my price forecast/analysis has been spot on thus far and there is no need to update.
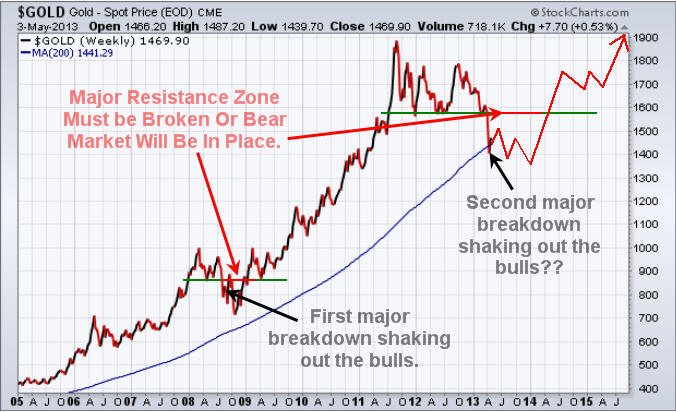
GOLD DAILY TECHNICAL CHART SHOWING BOTTOMING PROCESS:
Major technical damage has been done to the chart of gold. Gold is trying to put in a bottom but still needs more time. I feel gold will make a new low in the coming month then bottom as drawn on the chart below.
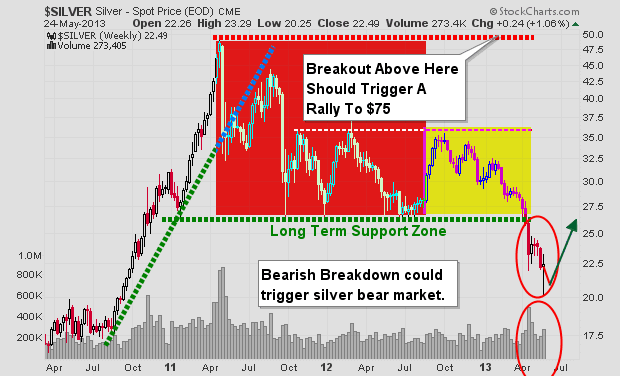
SILVER DAILY TECHNICAL CHART SHOWING BOTTOMING PROCESS:
Silver is in a similar as gold. The major difference between gold and silver is that silver dropped 10% early one morning this month which had very light volume. The fact that silver hit my $20 per ounce level and it was on light volume has me thinking silver has now bottomed.
But, silver may flounder at these prices or near the recent lows until its big sister (gold) puts in a bottom.
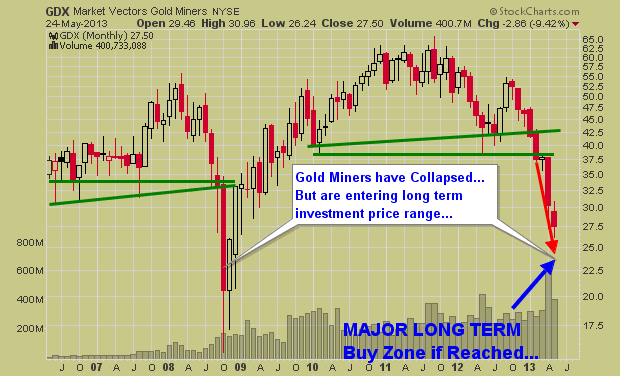
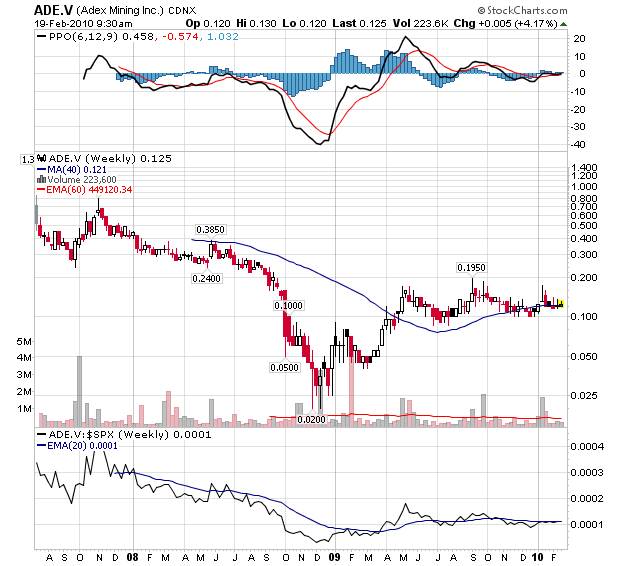
GOLD MINING STOCKS MONTHLY INVESTING ZONE CHART:
Gold mining stocks broke down a couple months ago and continue to sell off on strong volume. If precious metals continue to move lower then mining stocks will continue their journey lower.
This updated chart which I originally drew in February warning of a breakdown below the green support trend lines would signal a collapse in stock prices, which is exactly what has/is taking place. While I do not try to pick bottoms (catch falling knives) I do like to watch for them so I am prepared for new positions when the time and chart turn bullish or provide a low risk probing entry point.
While I focus more on analysis, forecasts and ETF trading another one of my trading partners who focuses on Trading Stocks and 3x Leveraged ETF’s has been cleaning up with gold miners.
GOLD, SILVER AND MINING STOCKS CONCLUSION:
Precious metals continue to be trending down and while they look to be trying to bottom it is important to remember that some of the biggest percent moves take place in the last 10% of a trend. So we may be close to a bottom on the time scale but there could be sharply lower prices yet.
The time will come when another major signal forms and when it does we will be getting involved. The exciting this is that it could be just around the corner. So if you want to keep current and take advantage of the next major moves in the market be sure to join our newsletters.
Join My Newsletter Memorial Day Special 50% Discount:
http://www.thegoldandoilguy.com/signup.php
Chris Vermeulen

Finally, technical evidence of at least a short term peak in most equity markets and sectors has surfaced. Appropriate action is recommended –
(Ed note: Click HERE for the entire interview with Michael Campbel)
MORE NOTES FROM DON
Earnings focus this week remains on the Canadian banks.
Economic news this week is expected to have a neutral impact on equity markets. Data is not expected to change significantly from previous monthly reports. Investors are waiting for more clues about timing of winddown of Quantitative Easing
Currency wars will continue. Volatility in currencies was exceptional last week and is expected to continue.
Short term technical indicators turned bearish last week and intermediate term technical indicators are showing early signs of peaking from intermediate overbought levels. Bearish key reversal patterns were recorded on Wednesday by broadly based U.S. equity indices and most sectors. Broadly based equity indices around the world quickly followed. Initial targets for broadly based U.S. equity indices is to the top of previous trading ranges on the breakout on May 3rd following the surprising April employment report: S&P 500 Index to 1,597, Dow Jones Industrial Average to 14,887 and the NASDAQ Composite Index to 3,307.
Economically sensitive sectors were notable underperformers last week including Industrials, Materials, Financials and Technology, typical underperformance on a seasonal basis for this time of year.
Large cash positions held by Canadian and U.S. corporations continue to be employed in dividend hikes and share buy backs, a short term bullish scenario with long term negative implications.
Bullish Percent Index for TSX Composite stocks was unchanged last week at 59.58% and slipped below its 15 day moving average. The Index remains intermediate overbought.
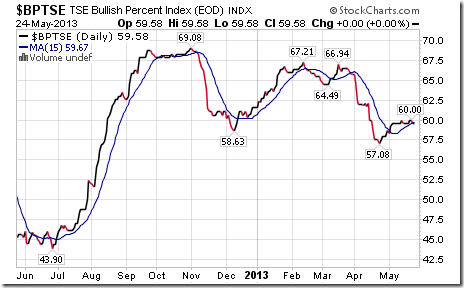
The TSX Composite Index added 54.17 points (0.43%) last week. Trend remains up. The Index found resistance near the 12,900 level. The Index remains above its 20, 50 and 200 day moving averages. Strength relative to the S&P 500 Index changed from negative to neutral. Technical score based on the above technical indicators increased to 2.5 from 2.0. Short term momentum indicators are rolling over from overbought levels.

Percent of TSX stocks trading above their 50 day moving average increased last week to 55.42% from 49.17%. Percent is intermediate overbought.

Percent of TSX stocks trading above their 200 day moving average increased last week to 54.58% from 53.75%. Percent remains intermediate overbought.

For Don’s weekend Charts & Notes of every Market view HERE

Jim Puplava: Joining me on the program today is Dr. Marc Faber who heads up the Gloom, Boom, and Doom report. And, Marc, recently we’ve seen a precipitous fall in gold unlike anything seen in a few years. I’d like to get your take: What’s behind this fall in gold? Because it took the markets by surprise—there’s a lot of theories out there, including this week in Barron’s by Randall Forsythe saying that, this time, gold bugs may have a point. What are your thoughts?
Dr. Marc Faber: Well, there are many theories why the price went down. Simply put, there were more sellers than buyers. Now, of course, a lot of people have all kinds of theories that people manipulate the market down and so forth. That might be the case. I don’t have a clue. Now, rather than say it has been the case or hasn’t been the case it may be worthwhile to analyze why someone has an
 interest to manipulate the price of gold down. As you may know, Eric Sprott has maintained for some time that central banks, particularly the U.S, don’t have the gold anymore— that they leased it out and there may have been a shortage and so central banks may have had the inclination to suppress the price for whatever reason.
interest to manipulate the price of gold down. As you may know, Eric Sprott has maintained for some time that central banks, particularly the U.S, don’t have the gold anymore— that they leased it out and there may have been a shortage and so central banks may have had the inclination to suppress the price for whatever reason.So, can you explain to me why—and I never overestimate the intelligence of western central bankers—why would someone in the west want to suppress the price and enable the Asian central bankers to buy gold at the depressed price? I just don’t see it that way. Number 2: One more reason why a central bank would want to suppress the price and that is expropriation. In 1933, the U.S. collected all the gold that U.S. citizens held, and then they revalued it to $35. So the people that owned gold [previously] missed out on this appreciation. It amounted, basically, to a devaluation of the dollar against gold by over 30%. Now, a western central bank, say the Federal Reserve, could say, “Okay, let’s depress the gold price down to $1000 or below and then we’ll declare gold holdings to be illegal and then we will buy at the prevailing price. Then, once they’ve collected all the gold they can revalue it at, say, $10,000. Is this likely? I don’t think the central bankers would be smart enough to think of that. And, technically, it would be quite difficult to implement. So, I can’t see it really happening, but this would be a motive to depress the price artificially. Otherwise, actually, central bankers would have an interest to push the price up because they own most of the gold.
In the rest of this interview, Marc explains a very important difference between central banks leasing gold versus selling their gold along with a large number of other topics, including:
-Does massive retail buying of gold signify a bottom?
-Whether he’s buying at these prices
-What a strong dollar means for financial assets around the world
-The impact of a falling Yen on other Asian countries
-What export statistics from each of China’s trading partners say about the alarming state of China’s economy?
-Where he is investing currently
-Why investors should diversify
-Why the market has been much more volatile since the inception of the Federal Reserve
-What the biggest mistake investors make is
Click HERE If you would like to listen to this full interview or any of our other expert interviews,
CLICK HERE to subscribe to the free weekly Best of Financial Sense Newsletter .

 A former insider at the World Bank, ex-Senior Counsel Karen Hudes, says the global financial system is dominated by a small group of corrupt, power-hungry figures centered around the privately owned U.S. Federal Reserve. The network has seized control of the media to cover up its crimes, too, she explained. In an interview with The New American, Hudes said that when she tried to blow the whistle on multiple problems at the World Bank, she was fired for her efforts. Now, along with a network of fellow whistleblowers, Hudes is determined to expose and end the corruption. And she is confident of success.
Citing an explosive 2011 Swiss study published in the PLOS ONE journal on the “network of global corporate control,” Hudes pointed out that a small group of entities – mostly financial institutions and especially central banks – exert a massive amount of influence over the international economy from behind the scenes. “What is really going on is that the world’s resources are being dominated by this group,” she explained, adding that the “corrupt power grabbers” have managed to dominate the media as well. “They’re being allowed to do it.”
According to the peer-reviewed paper…
….read it all HERE


-
I know Mike is a very solid investor and respect his opinions very much. So if he says pay attention to this or that - I will.
~ Dale G.
-
I've started managing my own investments so view Michael's site as a one-stop shop from which to get information and perspectives.
~ Dave E.
-
Michael offers easy reading, honest, common sense information that anyone can use in a practical manner.
~ der_al.
-
A sane voice in a scrambled investment world.
~ Ed R.
Inside Edge Pro Contributors

Greg Weldon

Josef Schachter

Tyler Bollhorn

Ryan Irvine

Paul Beattie

Martin Straith

Patrick Ceresna

Mark Leibovit

James Thorne

Victor Adair