

Finally, technical evidence of at least a short term peak in most equity markets and sectors has surfaced. Appropriate action is recommended –
(Ed note: Click HERE for the entire interview with Michael Campbel)
MORE NOTES FROM DON
Earnings focus this week remains on the Canadian banks.
Economic news this week is expected to have a neutral impact on equity markets. Data is not expected to change significantly from previous monthly reports. Investors are waiting for more clues about timing of winddown of Quantitative Easing
Currency wars will continue. Volatility in currencies was exceptional last week and is expected to continue.
Short term technical indicators turned bearish last week and intermediate term technical indicators are showing early signs of peaking from intermediate overbought levels. Bearish key reversal patterns were recorded on Wednesday by broadly based U.S. equity indices and most sectors. Broadly based equity indices around the world quickly followed. Initial targets for broadly based U.S. equity indices is to the top of previous trading ranges on the breakout on May 3rd following the surprising April employment report: S&P 500 Index to 1,597, Dow Jones Industrial Average to 14,887 and the NASDAQ Composite Index to 3,307.
Economically sensitive sectors were notable underperformers last week including Industrials, Materials, Financials and Technology, typical underperformance on a seasonal basis for this time of year.
Large cash positions held by Canadian and U.S. corporations continue to be employed in dividend hikes and share buy backs, a short term bullish scenario with long term negative implications.
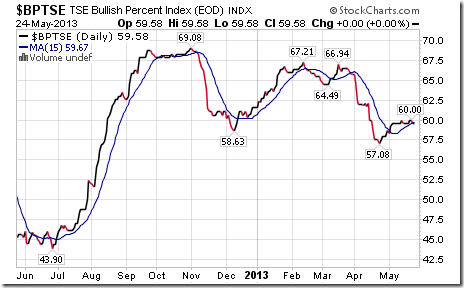
Bullish Percent Index for TSX Composite stocks was unchanged last week at 59.58% and slipped below its 15 day moving average. The Index remains intermediate overbought.
The TSX Composite Index added 54.17 points (0.43%) last week. Trend remains up. The Index found resistance near the 12,900 level. The Index remains above its 20, 50 and 200 day moving averages. Strength relative to the S&P 500 Index changed from negative to neutral. Technical score based on the above technical indicators increased to 2.5 from 2.0. Short term momentum indicators are rolling over from overbought levels.

Percent of TSX stocks trading above their 50 day moving average increased last week to 55.42% from 49.17%. Percent is intermediate overbought.

Percent of TSX stocks trading above their 200 day moving average increased last week to 54.58% from 53.75%. Percent remains intermediate overbought.

For Don’s weekend Charts & Notes of every Market view HERE


