
Energy & Commodities
 In the world of investing, there’s a lot to be said for buying undervalued assets.
Occasionally the market provides some incredible opportunities to pick up high quality assets so cheap that, to paraphrase acclaimed investor Jim Rogers, all you have to do is walk over and pick up the money lying in the corner.
One of the benefits of traveling the world so extensively is that I’m constantly exposed to these sorts of opportunities. And occasionally surprised when I’m not.
When visiting Bangladesh a few weeks ago, for example, I was surprised that asset prices were so expensive. The Dhaka stock market index was trading at nearly 20x earnings… hardly a bargain.
This only further solidified my view that Quantitative Easing in the West (specifically in the United States) has really taken a toll around the world in creating spectacular asset bubbles. But that’s a different story.
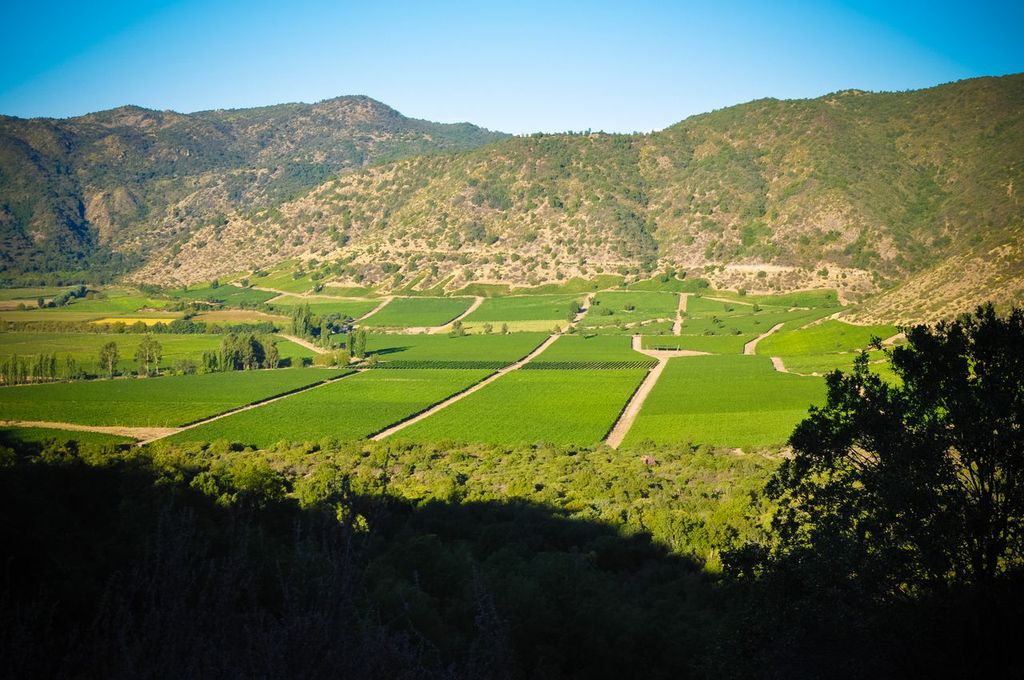
Here in Chile, there’s a number of asset classes that are undervalued. I’ve been very vocal over the last year or two that farmland prices in Chile are some of the most attractive in the world.
For example, farmland with ultra-high quality soil can be had for $4,000 to 6,000 per acre or less. In the US and Europe, it can be 2-3 times that cost.
Not to mention, the taxes, labor costs, regulatory costs, and overall operating costs are much lower here.
Now, there are places in the world where farmland is cheaper. Africa. Argentina. Bolivia. But you’re taking a lot more political risk. And in most of those cases, you’re not going to find the same rich, volcanic soil and temperate Mediterranean weather.
As I’m heavily involved in agriculture operations here, I’ve made the apples-to-apples comparison (and blueberries-to-blueberries comparison as well). And I’ve found that the profit per acre here is multiples higher than in the US or Western Europe.
It’s possible, for example, to generate 40% to 50% unleveraged returns from high value perennials… and 15% to 20% on seasonal crops like corn.
Given that farmland yields in much of the developed world are more like 2% to 4% (or less), it’s obvious that farmland in Chile is deeply undervalued… and that farmland in the developed world is likewise overvalued.
Now, I really don’t recommend that people try to rush down here and buy farmland. In fact, I strongly recommend against it. Most people are going to be taken to the cleaners.
The hard truth is that it’s -very- difficult to buy property here… and the due diligence requirements can be exhaustive. I spent 9-months conducting due diligence before I closed on my first property in Chile. And there are few credible experts here whose opinions can be trusted.
The market here is very insular. It’s not like being in North America or Europe where you can ask Google to serve up the answers on a neatly organized web page. It takes a LOT of boots on the ground effort.
Not to mention, there are numerous pitfalls for an absentee foreign owner of agriculture property in a country where s/he doesn’t speak the language. And if it goes south, it can be a multi-million dollar mistake.
So as grand as the opportunity in Chilean farmland may be, the challenges are very real.
But there’s something else down here that I think is an even bigger opportunity. It’s easy to purchase, easy to own, and there’s very little maintenance involved. And it’s, by far, one of the most deeply undervalued assets I’ve ever seen.
I’ll tell you all about it tomorrow–
Simon Black
Senior Editor, SovereignMan.com

G8 Going to Hunt Down ALL Capital

These people cannot understand what they are doing to the world economy or even grasp why the liquidity has shrunk by about 50%. People do not believe the rise in the Dow claiming it is on low volume. They fail to grasp that everywhere we look, there is a massive contraction in global liquidity. As the VELOCITY of money declines, so does economic growth and that results in rising unemployment.
 Sorry, there is no HYPERINFLATION. I have stated before, there will come the day you will PRAY forHYPERINFLATION for what we are headed into a black hole beyond anything historically within the global economy. This is getting worse week by week and in all honesty, the collapse in the VELOCITY of global investment is very, very serious. When this turns down from 2015.75, it will be far worse than what we saw with the 2007.15 turning point. They can control the press to hide the truth, but that will not prevent the demise. In fact, all the loss of the free press will accomplish is total shock and that will result only in a much more pronounced panic in the future.
It is the Guardian in Britain that is becoming the leading newspaper to read:
G8 countries agree to tackle tax evasion
Joint declaration by leaders at Northern Ireland summit falls short of demands by tax campaigners
…..read HERE

Is China the long silver ranger?
Could China be the big silver long? Who else has deep enough pockets to endure the recent price weakness and the increased margin requirements that typically follow?
Nevertheless, the Chinese willingness to accept fungible dollars instead of precious metal seems to be waning. They are quietly accumulating metals.
Perhaps this explains why the silver open interest has remained stubbornly high throughout the most egregious washouts the silver market has seen in years.
Normally this has the effect of clearing out weak longs, often setting the scene for a price turnaround based on the COT structure.
This could be just a subset of a peaceful currency maneuvering plan.
China is Now a Net Importer of Silver
 China used to export silver, but it has recently turned into a net importer. It would therefore make sense for the Chinese to seek delivery, especially given the difficulty of obtaining a reliable stock of silver these days.
Outside of the big ETF (SLV) and COMEX, no significant (government) stockpiles of silver currently exist. Furthermore, scrap flow is typically reduced in a soft market, since people are less willing to part with their recyclable silver metal.
Miner acquisition is also relatively difficult, and its feasibility can often be affected by politics and the lack of opportunity.
The silver miners — including the few primary silver producers — have long suffered from suppressed market pricing. Furthermore, what capital and financing they receive usually comes from the same bullion banks who keep the price of silver artificially low.
China and other sovereigns would naturally seek to reduce the level of their forex reserves denominated in U.S. dollars, especially considering the Fed seems locked into its role as lender of last resort to the world — and especially to the Eurozone.
A case in point is that $600 billion of QE2-generated electronic cash actually went to foreign banks as a way of building capital reserves in lieu of ECB balance sheet expansion.
The Irony of it All
The silver market has often noted a phenomenon of overnight dumping that is typically seen at the Asian open, but it is timed to occur before most Asians are actually awake.
It is now thought to be U.S. operators initiating the selloffs at Asian openings. Could this be yet another front in the trade/currency war?
New buyers for silver currently seem to be waiting in the wings to accumulate silver on the dips. Of course, the silver market has been a “buy the dip” market since the 1980s, which is the classic investment strategy employed in a long term bull market.
Short-Term vs. Long-Term Perception
The Chinese tend to take a long-term view and are notorious for being far sighted in their investment habits.
Not only is it necessary to go back decades to understand and gain perspective on the silver market’s currently situation, but it is also interesting to project forward several decades.
The key to doing this is using the measuring stick (the U.S. dollar) as the proxy. Furthermore, observing the persistent rise in unfunded liabilities should help any potential silver investor maintain a bullish long-term view on silver.
However, for those hoping for a silver rally in a shorter time frame, it might be helpful to be reminded of the (high open interest with a reduced, though still concentrated short) structural set up in the silver futures market that allows price suppression to exist.
by Jeffrey Lewis


All of a sudden volatility has come back. Over the last several weeks we have seen sharp one day selloffs that has sent the media into an absolute frenzy followed by large surges the next day with the media telling you now is the time to jump in. For the average investor it has been more than just a little confusing as to what should be done with portfolios.
It is sometimes very confusing for investors to discern what they should be doing because of the day to day noise from the media. As I stated above; the media attributes whatever is happening during a particular trading session to the news item of the moment – whether it is relevant or not.
This presents a real difficulty for investors to navigate the management of their portfolio – which is why most individuals simply don’t. This is why we encourage you to step back from the day to day “noise” to see the bigger picture. It is much like art – take a look at a very famous work of art below.

When you stand too close to the painting you lose perspective, detail and the connectivity of the overall painting. However, if you step back you see Claude Monet’s “Sunrise.”
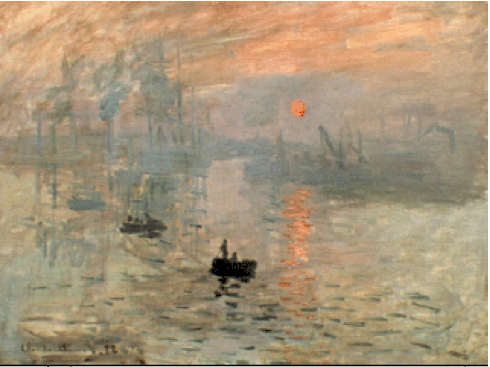
This is the primary problem for fundamental investors. The focus on financial ratios, historical comparisons and valuations keeps analysts, and portfolio managers, standing too close to the market. This is why they consistently miss the detail and connectivity of the overall environment.
This is also the same problem that individuals face daily when reading the latest headlines or listening to the financial media. Daily headlines rarely have anything to do with market action in the short term. However, each day, we are inundated with the details of some economic, or corporate, report that is responsible for moving the entire market. Even though this is absolutely not the case; individuals, and professionals, continue to stand too close to the painting and miss the broader detail.
Take a look at the chart below.
…..read the whole 17 page report HERE

-
I know Mike is a very solid investor and respect his opinions very much. So if he says pay attention to this or that - I will.
~ Dale G.
-
I've started managing my own investments so view Michael's site as a one-stop shop from which to get information and perspectives.
~ Dave E.
-
Michael offers easy reading, honest, common sense information that anyone can use in a practical manner.
~ der_al.
-
A sane voice in a scrambled investment world.
~ Ed R.
Inside Edge Pro Contributors

Greg Weldon

Josef Schachter

Tyler Bollhorn

Ryan Irvine

Paul Beattie

Martin Straith

Patrick Ceresna

Mark Leibovit

James Thorne

Victor Adair