Timing & trends

Gold and Gold Stocks, Post FOMC Update

The Fundamental Backdrop is Still the Same, But …


The FOMC statement was once again almost a carbon copy of the last one. The only noteworthy event worth commenting on is that in addition to the hawkish dissenter Esther George, John Bullard dissented because he felt the Fed’s actions are not dovish enough (he’s worried about ‘inflation being too low’ of all things).

Still, it is the market reaction that counts, and nearly all markets except the dollar reacted rather badly to Ben Bernanke’s news conference – even though it actually contained no news. Treasury yields soared, stocks were whacked, and so was gold. When we last wrote about gold and gold stocks we remarked:

Gold-descending-triangle

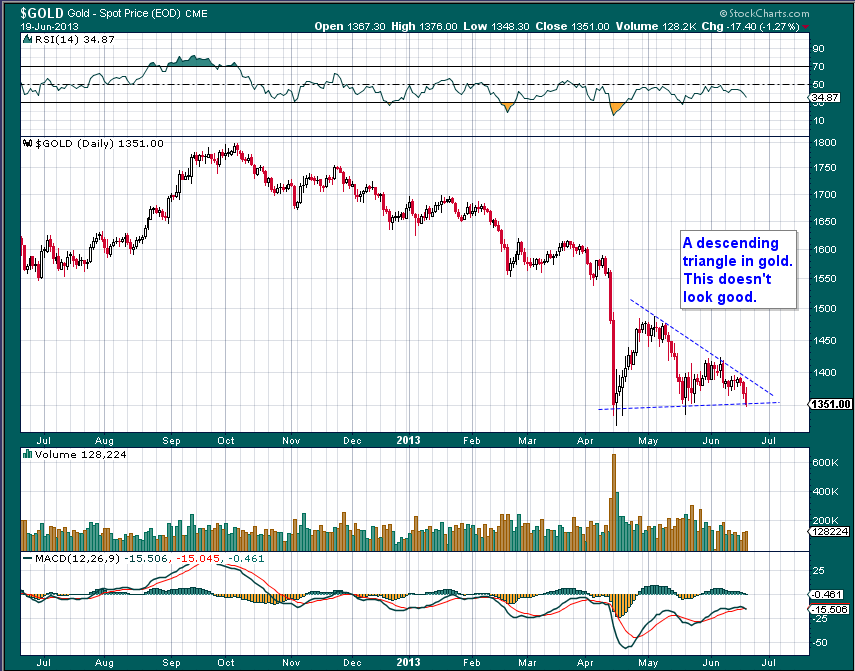
“Unfortunately the HUI index violated the previously highlighted gap support in Tuesday’s trading, which killed the ‘island reversal’ idea (it did however revive the idea that all upside gaps in the index tend to eventually be closed). It was especially worrisome that this happened with gold relatively stable, i.e., the HUI-gold ratio once again went into the ‘wrong’ direction. Per ample experience that is a sign that gold is set to decline further in the short term (we are always open to surprises on that front, but those are rare).

Gold itself is conspicuous by its utter failure to profit from recent weakness in the US dollar. This is a bearish sign as well.”

,,,,,read more HERE


The Bond Implosion Has Officially Begun

The QE Infinite parade officially ended yesterday when Bernanke hinted at tapering QE later this year or in mid-2014.

I first warned my clients about this in mid-May writing,

If Bernanke is going to step down (as hinted by his decision to skip out on the Jackson Hole meeting) he’s not going to want to leave with the Fed going at QE 3 and QE 4 full throttle.

Instead his best bet would be to take his foot off the gas a little bit, giving his replacement a little room to maneuver if things get ugly.

Source: Private Wealth Advisory

This is precisely what Bernanke is trying to do. However, there is another far larger issue at work here.

The primary driver of stocks for the last four years has been the hope of more Fed stimulus. This hope has put a floor under ALL asset prices as market participants KNEW the Fed was involved in the markets. As a result EVERYTHING (stocks, bond commodities, even currencies) has been artificially propped.

By calling for the end to QE 3 and QE 4, the Fed has begun to remove these market props. Which means that the markets are now going to start adjusting to where assets prices REALLY SHOULD BE.

Take a look at the spike in the 10-year Treasury yield:

6-20gs

This is just the start. I warned my subscribers in our most recent issue that higher rates were coming noting a collapse in bonds in Europe and the emerging market space.

This could easily become truly catastrophic. The world is in a massive debt bubble and the Central banks are now officially losing control. The stage is now set for a collapse that could make 2008 look like a joke.

If you are not preparing in advance for this, the time to get started is NOW.

For insights on how to prepare for a market collapse… including taking out portfolio “insurance” and which investments perform best during a crash…

http://gainspainscapital.com/protect-your-portfolio/

Best Regards

Graham Summers


In April the gold price buckled and fell $330, $200 of which took only two days. It was a well-engineered bear raid, initiated by over 400 tonnes of ‘short’ positions on the COMEX futures and options market. But the futures and options market is not likely to cause the price of gold to fall as only 5% of that market involves the physical delivery of gold and then only after the counterparty has been put on notice that physical delivery of gold is required.


But over the period of the bear raid, 200 tonnes of physical gold was sold and delivered from the COMEX warehouse. The two main banks involved, JP Morgan Chase and Merrill Lynch, used up at least 200 tonnes of their own gold selling it to force the price down. But the main incentive to sell came from the persistent sales of gold from the SPDR gold ETF, which has seen around 500 tonnes of gold sold from the fund over the last three to four months. So the big holders of gold in the U.S. sold just under 1,000 tonnes of gold in the last three to four months, with the bulk being sold in mid-April. It is therefore quite a surprise that the gold price only fell the $330 that it did.

The focus of this piece is not to look at the potential for a ‘short squeeze’ (which is huge) but to look at the ability of the U.S. institutions involved to not only repeat the exercise, but to influence the gold price in the future. More particularly can the country push the gold price down much further or has it used up all its powder in the last bear raid?

The SPDR Gold ETF & the Gold Trust

These two gold ETFs are the main holders of gold in the U.S. The Gold Trust, at its peak, held 200 tonnes of gold. The SPDR gold ETF held over 1,500 tonnes. Today the Gold Trust is down to 186.33 tonnes and the SPDR gold ETF is down at 1003 tonnes. The unanswerable question is how much more of that 1,000 tonnes is being held with short-term to medium-term profits in mind and how much is being held as a core holding, being held for the long term (i.e. will not be sold no matter what)? If the entire amount is going to be held long-term then no more sales will come from this fund. If another 500 tonnes is a profit oriented holding then this could be sold in the future. The same thinking applies to the Gold Trust. We know that COMEX will consider 200 tonnes held in its warehouses on the low side already and the banks and hedge funds would not be happy to run their stocks down further.

The object of the exercise is to gauge whether the U.S. could launch another bear raid on the gold price and push the price down much further.

Is the Price of Gold Relevant to Price Vulnerability?

Price is also a major consideration because that will dictate the response demand will give. After the gold price crashed in April, physical demand from all over the world came in frantically to pick up gold. We estimate that nearly the entire amount sold went to Asia or central banks and has left to market into very long-term holder’s hands. For that gold to return to the U.S.A. would require a price that rose very quickly and looked ‘toppy’, for Asian sellers to come to the market as sellers. That price would have to be several hundred dollars over the current price level.

Support for the gold price is further helped by the drop in payable reserves the mines now have. With cost in the gold mining industry per ounce being so high, the volume of profitable reserves drops sharply as the mine has to move to grades that are more profitable. Allowing for a return on capital, the mines currently need between $1,000 and $1,500 to make any profits unless they move to higher grade –so shortening the life of the mine.

Scrap sellers who were comfortable selling gold over $1,650 pull off the market when the price tumbles like this. After all if it rebounds, after they have sold, they are most unhappy, so they wait until the price recovers. So a large chunk of ‘scrap sales’ leaves the markets.

Demand Would Rush in at Lower Prices

Combine these supporting factors and it becomes clear that if the gold price does fall much lower, buyers will rush into the market as they did in May. A ‘bear raider’ could not afford to take the risk of selling physical gold, only to see the gold price jump thereafter. He would then pay dearly to close his short positions. It would be too risky.

So in short, another bear raid is unlikely at these levels. More importantly with the available stock of gold remaining in the U.S. at such low levels, another bear raid would use these up in large part. If that happened the ability of the U.S. gold markets to influence the gold price would be lost completely. The dominant influence over the gold price would have moved to Asia.

Shift of Power over Gold Moves East

What this would mean to the gold price would be that the power of U.S. speculation over the gold price would have been used up as the gold needed for this purpose would have left the States. It would render reports that tell us “the gold price fell because U.S. housing starts had jumped last month” incorrect, because U.S. investors would not have the ability to speculate in the volumes needed to move the gold price.

With the global cash flow, estimated by Wolfensohn, ex-head of the World Bank, changing from 80% to the developed world and 20% to the rest of the world, to 65% to the rest of the world and 35% to the developed world, the Asian influence over the gold price would dominate, relegating the present influences from the developed world, to history.

Is the U.S. Selling Gold from Reserves?

Competent analysts are debating whether central banks are supplying the market to keep the gold price down at the moment. The first question we ask is, “What would this achieve except to delay a collapse of the key currency markets?”  With a multi-currency system approaching on the horizon a collapse of the system would have to be an immediate prospect to warrant such sales. This is because when that multi-currency system does arrive, gold reserves will play a pivotal role in the monetary system. So central banks would lose a key resource in maintaining stability in currency markets if they used gold now. Bearing in mind that European central banks individually are locked into a Central Bank Gold Agreement, which does allow sales but has not seen any –in the spirit of the agreement—since 2009.

So we would be surprised to see such sales at this time.

Consequences

What we have looked at in this article is:

1.   Do the U.S. markets have the gold available and willing, to be used to suppress the gold price much longer? We think that this amount is dropping daily and will run out.

2.   The gold used for that purpose to date has left the U.S. and is now in Asia.

3.   A fall from current price levels would attract tremendous demand, so further price suppression would need large volumes of gold to effectively keep prices down.

4.   Current supplies of gold are falling precisely because gold prices are so low.

5.   With Asia gradually becoming dominant over the gold price, with the view that it should be acquired for the long-term and continuously, the U.S. is losing its influence over the gold bullion markets.

Will the new influences show themselves quickly and dramatically? We think now. What we will see are a narrowing of speculative price moves with a tendency to react less and less to developed world micro events. We will continue to watch the sales from the SPDR gold ETF as a prime indicator of the current U.S. influence and its weight of influence on the global gold market.

Hold your gold in such a way that governments and banks can’t seize it!

Enquire @ admin@StockbridgeMgMt.com


Get it First. Subscribe @

www.GoldForecaster.com

www.SilverForecaster.com

Legal Notice / Disclaimer

This document is not and should not be construed as an offer to sell or the solicitation of an offer to purchase or subscribe for any investment.  Gold Forecaster – Global Watch / Julian D. W. Phillips / Peter Spina, have based this document on information obtained from sources it believes to be reliable but which it has not independently verified; Gold Forecaster – Global Watch / Julian D. W. Phillips / Peter Spina make no guarantee, representation or warranty and accepts no responsibility or liability as to its accuracy or completeness. Expressions of opinion are those of Gold Forecaster – Global Watch / Julian D. W. Phillips / Peter Spina only and are subject to change without notice. Gold Forecaster – Global Watch / Julian D. W. Phillips / Peter Spina assume no warranty, liability or guarantee for the current relevance, correctness or completeness of any information provided within this Report and will not be held liable for the consequence of reliance upon any opinion or statement contained herein or any omission. Furthermore, we assume no liability for any direct or indirect loss or damage or, in particular, for lost profit, which you may incur as a result of the use and existence of the information, provided within this Report.

Todd Market Forecast

Todd Market Forecast for Wednesday June 19, 2013  

Available Mon- Friday after 6:00 P.M. Eastern, 3:00 Pacific.            

DOW                                                      – 206  on 2000 net declines

NASDAQ COMP                                 – 39 on 1000 net declines

SHORT TERM TREND                       Bullish 

INTERMEDIATE TERM TREND       Bearish  

STOCKS: The Fed sees a brighter outlook for the economy and this was taken as a sign that the central bank would, at some point, begin backing away from its bond buying, or more accurately money printing.
 
What makes this laughable is the fact that the Federal Reserve’s predictive powers are historically pathetic. Nevertheless, a lot of investors think that Fed members can “see” what lesser men cannot. Totally ridiculous. 
   
GOLD:  Gold lost another $16. Part of the reason is that the Fed “sees” diminished inflation and of course, part of gold’s allure is as an inflation hedge. We’re now getting a second full retest of the April lows. 


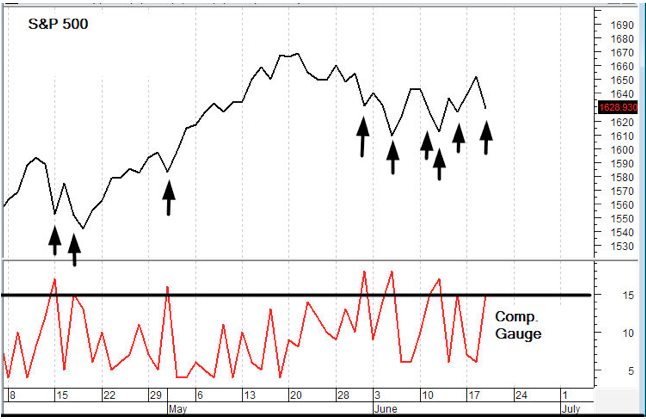
CHART: We report the single day reading of the Composite Gauge on this hotline. When it is 15 or above, the next day or two tends to be higher. That’s one of the elements of our system 2 signal which did give us a buy today. 

Screen shot 2013-06-19 at 4.50.08 PM

TORONTO EXCHANGE:    Toronto was down 99.                

S&P\TSX Venture Comp: The Venture Comp was lower by 64.                                                

BONDS: Bonds were hit pretty good.                                               

THE REST: The dollar surged up. Silver, copper and crude oil were lower.         

BOTTOM LINE:  

 Our intermediate term systems are on a sell signal as of June 4, 2013. 

System 2 traders    We had another signal. ddddddddddddddddddddddddddddddddddddd

System 7 traders   We are in cash. Stay there on Thursday.                      

Stock investors We are long Intel from 21.61 with a stop at 22.50.     

NEWS AND FUNDAMENTALS:  

We’ve discussed the FOMC. On Thursday we get initial claims, PMI Mfg. Ind. Flash, existing home sales and the Philadelphia Fed Survey.   

————————————————————————————  

Screen shot 2013-06-19 at 5.26.05 PM
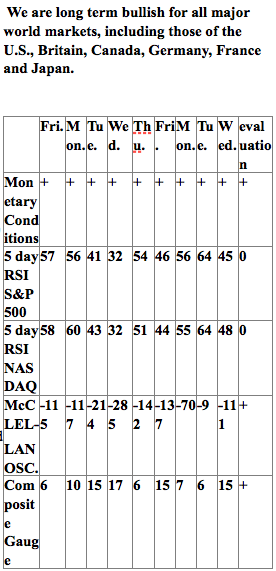
INDICATOR PARAMETERS

     Monetary conditions (+2 means the Fed is actively dropping rates; +1 means a bias toward easing. 0 means neutral, -1 means a bias toward tightening, -2 means actively raising rates). RSI (30 or below is oversold, 80 or above is overbought). McClellan Oscillator ( minus 100 is oversold. Plus 100 is overbought). Composite Gauge (5 or below is negative, 13 or above is positive). Composite Gauge five day m.a. (8.0 or below is overbought. 13.0 or above is oversold). CBOE Put Call Ratio ( Below .80 is a negative. Above 1.00 is a positive). Volatility Index, VIX (low teens bearish, high twenties bullish), VIX % single day change. + 5 or greater bullish. -5 or less, bearish. VIX % change 5 day m.a. +3.0 or above bullish, -3.0 or below, bearish. Advances minus declines three day m.a.( +500 is bearish. – 500 is bullish). Supply Demand 5 day m.a. (.45 or below is a positive. .80 or above is a negative).

      No guarantees are made. Traders can and do lose money. The publisher may take positions in recommended securities. 

RANKED # 1 BY TIMER DIGEST

   Timer Digest of Greenwich, CT monitors and ranks over 100 of the nation’s best known stock market advisory services.           

   Once per year in January, Timer Digest publishes the rankings of all services monitored for multiple time frames.

   For the years 2003, 2004 and 2005, The Todd Market Forecast was rated # 1 for the preceding ten years. For the year 2006, we slipped to # 3 and in 2007, we were ranked # 5.

      Our bond timing was rated # 1 for the years 1997, 2007 and 2008. 

       Gold timing was rated # 1 for 1997 and # 2 for 2006. Late word! We were rated # 1 for 2011.

       We were # 1 in long term stock market timing for the years 1998 and 2004 and # 4 in 2010. 

   To subscribe go to Contact Us.


Jack Crooks: Interpreting The Moves by Bernanke & Fed

The Central Bank announced Wednesday it has no plans to change its buying policy. In short Ben Bernanke’s Fed intends to Maintain Stimulus while it Voiced Increased Optimism on Economy.

89

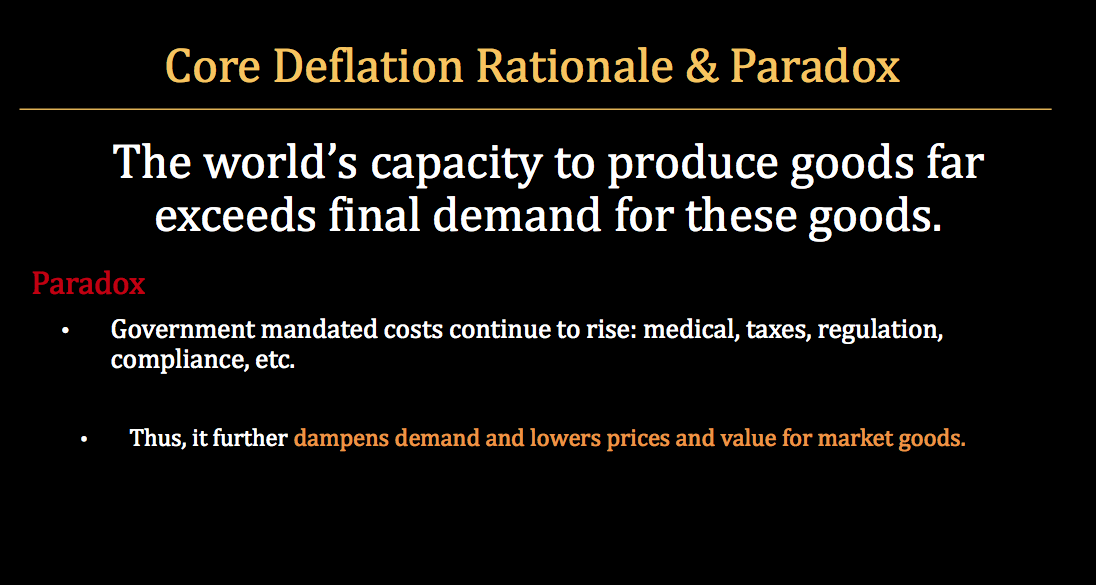
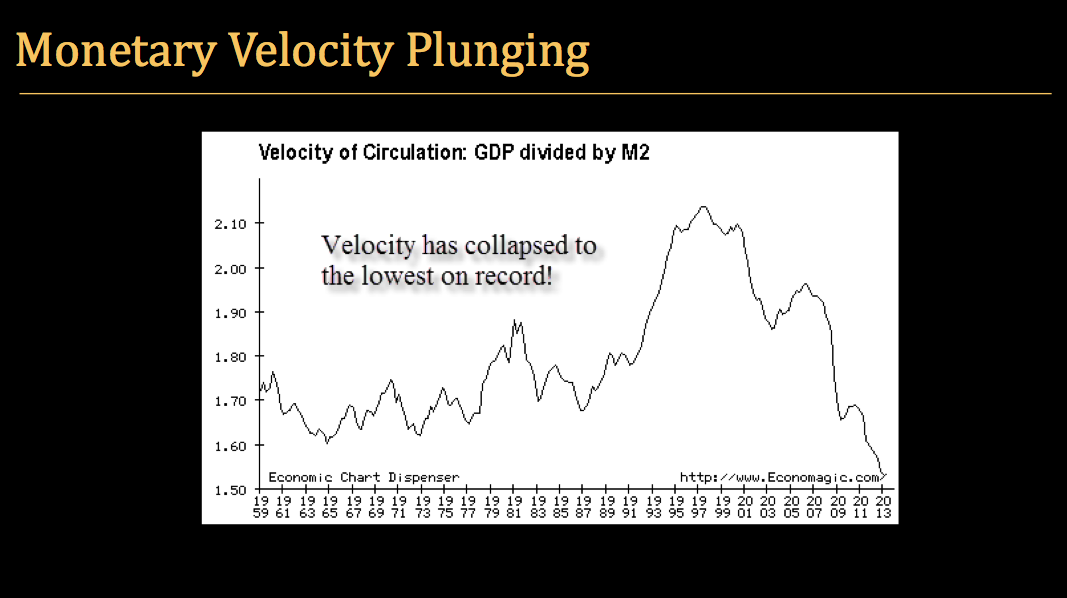
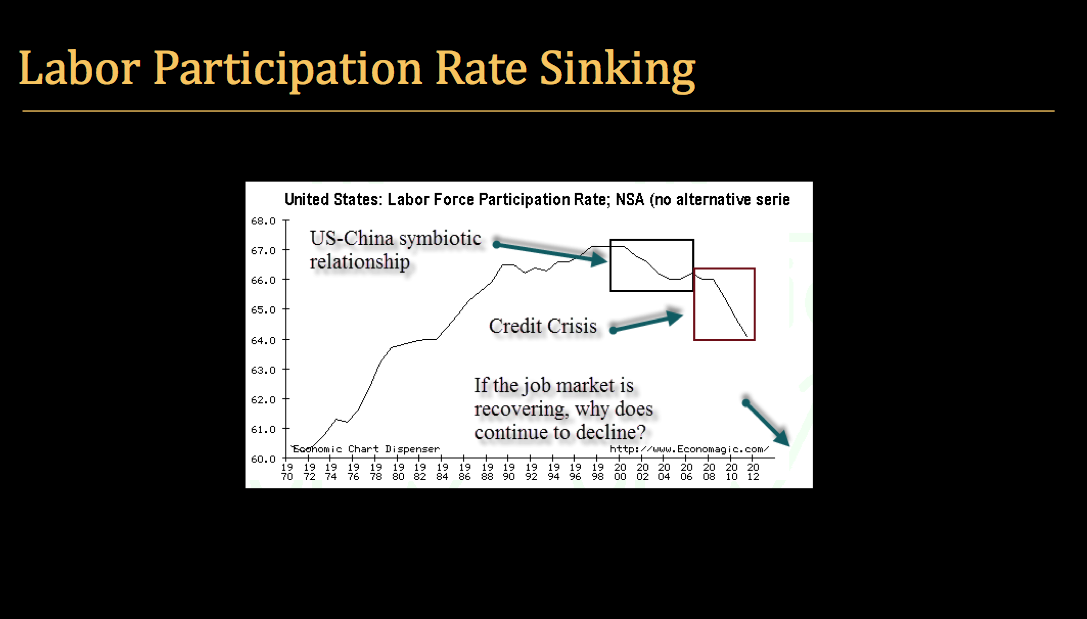
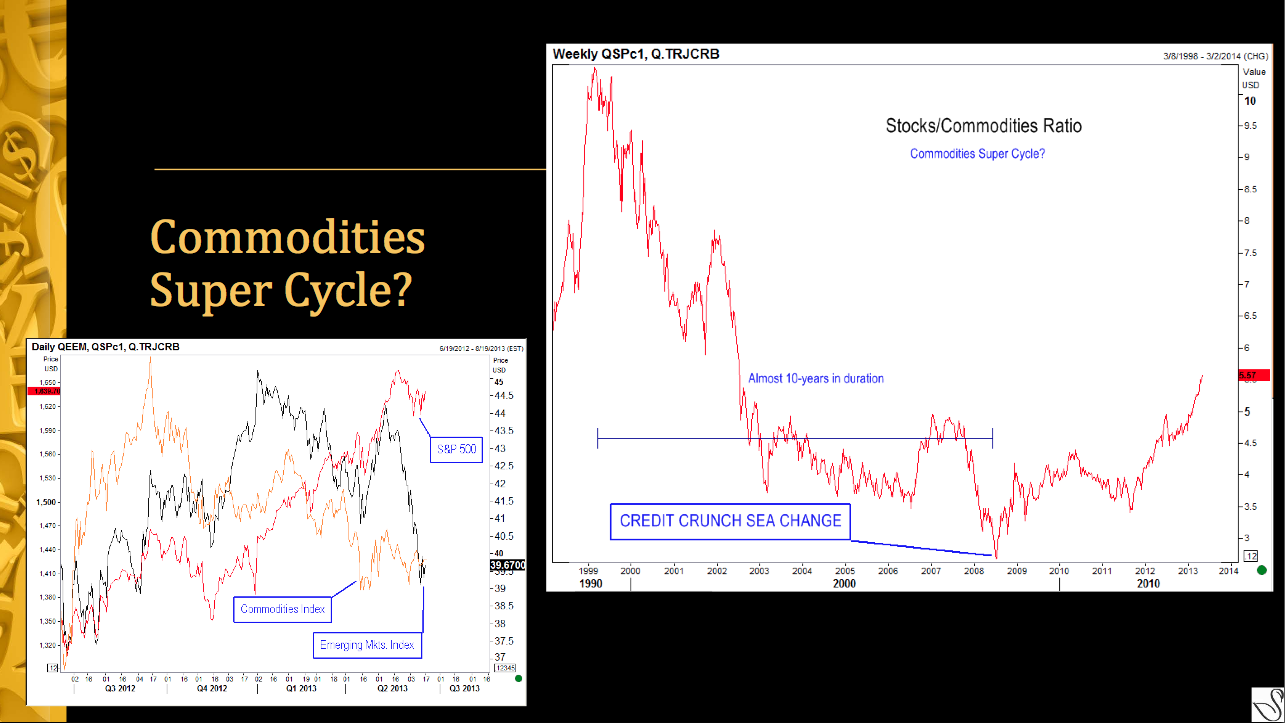
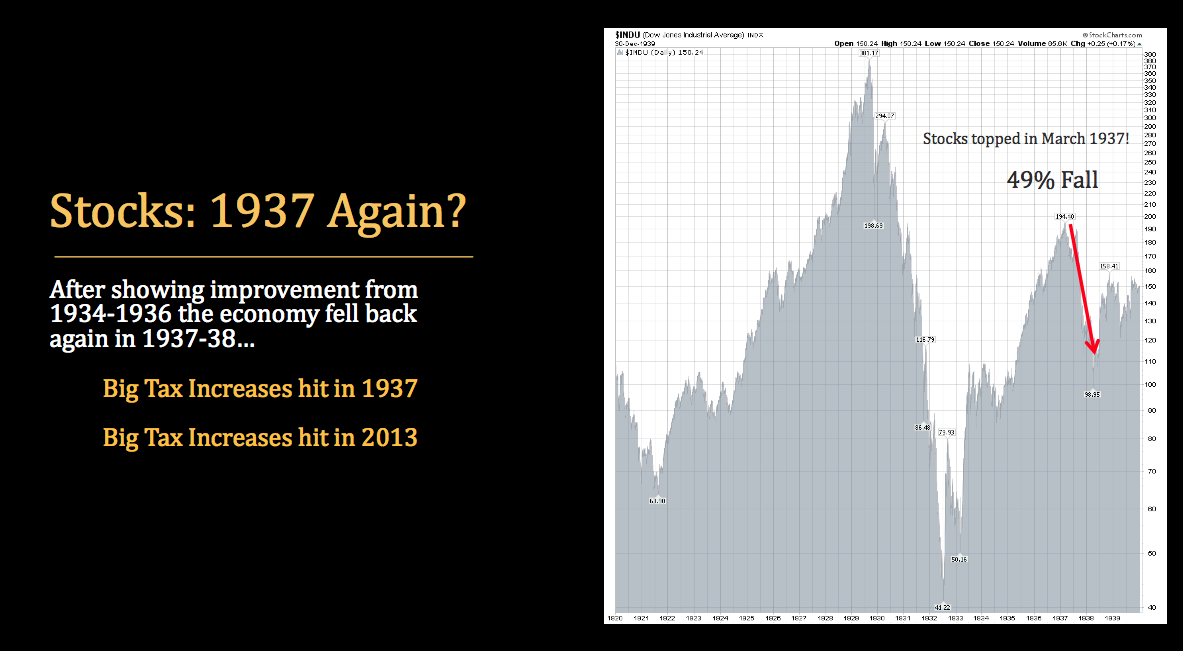
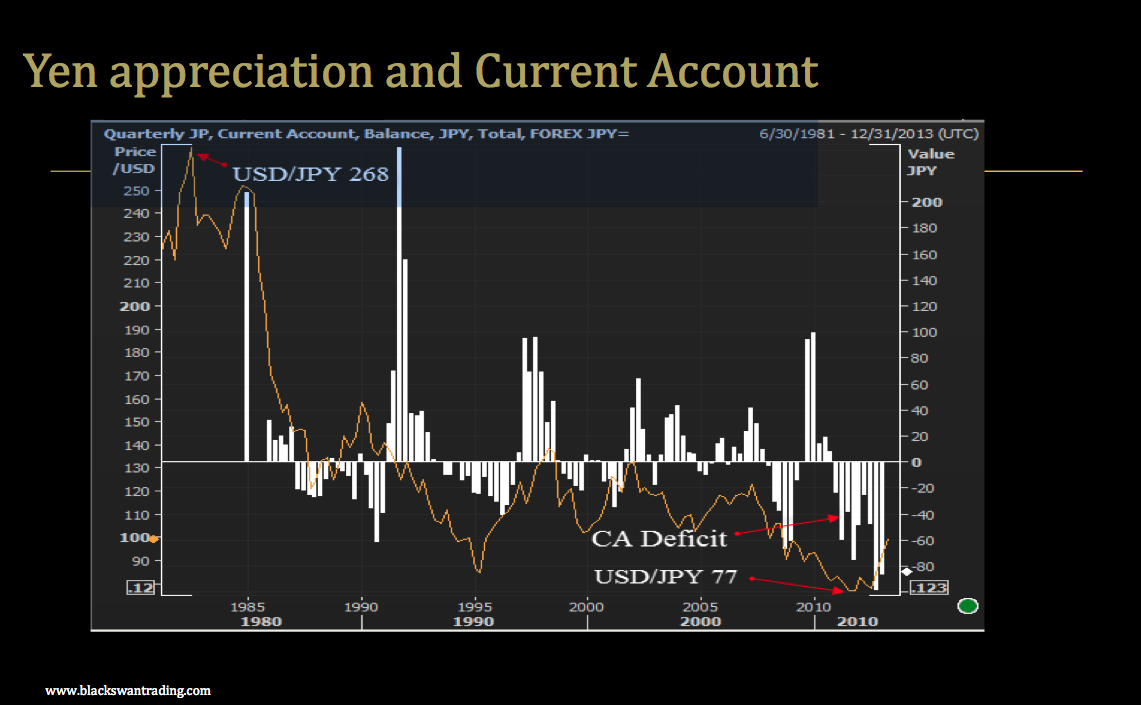
Below you have Jack Crooks Webinar Recording and PowerPoint commentary recorded after the19 June 2013 Federal Reserve Announcements. 

Please click HERE or on the image video driectly below to hear the commentary while viewing the powerpoint slides. 

Screen shot 2013-06-19 at 5.51.05 PM
 

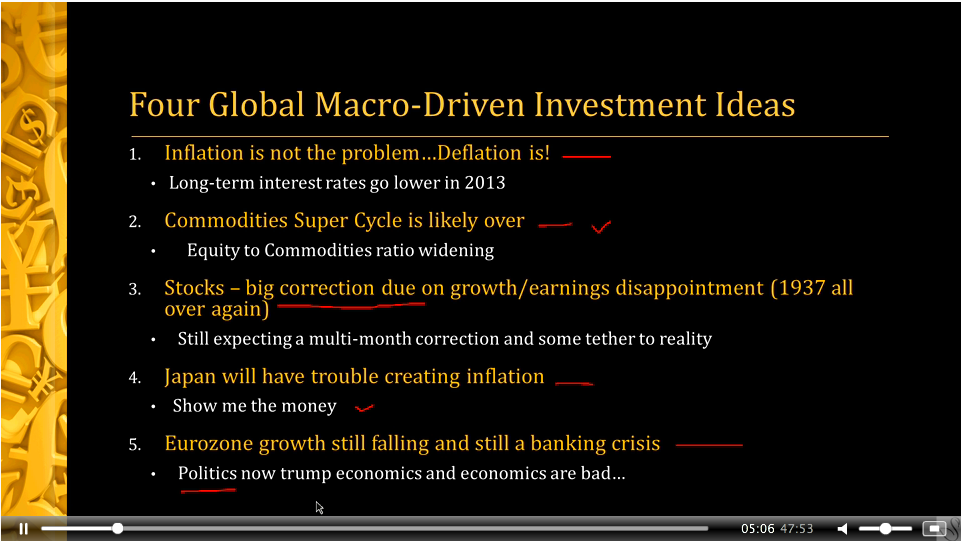
 The PowerPoint slides contained in the video above can be seen by themselves below.  

Screen shot 2013-06-19 at 5.41.45 PM

jcslide2

jcslide3

jcslide4

jcslide5

jcslide6

jcslide7

jcslide8

jcslide9

jcslide10

jcslide11

jcslide12

jcslide13

jcslide14

Be sure to sign up for our FREE DAILY REPORT HERE

MEMBER SERVICES

test-php-789