
Timing & trends
……Bull Market Far From Over
Investment guru gives his latest views on commodities, including gold and oil.
When Jim Rogers talks, investors listen. Rogers may be the world’s best-known commodity investor, with his Rogers International Commodity Index and best-selling books, including “Hot Commodities.” HAI Managing Editor Sumit Roy spoke this week with Rogers from his home in Singapore about commodities, including whether he’s ready to buy gold after the recent plunge in prices.
HardAssetsInvestor:A lot of investment banks have recently called an end to the commodities supercycle that began more than a decade ago. Do you think they’re wrong?
Jim Rogers: I’m delighted to hear that. Bull markets climb a wall of worry. I’m not quite sure where the supply is coming from that would cause the bull market to end. Maybe they know something I don’t. But when you look back at the stock bull market from 1982 to 2000, stocks collapsed in 1987, ’89, ’90, ’94, ’97, ’98. And every time, people said the bull market is over. But it wasn’t. This bull market in commodities will definitely come to an end someday. But someday is not here yet.
HAI: What signs do you look for to determine when the bull market is close to ending or has ended?
Rogers: Well, when there’s massive new supply coming on stream, then we’ll have the end of the bull market. But the world has consumed more agriculture products than it has produced for a decade now. But worse than that, we’re running out of farmers. The average age of farmers in America is 58; in Japan, it’s 66. Many of the industrial metals are now below the cost of production.
And nearly everybody has cut back dramatically on their expansion plans and investment plans. Oil reserves are declining pretty steadily around the world. We do have shale oil, which has caused a rise in supply. But that’s only in the U.S; the rest of the world has declined. Moreover, it remains to be seen how long the oil boom in the U.S. will continue.
HAI: All the talk recently has been about the recent plunge in gold. You’ve been saying, for a long time now— even when prices were hitting record highs—that you weren’t going to buy until prices corrected to $1,200. Are you still planning on buying there?
Rogers: Yes, if it gets there. I bought more today, as a matter of fact. I bought a little bit, not much, over the last few days in case this was the bottom. I would not be surprised if there’s another chance to buy lower later on, but I’m buying and I own it. I haven’t sold any.
HAI: How do you determine whether gold is a good value or not? What has to happen for you to get completely out of gold and stay out?
Rogers: All these things will end in a bubble some day. Long bull markets always end in a bubble or mania before it’s over with. And when there’s a bubble in gold, I hope I’m smart enough to get out. We haven’t seen a bubble yet. Until recently, if you went around any U.S. city, you would see signs outside many jewelry stores saying “We buy gold.” And the American people line up to sell gold. Later there’ll be signs there saying, “We sell gold,” and people will be lining up to buy it in big ways. That hasn’t happened yet.
……read more HERE

 Yesterday, it felt like all hell was breaking loose. It was the kind of day when each man looked to his own. He checked his bank balance and his margin account. He counted his gold coins and looked in his liquor cabinet. He wondered what would happen next…
The Dow fell -353 points. Gold lost $87 an ounce.
What does this tell us? It shouts a warning: Ben Bernanke is losing control. He desperately wants inflation. He’s getting deflation instead. He wants low interest rates; yet rates are rising.
Bernanke is now getting the worst kind of deflation – sluggish price increases against a backdrop of rising interest rates. Consumer prices are rising at their slowest pace in 53 years. And as PIMCO’s Bill Gross says, it looks as though the long bull market in bonds, which began 30 years ago, is finally over. Yields are rising. The feds’ borrowing costs are going up.
This is the exact opposite of what the Fed wants… and needs. Its strategy is to hold interest rates down while it pushes up consumer and asset prices. This would make possible a gradual growth in GDP while the real value of debt was whittled away by inflation. Then it could “taper” its QE.
Losing the Battle Against the Primary Trend
Instead, the debt gets heavier as yields rise. Backs ache. Legs buckle. Nerves crack.
Old timer Richard Russell comments:
Bernanke has finally realized that the Fed has lost its battle with the primary trend. The Fed and the economy are now at the mercy of the strengthening primary bear trend. Deflation, which the Fed has tried frantically to hold back, is now taking over. The Fed would like to exit the battle field but it can’t. The mere thought of the Fed giving up the battle to hold back deflation terrifies the stock and bond markets.
Years ago Ben Bernanke stated emphatically that he would never, ever allow the nation to deflate – even if he had to drop cash from helicopters to prevent it. But now deflation is happening. And Bernanke, the academician who has never understood markets, is frozen with confusion, consternation, and fear.
Everybody’s escape, so far, has been to rush headlong into Treasury bonds. But that avenue is no longer working (the bonds are sinking). The next avenue of escape is the dash for cash. Cash today amounts to intangible Federal Reserve notes, which are fiat paper and actually intangible financial garbage. The last and final avenue of escape will be to gold…
All over the world, the feds are trying to lock the exits and bar the doors.
David Franklin at Sprott Asset Management:
With the Indian rupee plumbing new lows against the US dollar and the country’s current account deficit at record levels, the Reserve Bank of India (RBI) is taking the easiest route to tackle both; it has declared a war on gold.
[T]he central bank has announced a series of measures over the past month, including restraining lending against gold-backed assets, and restricting gold imports. The hike in gold import duty to 8% this month is the most recent announcement in this drive and doubles the duty that was applied at the beginning of this year… Indian finance minister P. Chidambaram has even urged banks to advise their customers not to invest in gold.
Meanwhile, this news from France:
On May 23 the French government banned the delivery of all forms of precious metals, currency and jewelry by La Poste and all other branches of the French postal service.
The announcement was made through Legifrance, the legal publishing house responsible for all legislative publications. The ban was not reported by the press and the French government has made no statement.
[A]ll registered or insured precious metal shipments are forbidden by the French government.
Although the decree is limited in language to France, FedEx had also stopped shipping precious metals in March, without explanation. More recently, FedEx suspended all shipping or taking delivery of precious metals in Germany and Britain.
The gold price is falling. This signals to us that the Great Correction, which began in 2008, is entering a new phase. The can was kicked down the road by the feds. Now, the markets are stumbling over it. In the end, markets always triumph. And now, the markets are correcting, whether the Fed likes it or not.
What will happen next? Like everyman we wonder too. But we have a hunch. If the Great Correction intensifies, the feds will be forced to react. They can permit neither a bear market… nor deflation… nor higher interest rates. They will have to resort to Overt Monetary Financing… otherwise known as dropping money from helicopters.
Markets will rock, roll and lay down on the floor in spasms of laughter and revulsion. At the end of the day… when the dust settles and the music stops… gold will be the last man standing.
Regards,
![]()
Bill

- Stocks tank… again
- When the chop turns to slop…
- Plus: Where is gold in 10 years?
The summer chop has quickly turned into summer slop.
Yesterday, the Dow Jones Industrial Average suffered its biggest one-day decline since last year. If you’re keeping track, that last 300-point swoon came the day after Obama was elected to a second term. That was also just a couple of weeks before investors sparked a rally that would take the Dow from 12,500 to never-before-seen highs topping 15,400.
The market melt-up went uninterrupted for months… until yesterday. Now, the broad market’s uptrend has lost the benefit of the doubt.
So what does it all mean?
As I told you even before the market fell flat on its face, the easy-going conditions we enjoyed most of this year are gone. Earlier in the rally, we endured just three tiny corrective moves that immediately resolved to the upside well before any real worry could set in.
Yet even before yesterday’s slaughter, the current correction that began just last month had been the deepest pullback of the 7-month rally. It didn’t bounce with the same force that we saw earlier in the year…
Now, the market’s down almost 5% from its May peak.
Could we see more downside action? Absolutely. The market could chop its way lower the rest of the summer. Remember, these 5% and 10% corrections are all part of the game. If you’re expecting the market to glide higher without interruption, you’re going to leave the party disappointed.
As you slog through the next several weeks of market action, you need to avoid the circus of speculation surrounding Fed policies and other media-assigned “reasons” for the correction. Anyone trying to trade the news will get badly burned as the market feels its way through the summer. Don’t get sucked into the storyline.
For now, you know the drill. If you’re trading, you probably had a few stops trigger yesterday. Sell and prepare for your next move. If you’re a longer-term investor, you should hang on tight for now…
Rude Numbers
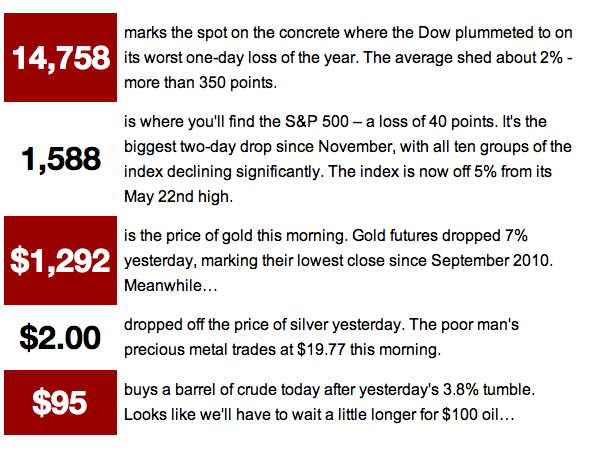
RUDE NUMBERS
“Gold may prove to be in a secular bear but as of now it is in a cyclical bear market,” writes a determined reader. “Long-term trendline is still higher and gold sits solidly above very strong support. It is quite likely this bull has another 10-plus years to run.”
Nope. Long-term trendlines are shot. Pick a time frame—the daily, weekly and monthly charts are all ugly. I said yesterday that gold might pause at $1,250. And after the big dump, we almost got there ($1,268 marked the lows).
As for 10 more years of higher prices… Well, I’m not holding out too much hope. That’s much too far in the future for me to be slinging predictions around. I can only go by what I see right in front of my face. And right now, that’s lower prices.
[Ed. Note: Send your feedback here: rude@agorafinancial.com – and follow me on Twitter: @GregGuenthner]
RIgnore at your Own PerilS
Ignore at your Own Peril
Today’s Must Read Links
- A near-death experience to profit from
- Retired Talk Show Host Reveals a Shocking Secret
- What Obama Can’t Do, These SIX Events Could
BE SURE TO ADD dr@dailyreckoning.com to your address book

Global financial markets are now in a very perilous state, and there is a much higher than normal chance of a crash. Bernanke’s recent statement revealed just how large a role speculation had played in the prices of nearly everything, and now there is a mad dash for cash taking place all over the world.
After years of cramming liquidity into the markets, creating massive imbalances such as stock markets hitting new highs even as economic fundamentals deteriorated (Germany) or were lackluster (U.S.), junk bonds hitting all-time-record highs, and sovereign bond yields steadily falling even as the macro economics of various countries worsened markedly (Spain, Italy, Greece, and Portugal), all of this was steadily building up pressures that were going to be relieved someday. Just over a month ago, Japan lit the fuse by destabilizing its domestic market, which sent ripples throughout the world.
The Dash for Cash
The early stage of any liquidity crisis is a mad dash for cash, especially by all of the leveraged speculators. Anything that can be sold is sold. As I scan the various markets, all I can find is selling. Stocks, commodities, and equities are all being shed at a rapid pace, and that’s the first clue that we are not experiencing sector rotation or other artful portfolio-dodging designed to move out of one asset class into another (say, from equities into bonds).
Here’s the data. Let’s begin with the place that the most trouble potentially lurks – bonds – and here we have to start with the U.S. Treasury 10-year note, as that is the benchmark for so many other interest-rate-sensitive items, such as mortgage bonds.
Here there’s been a very interesting story that predates the recent Fed announcement by nearly two months. This chart of the price of 10-year Treasurys tells us much (remember, price and yield are exact opposites for bonds; as one moves up, the other moves down):
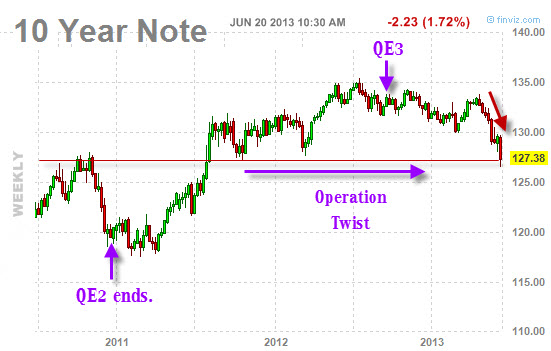
The first take-away is that the current price of 10-year Treasurys is now lower that at any time since late 2011. The second take-away is that this has happened despite both Operation Twist and QE3.
That is, after all the hundreds and hundreds of billions of dollars of thin-air money-printing and bond-buying, Treasurys are now lower in price than when the Fed initiated Operation Twist and QE3.
And it’s not just 10-year rates; the entire yield curve from 5-year to 30-year debt is now higher than it was a month ago:
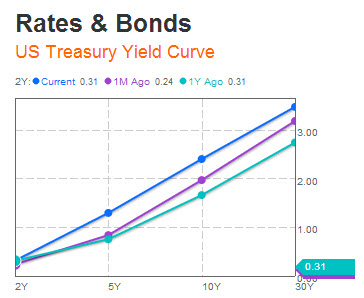
This is very, very important. On the one hand, it tells us that the Fed may not be omnipotent after all, because you can bet your bottom dollar that the Fed simply does not want long rates to rise and that this was an unplanned and unwelcome move. On the other hand, rising rates will do much to a fragile economy and over-leveraged speculators and institutions.
I may need more hands here, because there are other undesirable effects of rising rates, including falling equities (we’ll get to that in a minute), fiscal difficulties for heavy borrowers (many sovereign entities belong to this club), and mortgages becoming increasingly expensive.
An early casualty of rising U.S. interest rates, of course, was mortgage rates, which have climbed approximately 40 basis points (0.40%) over the past month:
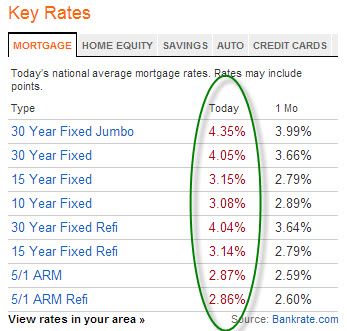
Obviously, anything that will impact the housing market at this point is entirely unwelcome by the Fed, which has openly stated that it wants people buying homes – and for a variety of reasons, people tend to take out fewer mortgages when rates rise. This is especially true for refinancing mortgages, an important source of revenue for financial institutions.
If it were just U.S. rates that were rising, that would be one thing, but rates have been on the move in Europe and Japan. In this next table, you can see two things: (1) much of the one-month rise in rates can be attributed to the past 24 hours (red arrows), and (2) quite a number of the most problematic nations have bond yields that are below their recent highs (as seen in the green circle).
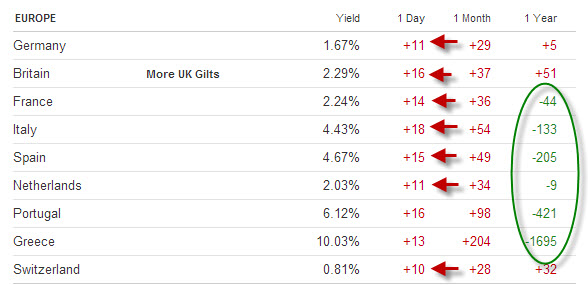
What I gather from this is that countries like Spain, Portugal, Greece, and Italy do not deserve the ridiculously low rates they now enjoy, and that those old highs in yield will be revisited.
Where the U.S. had a change in yield trend in mid-May 2013, Spain was leading the charge by reversing course in early May:
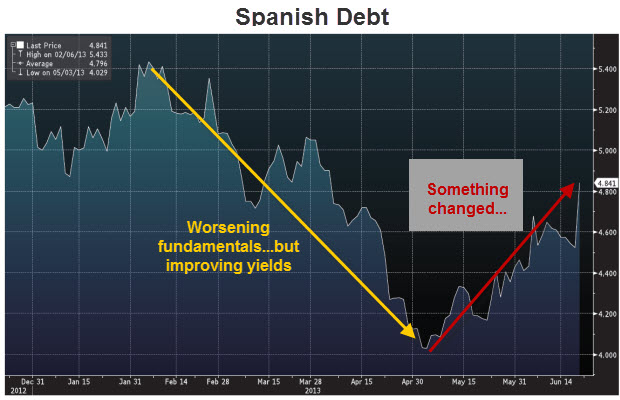
Who was buying all that junky sovereign debt at inflated prices as Spanish yields fell? Institutions and speculators. The institutions were entities like Spanish banks and the Spain pension system, buying Spanish debt for reasons that seem far more political than financially prudent. For a while, that strategy worked, as rising bond prices delivered both nice yields and capital gains, but now pretty much anybody who bought those bonds in 2013 is (at best) roughly even for the year, leaving plenty who are nursing losses.
The speculators in this story represented the hottest of the hot money, involving hedge funds jumping on any trades that seemed to be headed in the right direction and/or offered useful yields for spread trades, both of which conditions were met by southern European sovereign debt. But that hot money is best described by the phrase easy come, easy go. It arrives fast and leaves even faster.
Okay, so what we can say at this point is that bonds are being sold off around the world. This is very bad for equities, because there’s a connection between falling yields and rising equities. As yields fall, the risk-appetite of investors climbs because they need returns, and so they put more money into equities and real estate. This is especially true when interest rates are negative, meaning that they yield less than the rate of inflation, and that is precisely what the Fed engineered. On purpose.
However, this coin has two sides, and the less virtuous face combines rising bond yields with falling equities. It is simply the reverse of the Fed’s desired and manufactured outcome of the prior several years.
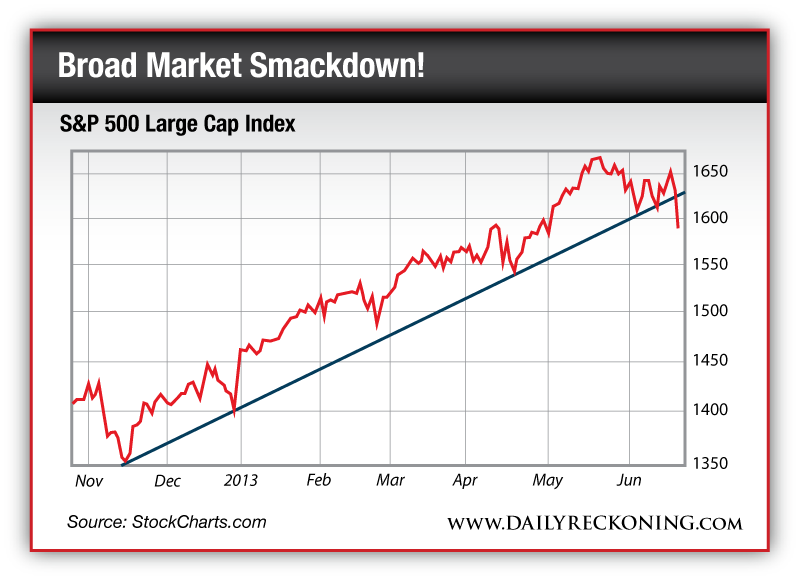
If we look at the U.S. stock market, as typified by the S&P 500, we see that it peaked in May (to no one’s surprise, I hope) and has been steadily falling over the same period that interest rates have been rising.
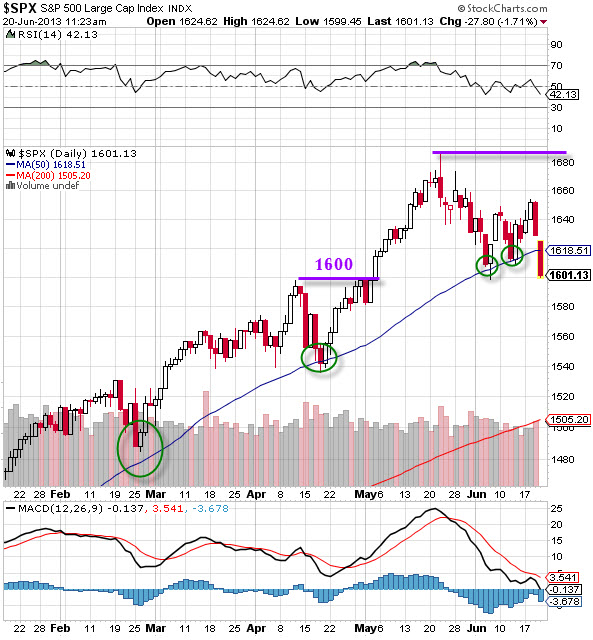
1600 is now the magic ’round number’ for the market to break through if it is heading lower, which I think it is. We’ll also note that the 50-day moving average (the rising blue line) has been critical support for the S&P 500 throughout the entire advance (green circles), and that it has been soundly violated on this drop.
Commodities have been heading down, too, but seemingly as a part of a larger move that’s been underway for a couple of years:
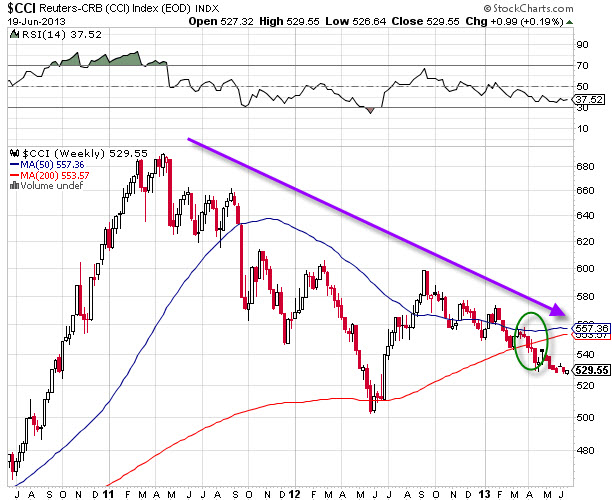
Note that commodities are now beneath their 200-week moving average, which is a very bearish indicator (green circle).
Collectively, the move away from commodities, bonds, and equities in all markets globally tells us that there’s nowhere to hide and that this is a 2008-style dash for cash. Everything is being sold, as it must, to meet margin calls, pay down leverage, and get out of positions; all are signs of the end of a speculative phase.
I know it’s a lot to claim that we are at that turning point, but the evidence that we are there is now more than a month old, and it’s time to consider that we are entering the next phase of our date with destiny.
What’s Coming Next
In Part II: The Ride Down from Here, we look at the increasing number of flashing indicators warning that a 2008-style – but worse – sell-off is arriving. We say “worse” because this time it looks like it will be accompanied by a vicious cycle of rising interest rates. Plus, governments and central banks have used up all of their major options already. There are no more white knights to hope for.
We examine the likeliest course from here for asset prices and what to expect from the central planners as desperation increasingly drives the decision-making. We also look at what defensive steps individual investors should be considering. Because, as we’ve been advising for months, now is a time for safety.
Buckle up. It’s going to be a bumpy summer.
Click here to read Part II of this report (free executive summary; enrollment required for full access).
About the Author
 Executive summary: Father of three young children; author; obsessive financial observer; trained as a scientist; experienced in business; has made profound changes in his lifestyle because of what he sees coming.
First of all, I am not an economist. I am trained as a scientist, having completed both a PhD and a post-doctoral program at Duke University, where I specialized in neurotoxicology. I tell you this because my extensive training as a scientist informs and guides how I think. I gather data, I develop hypotheses, and I continually seek to accept or reject my hypotheses based on the evidence at hand. I let the data tell me the story.
It is also important for you to know that I entered the profession of science with the intention of teaching at the college level. I love teaching, and I especially enjoy the challenge of explaining difficult or complicated subjects to people with limited or no background in those subjects. Over the years I’ve gotten pretty good at it.
Once I figured out that most of the (so-called) better colleges place “effective teacher” pretty much near the bottom of their list of characteristics that factor into tenure review, I switched gears, obtained an MBA from Cornell (in Finance), and spent the next ten years working my way through positions in both corporate finance and strategic consulting. From these experiences I gather my comfort with numbers and finance.

A friend called me up a couple weeks ago. He wanted to know when would be a good time to buy some gold coins.
I told him to call someone else.
Actually, I didn’t. But I did tell him to consider waiting. I thought gold could go significantly lower.
Gold started that “significantly lower” move this week. So my advice wasn’t too bad in the grand scheme of things.
But Elliott Wave’s was better.
Earlier this week — on Monday, actually — Elliott Wave International released a short-term update to their subscribers. I’ll let them explain:
![]()
Gold and Silver: A Great Day to be a Bear
Elliott wave analysis is the blade-proof glove with which “to catch a falling knife”
By Elliott Wave International
In the wee morning hours before dawn on Thursday, June 20, the precious metals’ rooster crowed, “Cock-a-doodle-DOH!” First, gold prices plummeted 4% then 5% then 6% below $1300 per ounce to their lowest level in nearly three years. Soon, silver followed in an even steeper drop below $20. Read more.
Is Elliott Wave International suggesting, with their falling knife subtitle, that it’s time to buy gold?
I guess you’ll have to read to find out. But I know that other gold watchers are open to an even deeper dip — into the $1,100 range if gold can’t stabilize soon.
Regardless, you have to wonder if we are not nearing the end of gold’s downside:

Clearly, gold needed a real correction after what everyone notes as 12 years in a solid bull market. It would seem that the latest surge lower is in reaction to interest rate expectations. (Remember: gold doesn’t offer yield, which makes it less appealing in an environment of rising interest rates.)
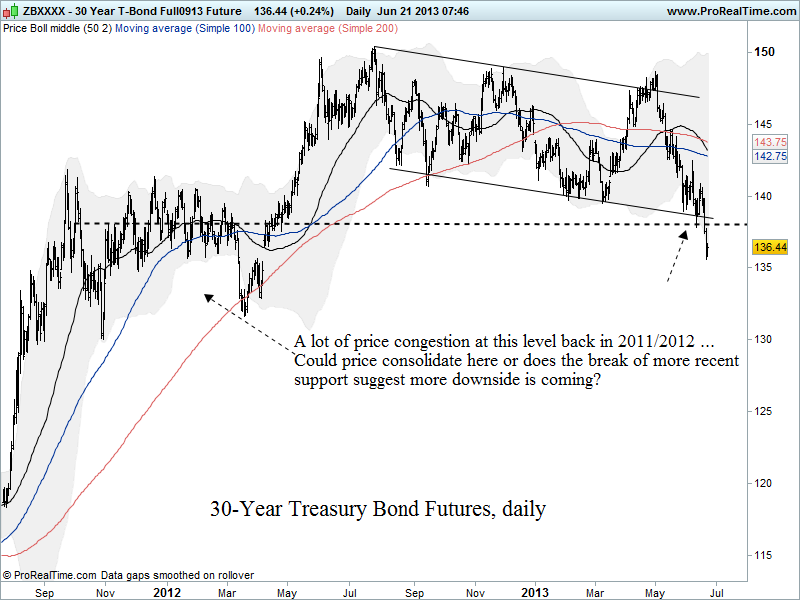
But are expectations for rising interest rates — courtesy of the collapse we’ve seen in Treasury prices lately — well founded?
As Elliott Wave touches on, Ben Bernanke gave no obvious indication of a concrete change in policy after this week’s FOMC meeting. There has been no change to bond or MBS purchases. And there certainly has been no indication of when an interest rate hike will happen (except for Fed Funds Futures indicating traders now expect the first rate hike will come in January 2014 instead of January 2015.)
So might this latest interest rate chaos wind down soon?
It’s possible.
I don’t claim to have blade-proof gloves, but if Treasuries at least stabilize around current levels (or even rally, a scenario Jack discussed recently) and the risk-off mood takes US stocks on a much-overdue and deeper-than-expected correction, and other assets continue to flounder, then maybe gold comes back into favor a bit.
That could mean the yellow metal lays a foundation that provides a rallying point once investors calm down. Because after this sell-off finishes, central bank policy will not have changed in any way that substantially undermines the low-interest rate status quo.
And it won’t, if global central banks have anything to say about it. The only real obstacle is if the market generates financial system risks of its own that policy accommodation can’t manipulate in the near-term.
-JR Crooks
![]()
LISTEN NOW!
Hear Jack answer questions and explain how BSFX has returned 56% on investment year-to-date!
Click here to listen and find out how forex trading can work for you.
And when you’re ready, click here and become a member of BSFX.


-
I know Mike is a very solid investor and respect his opinions very much. So if he says pay attention to this or that - I will.
~ Dale G.
-
I've started managing my own investments so view Michael's site as a one-stop shop from which to get information and perspectives.
~ Dave E.
-
Michael offers easy reading, honest, common sense information that anyone can use in a practical manner.
~ der_al.
-
A sane voice in a scrambled investment world.
~ Ed R.
Inside Edge Pro Contributors

Greg Weldon

Josef Schachter

Tyler Bollhorn

Ryan Irvine

Paul Beattie

Martin Straith

Patrick Ceresna

Mark Leibovit

James Thorne

Victor Adair