
Timing & trends
“I think this is very much a calm before the storm … the U.S. is out today and the focus is all on non-farm payrolls tomorrow, which I think is potentially the storm – if the data comes in line with expectation there may be more selling for gold” – Quote from the article below, published before the Unemployment number came out
Gold’s Price Moves from the European Perspective
by Przemyslaw Radomski – Sunshine Profits
Despite the lack of trading activity in the United States due to the Independence Day celebrations, yesterday’s session in Europe was very interesting. The players on the foreign exchange market have provided plenty of thrills. Without a doubt, the ECB President’s announcement was fuel for further dynamic declines in the euro. Draghi said the bank expected its key interest rates to remain at current or lower levels for an extended period. The ECB left its main interest rates unchanged as expected at record lows of 0.5 percent. Market reaction was swift and pronounced. The European currencydropped to a five-week low against the dollar.
Another important event was the statement by the Bank of England, which signaled that it won’t be raising interest rates anytime soon, lifting the FTSE 100 and putting big pressure on the British pound which fell 1.2%.
“I think this is very much a calm before the storm … the U.S. is out today and the focus is all on non-farm payrolls tomorrow, which I think is potentially the storm – if the data comes in line with expectation there may be more selling for gold,” Jonathan Butler, precious metals strategist at Mitsubishi, added.
According to Reuters, Friday’s U.S. non-farm payrolls report is expected to show the economy created 165,000 jobs last month. The data could affect when the Federal Reserve will begin tapering off its $85 billion monthly bond-buying stimulus program.
Gold posted its biggest quarterly loss on record in the April-June period, down 23 percent. Selling was exacerbated by comments from the Fed Chairman Ben Bernanke last month that the U.S. economy was recovering strongly enough for the central bank to begin pulling back on its stimulus in the next few months.
This would support a rise in interest rates, making gold less attractive.
Since we know the important news from Europe and the economic calendar, let’s summarize gold’s current situation. The yellow metal has increased since hitting its lowest price in almost three years at $1,180 last Friday, but many traders view those gains as a typical short-term rally that follows a significant decline. Is that true? Will we see a further decline? Let’s take a look at the charts and try to find the answers. At the beginning let’s take a look at the long-term gold chart and check the current situation in gold (click on chart for larger image)

In this week’s very long-term gold chart, we see that prices moved close to the lower border of the declining trend channel. This price level was not quite reached, but gold’s price is very close to it, and it seems that prices will decline once again. Gold has been trading sideways below an important resistance line, the first Fibonacci retracement level, verifying this breakdown. With a verified breakdown and the declining trend channel in place, we have a bearish outlook at this time.
Gold could initially decline to the lower border of the trend channel and if it does, a pullback will likely follow. However, since the support line is declining, the support is currently lower than last week – at about $1,150. The strongest support is seen slightly below the $1,100 level where two major support lines intersect.
Therefore, from this perspective, the situation remains bearish for the short term and it doesn’t look so optimistic. However, if we want to have a more complete picture of the situation, let’s take a look at the chart from the non-USD perspective.
Gold viewed from this perspective showed very little change this week as prices moved higher, then lower, and are within 2% or so of where they were a week ago. No significant support level has been reached, so declines could very well continue here.
As we previously mentioned, yesterday the British pound depreciated strongly against the U.S. dollar which means an increase of the strength of the U.S. dollar. Unfortunately, such a development could have negative consequences for gold. In light of this information, we think that another interesting chart may provide important clues about further price movements is the chart of gold from the perspective of the British pound.
Gold priced in British pounds reveals a recent double breakdown. This is a breakdown below two important support levels, in this case the rising long-term support line and the first Fibonacci retracement level on the full bull market.
This is an important breakdown and, at this time, the next significant support line is slightly below the 7 level in this chart. Clearly another significant decline could be seen here. This is similar to what we saw last week when gold moved lower, and we could see a similar move once again later on in the month.
Since we are already in Europe, we think that we can’t forget to take a look at the current situation of the European currency. Thus, to make the European perspective complete let’s see what has changed recently in the Euro Index chart.
In this week’s Euro Index chart, we see that the head-and-shoulders pattern remains in place. The Euro declined once again this week, and it seems to be completing the pattern. The chances for this formation to be invalidated are growing increasingly slim. If the European currency continues to decline and the formation is indeed completed, this may lead to further strength in the U.S. dollar and medium-term weakness in precious metals. From this point of view, this chart is still bearish.
Summing up, gold pulled back this week but the move to the upside did not invalidate the most important resistance levels. From the European point of view, the outlook and trend remain bearish for the short term. The immediate-term could see some strength, but with support lines relatively far away, the next big move will likely be to the downside.
Please note that these are very volatile times for gold investors and the situation may quickly change (become bullish) if we see strong moves up in the USD Index without a meaningful decline in gold and bearish indications from other markets.
Thank you for reading. Have a great and profitable week!
Przemyslaw Radomski, CFA
Founder, Editor-in-chief
Gold Investment & Silver Investment Website – SunshineProfits.com
* * * * *
Disclaimer
All essays, research and information found above represent analyses and opinions of Przemyslaw Radomski, CFA and Sunshine Profits’ associates only. As such, it may prove wrong and be a subject to change without notice. Opinions and analyses were based on data available to authors of respective essays at the time of writing. Although the information provided above is based on careful research and sources that are believed to be accurate, Przemyslaw Radomski, CFA and his associates do not guarantee the accuracy or thoroughness of the data or information reported. The opinions published above are neither an offer nor a recommendation to purchase or sell any securities. Mr. Radomski is not a Registered Securities Advisor. By reading Przemyslaw Radomski’s, CFA reports you fully agree that he will not be held responsible or liable for any decisions you make regarding any information provided in these reports. Investing, trading and speculation in any financial markets may involve high risk of loss. Przemyslaw Radomski, CFA, Sunshine Profits’ employees and affiliates as well as members of their families may have a short or long position in any securities, including those mentioned in any of the reports or essays, and may make additional purchases and/or sales of those securities without notice.

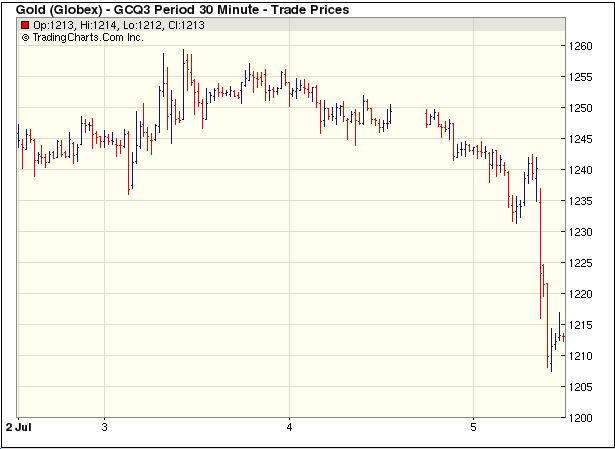
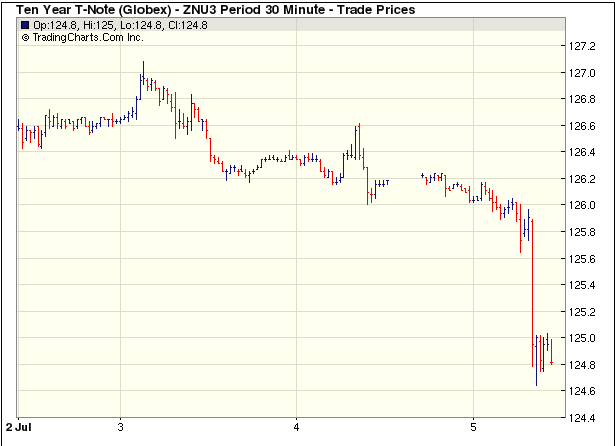
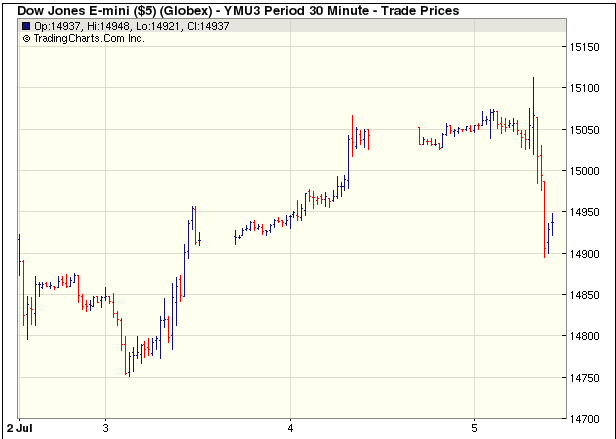
This morning’s employment report looked good enough on the surface to rekindle talk of an end to the Fed’s debt monetization program. U.S. employers added a robust 195,000 jobs in June and many more in April and May than previously thought. So traders began their day by dumping bonds. The 10-year Treasury yield is up by over 8% in early trading, to almost 2.7%. The chart below shows they are now dumping stocks too.

 The price oil sands producers receive on Wednesday narrowed to $16.50 a barrel below the international benchmark or $89.25, almost double Canadian crude’s value of just $45 in December.
The spread between Western Canada Select and US benchmark West Texas Intermediate (WTI) narrowed to $12.40 on Tuesday, close to the smallest discount this year.
WCS – a blend of heavy oil sands crude and conventional oil – has now recovered a massive 70% since hitting five-year lows of $42.50 below WTI in mid-December.
The surge in Canadian heavy oil came as the WTI discount to the global oil price in the form of North Sea Brent narrowed to the best levels in more than two years.
The discount for WTI has fallen to only $4.15, compared to the record margin of more than $26 in September 2011 and levels above $20 at the start of the year.
The effective price for bitumen derived oil was $64 below Brent in December, but has now narrowed to less than $20.
Brent settled at $105.80 in Europe on Wednesday as jitters over the military coup in Egypt lift the price above $100 a barrel for the first time in more than a year.
The value of Syncrude, a light oil made from oil sands after undergoing an expensive upgrading process, is trading at $6.25 premium to WTI compared to close to par in December.
The much better prospects for the sector has done little for the share prices of the major players however.
Number one producer Suncor Energy (TSE:SU) was little changed on the Toronto Stock Exchange on Wednesday and the $47 billion company has lost some 5% of its value this year.
Imperial Oil’s (TSE:IMO) performance is similarly lacklustre, while number three Canadian Natural Resources (TSE:CNQ) has at least managed some gains in 2013. Of the majors, Cenovus Energy (TSE:CVE) has fared worst, it is down nearly 10% in 2013.
CHART: Iron ore price resumes march on $120
The iron ore price jumped more than 2% on Tuesday closing in on the $120 a tonne level seen as a benchmark for the health of the industry.
…..read more & view chart HERE

Although physical real estate prices in Canada are wafting about on currents of blind enthusiasm, bond traders are pushing up rates and equity traders are selling housing related issues.
VANCOUVER average single family detached prices in June 2013 ticked up 0.3% M/M but remain 13.6% ($144,900) below their peak set last April 2012 (Vancouver Chart). Vancouver combined residential prices are down 3% Y/Y (Scorecard) on sales zooming up 12.1% Y/Y. Average strata units continue to trade at 2007 prices with a slight uptick in price M/M against dismal sales M/M.
If you are thinking of buying a Vancouver Condo as an Investment, see my Vancouver Condo Yield Case Study and now that you have the June data, where do you think Vancouver SFD prices will be one year hence? VOTE HERE.
CALGARY average detached house and condo prices in June 2013 broke out again to new record highs (Calgary Chart) while strata unit prices turned down at resistance. I have added the TSX Energy Index plot to the chart to see when correlations occur with housing prices but so far the correlation has been negative for the last 2 years (rising real estate prices against falling energy prices). Although there is pricing joy in Calgary, it’s not showing up on the Momentum Chart. What is showing up is a different world of earnings in Alberta compared to the rest of Canada.
The sentiment in Calgary is the least bearish of the 3 markets polled with only 23% of the survey thinking Calgary SFD prices will be 20% lower in 12 months. What do you think? VOTE HERE.
EDMONTON average detached house prices in June 2013 were turned away at resistance for the second time since March of this year (Canada Chart), while condo and townhouse prices zoomed 10.2% and 3.6% M/M. Where Calgary has positive combined residential sales up 5.2% Y/Y, Edmonton combined were down 5.3% Y/Y (Scorecard). Bidders have yet to break the May 2007 peak SFD price (Plunge-O-Meter) which remains 3.2% below the high.
TORONTO average detached house prices for the GTA in June 2013 could not repeat the trifecta breakout to new highs set last month (Toronto Chart) and combined residential prices slumped 2% M/M. For anyone keeping score, the gap between Vancouver and Toronto housing prices (Vancouver vs Toronto) widened with Vancouver’s price uptick. The marketing strategy in the GTA may have to appeal to the HNWI who have fallen in love with Toronto; perhaps as “safe” haven but certainly not as investment grade.
Never mind the wall of worry, polled sentiment here continues to suggest that prices will be down another 20% in 12 months. What do you think? VOTE HERE.
OTTAWA average detached house prices are not available, instead the chart on this site reflects Ottawa’s average combined residential prices. OREB’s report is sparse and opaque and the CMHC, records for Ottawa inventory remain one month lagging. In June 2013 Ottawa combined residential prices slumped 3% M/M after hitting a high 2 months ago (Scorecard). Sales plunged 11.6% M/M and are down 4% Y/Y.
MONTREAL median (not average) detached house prices in May 2013 (I WILL UPDATE WHEN I GET THE JUNE DATA WHICH IS ALWAYS A WEEK LATE) zoomed to a new record high replacing the last high set in June 2012 (Canada Chart). New pricing is happening on ever decreasing sales and thinning participants with combined residential sales down 9% Y/Y and condo sales down 12.4% Y/Y (Scorecard). In the 2011 Census, Montreal added 6.4% more dwelling units while only adding 5.2% more people. There is no shortage of housing, but there is a shortage of earnings; the Province of Quebec ranks 7th in Canada’s 10 provinces for earnings and prints an unemployment rate of 7.8% in April; 0.1% above Ontario’s.

 Good morning! Here’s what you need to know.
- U.S. futures are pointing to a higher trading day with Dow futures up 140 points. European markets are slightly lower. Asia rallied overnight led by a 2.0% surge in Japan’s Nikkei.
- It’s jobs day in America. At 8:30 a.m. ET, the Bureau of Labor Statistics will publish its June employment situation report. Economists estimate that the U.S. companies added 165,000 nonfarm payrolls in June, causing the unemployment rate to fall to 7.5%.
- The Bank of England had its first Monetary Policy Committee meeting with Canadian Mark Carney at the helm. In its statement, the BoE said it would look into giving forward guidance. The dovish tone of the statement caused the British pound to tank.
- The European Central Bank straight up gave forward guidance after its monetary policy meeting on Thursday. “Looking ahead, our monetary policy stance will remain accommodative for as long as necessary,” said ECB president Mario Draghi during his press conference. “The Governing Council expects the key ECB interest rates to remain at present or lower levels for an extended period of time.”
- “The risks surrounding the economic outlook for the euro area continue to be on the downside,” added Draghi. “The recent tightening of global money and financial market conditions and related uncertainties may have the potential to negatively affect economic conditions.” The euro tanked on that commentary.
- German factory orders unexpectedly fell 1.3% in May, missing economists’ expectation for a 1.2% gain. This is yet another reminder that Europe’s economy remains deeply troubled, and any economic activity is fragile.
- Investment dollars continue to leave the Emerging Markets. “Emerging Markets debt-dedicated funds recorded net outflows of $960MM (0.40% AUM) for the week ending on July 3, 2013,” said Morgan Stanley’s Robert Habib citing data from EPFR.
- Protestors continue to take to the streets in Egypt following the military-led removal of democratically elected president Mohamed Morsi. “We declare our unequivocal rejection of the military coup against the elected president and the will of the people and refuse to participate in any action with usurpers of power,” said the Muslim Brotherhood in a statement.
- A 4th of July celebration in southern California went awry when fireworks started going off sideways toward a crowd of viewers. 28 people were reportedly injured.
- American Joey Chestnut ate a record 69 hot dogs in 10 minutes to win the annual Nathan’s Hot Dog Eating Contest. This is Chestnut’s seventh time taking home the title
Read more: http://www.businessinsider.com/opening-bell-july-5-2013-2013-7#ixzz2YAuVvNpe

-
I know Mike is a very solid investor and respect his opinions very much. So if he says pay attention to this or that - I will.
~ Dale G.
-
I've started managing my own investments so view Michael's site as a one-stop shop from which to get information and perspectives.
~ Dave E.
-
Michael offers easy reading, honest, common sense information that anyone can use in a practical manner.
~ der_al.
-
A sane voice in a scrambled investment world.
~ Ed R.
Inside Edge Pro Contributors

Greg Weldon

Josef Schachter

Tyler Bollhorn

Ryan Irvine

Paul Beattie

Martin Straith

Patrick Ceresna

Mark Leibovit

James Thorne

Victor Adair