
Personal Finance
 Market Buzz – Back in the early 1960s, then University of Chicago PHD candidate, Eugene Fama published a thesis which was later developed into a theory called the Efficient Market Hypothesis (EMH). This theory gained widespread acceptance in the finance industry (at least among academics) for several decades afterwards and is still commonly referenced to this day. Essentially what Professor Fama was postulating is that stock markets, or most markets for that matter, were efficiently priced at any point in time and that it was inherently impossible to outperform the market on a risk adjusted basis outside of the aid of pure luck, thus making individual stock selection a futile pursuit.
Around the 1990s, Fama’s theory started to lose its appeal among the mainstream finance community. Empirical evidence and research did not support the EMH’s conclusion that capital markets were perfectly efficient and select investment strategies, such as buying stocks with low price-to-earnings and cash flow multiples, did demonstrate an ability to outperform the market on a risk-adjusted basis over time. Providing an explanation of the short-comings of the Efficient Market Hypothesis was a relatively new field known as Behavioral Finance. This new field sought to study the emotional traits of investors and the impact they had on investment decisions and market activity. EMH was largely based on the assumption that humans were perfectly rationale beings and that decisions were made instantaneously with full knowledge of all potential outcomes in an unbiased and emotionless process. However, studies in both psychology and finance have demonstrated that this perfectly rationale investor was largely a myth. Human beings in fact rely on emotion to a large extent when making important decisions and are subject to a wide variety of potential biases. An objective of Behavioral Finance is to integrate these real world human biases into modern day financial theory to create a more realistic explanation of how the markets work.
Behavioral finance and psychology have defined numerous biases that can lead to poor investment decisions. We have provided a few examples below.
Bias: Bandwagon Effect
Definition: This occurs when a certain idea, investment type, or investment style starts to become more popular. As popularity increases, more and more people adopt the groupthink mentality and adopt the mentality themselves which further accelerates popularity, and in the case of investing, asset overvaluation.
Example: Alex has been looking at the market for potential investment opportunities. He has noticed that many small-cap tech companies have been doing well. A few of his friends have started to invest heavily in the sector, with good results, but Alex is worried about the high risk nature of the securities. As time passes, more of Alex’s friends have gravitated towards the sector and he is starting to see more portfolio managers and experts talk about it on the financial news. More time passes and the popularity increases. Finally, Alex has grown tired of missing out on the returns and decides to make some significant purchase of these stocks. Unfortunately, the growing popularity of the asset class has pushed valuation far beyond reasonable levels and the sector is now in serious risk of a crash.
Bias: Recallability Trap
Definition: This occurs when an individual’s opinions and decisions are overly influenced by large scale (and often dramatic) events that have taken place in the past.
Example: John receives a call from his financial advisor informing him that he has compiled a report of several successful technology companies that offer strong investment value. All of the companies in the report are profitable, growing, maintain healthy financial positions, and are trading at attractive value. John tells his advisor that he has no interest in receiving the report as he was heavily invested in tech stocks shortly before the market crashed 2001. His opinion is that the sector is far too volatile and he has decided to stay out of it completely. Although John’s decision is understandable, he is now limiting the flexibility of his portfolio based on an irrational bias. The tech market crashed in 2001 because it was substantially overvalued – but that does not mean that current opportunities do not exist in that space.
Bias: Confirmation Bias
Definition: When people have an existing belief, such as an opinion on an individual stock or the movement of the economy, we tend to overweight evidence that supports our original view and underweight, or even disregard, evidence that that conflicts with this view.
Example: Jane recently made a purchase of Company B which is advancing a new technology. She spent a great deal of time reading the company reports and speaking to management. About a week after the initial purchase, she hears an analyst on the news reiterate what the company said about the technology. Pleased to see more people taking notice of the company, Jane increases her position that day. About a week later, she hears another analyst with a respected background in science discuss the technology and conclude that it is not as commercially viable and the company suggests. Although somewhat concerned with the statements, Jane takes no action.
Bias: Anchoring and Adjustment
Definition: Very similar to confirmation bias, anchoring and adjustment is a tendency to not fully reflect and adjust for new information when reviewing an existing opinion or forecast. This is a very common bias in the professional analyst community but can also been seen regularly with retail investors.
Example: Jim owns shares in Company C and believes that the stock price will appreciate from $5.00 to $9.00 in 12 months as a result of increased sales from a new product offered by the company. Company C releases a statement later on indicating that sales of the new product are falling significantly short of initial expectations. Disappointed, Jim decides that the stock is probably only worth $7.00 over the next 12 months and cuts his price expectation by $2.00. Considering the lack of visibility going forward, a large reduction is the price expectation is justified but Jim is still being influenced (he is anchored) to this original target.
Bias: Overconfidence
Definition: This is when investors tend to place too much confidence in their ability to pick stocks or make investment decisions. It is typically the result of a past success, or successes, which may or may not have been the result of luck. Overconfidence can be dangerous because it can cause investors to underestimate risk, under-diversify their portfolio, and even disregard relevant information.
Example: Garth has been a buyer and seller of speculative junior mining stocks for the last several years with mixed success. But recently he bought shares in Company E which made a notable discovery and appreciated in price substantially. Garth also noticed that many of his other junior mining stocks had been doing well over the past year but that his diversified portfolio had underperformed. Garth concluded that his experience in identifying opportunities in the sector had started to pay off. He was also ignoring the fact that many of his stocks were doing well as a result of a generally strong market over that period. The problem was that Garth didn’t buy enough of Company E to really boost his portfolio value. Confident in his abilities, Garth decides that he is going to search hard for another stock like Company E, only this time he plans to concentrate a large portion of this portfolio in the stock so that he can make a huge return.
Bias: Mental Accounting
Definition: This refers to the way that the people have a tendency to mentally compartmentalize their finances and separate capital to psychological accounts.
Example: Taylor is reviewing his finances and deciding how much money he can contribute to his investment account, which is currently worth $20,000 and has been generating a 6% annual return. Taylor also noticed that his credit card balance was a hefty $10,000 on which he is paying 18% interest. Taylor understands the importance of paying down debt as well as saving for retirement so he splits his $5,000 annual contribution 50/50% to debt repayment and investment. While this may seem appropriate, it is actually highly irrational. For this to be a rational decision, Taylor would need to generate a minimum return of 18% in his investment account which is highly unrealistic. Taylor’s investment portfolio would be better long term if he were to use both his annual contribution and his investment portfolio to completely pay down the high interest debt.
Now that we are aware of a few of the common investor biases we can start to evaluate whether or not our own decisions are impacted by irrational tendencies and counterproductive habits. The first step is simply awareness. While it may be asking too much of ourselves to be perfectly rational at all times, simply being aware of the common biases and reviewing our behaviour in that context can be highly beneficial with respect to making better investment decisions in the future.

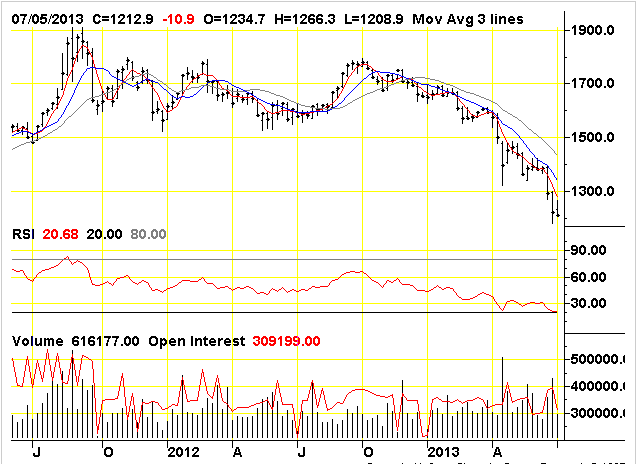
….Presses Gold To 3 Yr Weekly Low Close. Silver futures for September delivery tumbled 4.9 percent to $18.736 an ounce on the Comex, the biggest decline since June 20. The metal has dropped 38 percent this year, the most among the 24 raw materials in the Standard & Poor’s GSCI Spot Index.
The greenback climbed as much as 1.6 percent against a basket of major currencies, eroding the appeal of gold as an alternative investment.
Non-farm payrolls growth came in at 195,000 against consensus forecasts of 165,000.
The US jobless rate stayed at 7.6% however, rather than slipping as forecast. But average hourly earnings rose 2.2% annually against the 2.0% analysts predicted.
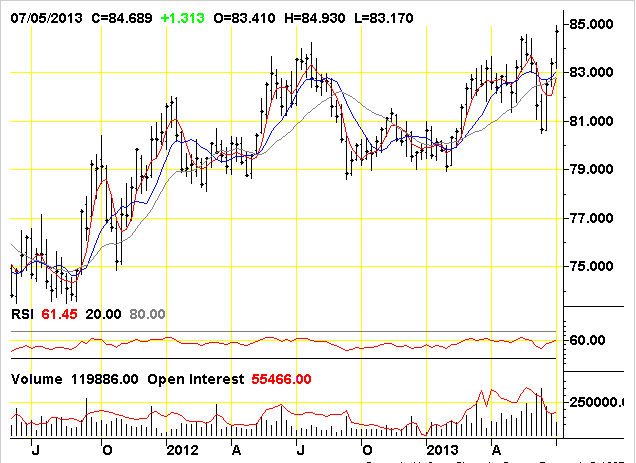
Dollar Chart:
Weekly Gold Chart:
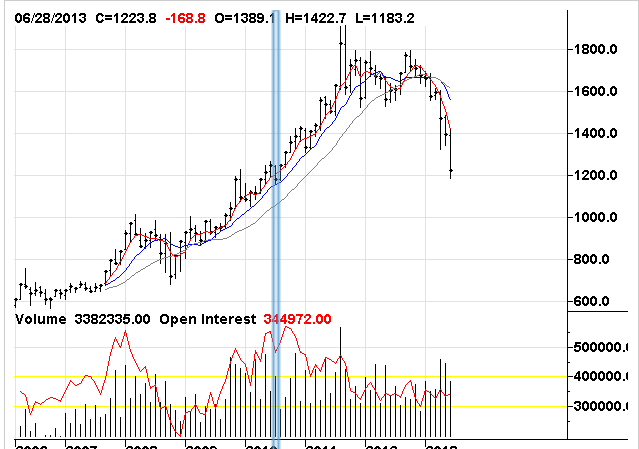
Monthy Gold Chart:
The DOLLAR PRICE of gold dropped $20 per ounce lunchtime Friday in London, briefly dropping through $1220 per ounce after the release of June’s US non-farm payrolls data.
“With the US economy improving, US interest rates rising and the Dollar no longer perceived to be at risk,” says the latest Commodities Weekly from French investment and bullion bank Natixis, “the need for a safe haven against currency debasement and inflation dissipated.”
“Should the Dollar continue to strengthen, so gold prices will remain under pressure,” says the note, as Western investors continue to sell exchange-traded gold funds.
ETF gold sales since February now total 572 tonnes, says Natixis – “equivalent to increasing annual gold [mining] production by almost 13%.”
Chinese gold buyers, in contrast, imported the second-largest volume of bullion on record in May, new data showed Friday.
Net imports of gold bullion to China through Hong Kong totaled almost 109 tonnes, the Hong Kong Census Bureau said, greater by more than one third from April.
Over the 1st five months of the year, China’s net gold imports stood at twice the level of 2012.
Across in India meantime – likely to be overtaken by China this year as the world’s No.1 gold consumer – “It is difficult to sell even 5 kilograms per day as the marriage season is almost over,” said Chennai wholesalers MNC Bullion to Reuters on Friday.
Fighting both the typical gold summer lull of Chaturmas and new government curbs on imports of gold bullion, India’s major retail chains “are aggressively promoting diamond jewellery” says the newswire, as well as expanding overseas in Singapore and Dubai.
“Gold has been the traditional form of savings among Indian households for many years,” says B.Venkatesh, founder of financial advisors Navera Consulting, writing in The Hindu.
“Buying gold gives you a feeling of comfort…Gold is accepted at all times, [giving] you feeling that it is a ‘safe’ asset.”
European stock markets meantime failed to follow Asian shares higher on Friday, while weaker Eurozone bonds recovered more of the week’s drop.
Silver prices fell faster than gold, losing some 3.0% for the week after the non-farm payrolls data.
Both gold and silver neared the end of London trade Friday with lowest weekly finish against the Dollar since August 2010.
The US Dollar also rose Friday against the Euro and Sterling after the non-farms jobs data, touching 6 and 17-week highs respectively.
The European Central Bank and Bank of England had confirmed their record-low interest rates for the foreseeable future on Thursday.
By Friday afternoon in London, both Euro and Sterling gold prices had cut their earlier gains, but were heading for their first weekly gain in six.
“The stronger Dollar is adding to the downward drag in metal prices,” says Standard Bank’s daily note.
“Even if the NFP data [had come] out below expectations, we would look for rallies in gold and other precious metals to fade.”
By Adrian Ash
BullionVault.com
Dennis Gartman is the man behind The Gartman Letter, a daily newsletter discussing global capital markets. For more than 20 years, The Gartman Letter has tackled the political, economic and social trends shaping the world’s markets, and Gartman himself is a frequent guest on CNBC, Bloomberg and other financial media outlets. HardAssetsInvestor Managing Editor Sumit Roy recently caught up with Gartman to discuss the latest outlook on financial markets and commodities, including gold and oil.
Dennis Gartman: Technicals Say Gold Could Hit $900
HardAssetsInvestor: What do you think about the recent concerns in the U.S. regarding the Fed potentially winding down QE later this year, and the consequent spike in long-term interest rates?
Dennis Gartman: The economy absolutely can continue to grow with somewhat tighter monetary conditions. In fact, I think the economy can grow a lot better without the Fed’s help. The Fed’s help back in 2008 was to be lauded; it was fantastic. They did exactly the right thing. In 2009 and ’10, the first rounds of QE were probably still to be lauded. They probably did the right thing; however, they overstayed their welcome. They’ve created a bit of confusion. And confusion breeds contempt, as I like to say.
The Fed understands it has to get itself out of the box that it has put itself in. The way to do that is slowly, over time. I find it amusing that people are already responding as if the Fed has already begun to tighten. We have to remember, the Fed is going to continuously add reserves to the system until middle of 2014. It will just be that they are adding at a lesser pace. It’s not as if they have taken anything out of the system. I think the markets have overreacted.
…..read the whole interview HERE

As a general rule, the most successful man in life is the man who has the best information
Illusions trick us into perceiving something different than what actually exists and the mainstream media is very good at creating them. Currently they have the herd convinced there is an economic recovery underway.
We all need to understand that to have a real, and sustainable recovery for an economy that relies on consumer spending for 70 percent of its activity we need to have a jobs recovery.
Okun’s Law holds that an economy, it’s GDP, must grow above its potential to reduce the unemployment rate. Year-on-year economic growth of two percent above the trend (considered to be 2–3 percent) is needed to lower unemployment by one point.

A third downgrade of U.S. economic growth for the first quarter 2013 showed the country’s GDP grew at just a 1.8 percent annualized pace.
Bloomberg and IHS Global Insight estimate the U.S. economy will grow by 1.6 percent this year.
Industrial production was unchanged in May, the second straight weak monthly report. Capacity utilization – a measure of how fully the nation’s mines, factories and utilities are deploying their resources – fell to 77.6 percent, well below the average of 80.2 percent experienced from 1972-2012.
The Commerce Department revised growth in private investment to 7.4 percent in the first quarter, down from its original estimate of 12.3 percent.
Imports were originally reported as growing by 5.4 percent but the revised number is now 0.4 percent.
Sequestration – what remains of the ‘fiscal cliff’ after the U.S. Congress passed the American Taxpayer Relief Act – could trim economic growth in 2013 by 0.6 percentage points by cutting $85 billion worth of Federal government spending this year. Over its ten year life sequestration will cut $600 billion of government spending from the economy.
“The drop in growth rate is not temporary, but over the span of at least 10 years in which the sequestration will take effect. And its impact will be more strongly felt in later years, once the fiscal sequestration translates through its negative multiplier effects.” Benjarong Suwankiri, ‘After Fiscal Cliff, Sequestration’ nationmultimedia.com
Hourly pay for U.S. nonfarm workers fell a record 3.8 percent annualized in the first quarter, the largest decline since records started being kept in 1947. This record first quarter decline was on top of the 2012 third weakest annual increase in hourly pay since 1947. Hourly worker pay rose only 1.9 percent in 2012, barely keeping up with the 1.8 percent gain in the fudged downward and much maligned consumer price index.
The growth rate of consumer spending was revised downward to 2.6 percent annualized in the first quarter from an earlier estimate of 3.4 percent.
The labor force participation rate is the percentage of working-age persons in an economy who:
- Are employed
- Are unemployed but looking for a job
“Working-age persons” is defined as most people between the ages of 16-64. Excluded are students, homemakers, and people under the age of 64 who are retired.
According to the Bureau of Labor Statistics the labor force participation rate dropped 0.2 percentage points to 63.3 percent. This is the lowest rate in 34 years.
Considering population growth in the U.S. is positive and is one of the highest rates in developed countries, you’d think labor force participation would be growing, not dropping. The U.S. economy needs to add 150,000 to 250,000 jobs per month just to absorb the workforce’s new entrants never mind make up for what’s been lost since the Great Recession.
“February’s headline unemployment rate was portrayed as 7.7%, down from 7.9% in January. The dip was accompanied by huzzahs in the news media claiming the improvement to be “outstanding” and “amazing.” But if you account for the people who are excluded from that number—such as “discouraged workers” no longer looking for a job, involuntary part-time workers and others who are “marginally attached” to the labor force—then the real unemployment rate is somewhere between 14% and 15%.” Mortimer Zuckerman, ‘The Great Recession Has Been Followed by the Grand Illusion,’ wsj.com
U.S. labor force participation is now down to where it was in 1979. The unprecedented 2.5 percentage point decline in labor force participation under President Obama amounts to 6.2 million Americans being pushed out of the job market – 6,200,000 have stopped looking for work, these people have been forced to give up.
Many of the jobs that are being created are part-time low wage second or third jobs going to those already working. The average work week is now a very short 34.5 hours because employers are shortening workers’ hours or asking employees to take unpaid leave.
“The financial crisis destroyed some $16 trillion in household wealth. Americans have only recovered 45 percent of that amount…But when you break down that wealth recovery by income level, it gets worse. The Fed estimates that 62 percent of that wealth people have regained since the depths of the recession has come in the form of higher stock prices. And 80 percent of stock wealth is held by people in the top 10 percent of the income distribution.” Erika Eichelberger, ‘Sorry, There’s Been No Economic Recovery for Poor and Minority Households’
Here’s a few facts:
- Medium household income has declined. Adjusted for inflation household incomes are now back to levels last seen in the 1990s – average per capita wage is around $26,000, household median income is at $50,000
- Few Americans own any significant amount of financial wealth. The bottom 80 percent of Americans hold roughly 5 to 8 percent of all financial wealth (non-housing related)
- U.S. Employment rate is not recovering, one in 12 Americans are jobless
- The number of Americans living in poverty has now reached a level not seen since the 1960s. There are 50 million poor people in America. There are more than 146 million Americans considered either poor or low income
- There are over 47 million Americans on food stamps
- The banking system backs $7.4 trillion in insured deposits with $32 billion, that’s just .43 percent
- 1 out of 3 Americans have no savings
- Nearly half of American’s die broke
- There are less Americans working manufacturing jobs today than in 1950 even though the country’s population has doubled
- The U.S. has run a trade deficit with the rest of the world of more than 8 trillion dollars since 1975
- The U.S. Social Security system is facing a 134 trillion dollar shortfall over the next 75 years
“The employment trend in manufacturing is overwhelmingly negative and has been for nearly twenty years. This country does not simply lack manufacturing jobs, it lacks entire industries.
The Manufacturers Alliance for Productivity and Innovation (MAPI) released a report in January 2013 detailing the generational decline in manufacturing output and capacity in the United States. In general, for every two new plants that come on line, three others are shut down. For every two jobs created at one plant, three are lost somewhere else.
The companies that make up our so-called “manufacturing base” often survive, but they do so by moving jobs and production overseas. The MAPI report shows dramatic increases in overseas production and sales by the foreign affiliates of American multinationals alongside virtual stagnation of domestic metrics in the United States.” Craig Harrington, The Continued Decline of American Manufacturing, economyincrisis.org
Global
According to the Organization for Economic Co-operation and Development (OECD), the combined government debt held by the world’s advanced economies is at its highest point since the Second World War. In 1945, the debt topped out at 116 percent of GDP; at the end of 2012 it hit 114.4 percent. The OECD says we’ll hit a new high in 2013.
Global trade has slowed. According to the World Trade Organization (WTO) international trade rose 5.2 percent in 2011, two percent in 2012 and growth has been revised downward to 3.3 percent in 2013 instead of the 4.5 percent the WTO predicted last September.
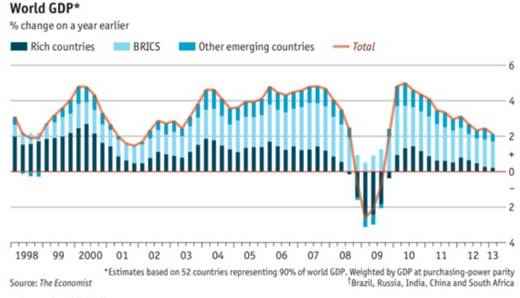
According to The Economist world GDP grew by just 2.1 percent during the first quarter of 2013. The UN Department of Economic and Social Affairs (DESA) says growth of world gross product (WGP) is now projected at 2.3 per cent in 2013, the same pace as in 2012.
In a report titled ‘Update to Global Macro Outlook 2013-14: Loss of Momentum,’ Moody’s, an international credit rating agency, expected the euro area economy to experience a deeper and lengthier recession than previously thought. Moody’s also expects the real GDP growth of developed economies in the G20 countries to stand at around 1.2 percent in 2013 followed by 1.9 percent in 2014.
Unemployment in the euro area has reached an all-time high and is forecast to average 12.8 per cent in 2014.
“A prolonged period of subdued growth and fiscal austerity in many economies has added about 4 million more to the ranks of the unemployed.” Assistant Secretary-General for Economic Development Shamshad Akhtar
Chinese May exports rose by just one percent year on year – the lowest rate since last July – while imports fell by 0.3 percent. Exports to Japan were down by 5.7 percent, exports to the US decreased by 1.6 percent and by 9.7 percent to the European Union. Exports to both the U.S and EU have been falling for three months in a row.
Two gauges of China’s manufacturing fell in June – an official Purchasing Managers’ Index dropped to 50.1 from 50.8 – 50.1 is the lowest level in four months. The PMI report showed declines in sub-categories including output, new orders, input prices and employment – the export orders sub-index was reported at 47.7, the lowest reading since February.
A private PMI from HSBC Holdings Plc and Markit Economics was 48.2, the weakest since September – readings above 50 signal expansion.
The June HSBC/Markit PMI for the services industry (the services sector accounted for 46 percent of China’s economy in 2012) inched up to 51.3 in June from May’s 51.2. Growth in new orders hit a 55 month low and business confidence slumped to 2005 levels.
“China’s President Xi Jinping said over the weekend that officials should no longer be evaluated against economic growth but with consideration to other indicators including welfare and ecological improvements and social development.” Reuters, ‘China June HSBC services PMI expands modestly’
Growth in India has slowed significantly over the last two years while Markit factory gauges for South Korea slipped to the lowest level since November 2012.
Japan, the world’s third largest economy, would seem to be an economic ray of sunshine as its economy grew at an annualized 4.1 percent in the first quarter. A closer look under the hood reveals it was done by flooding the system with money. The flood of fiat has depreciated the yen by 25 percent against the U.S. dollar since the start of the year. A weaker yen has helped boost exports and drive local stock exchanges higher, to five year highs.
“In Japan, a dynamic relaxation of macroeconomic policy has sparked an uptick in activity, at least over the short-term.” The Japan Times News, ‘Japan growth estimate gets World Bank boost’
Abenomics is failing because:
- Consumers in Japan remain convinced the threat is deflation, not inflation, they are not spending
- Japan’s debt is 240 percent of GDP limiting government spending
- The Prime Ministers own party is against structural reforms
- Japanese corporations are not buying into ‘Abenomics’ – corporate investment fell by 4.9 percent in the first quarter
- Abenomics is nothing more than a policy of beggaring your neighbor.
Conclusion
The world’s four largest economies – the U.S., China, Japan and the EU – face extremely strong headwinds on their way to recovery; the lack of jobs and consumer spending, a liquidity crisis and an insolvency crisis. The much ballyhooed recovery is simply an illusion bought and paid for by the world’s central banks with loose monetary policy – money printing has driven the rise in stock markets and house prices.
“The global financial crisis that began in the United States in the summer of 2007 was triggered by a bank run, just like those of 1837, 1857, 1873, 1893, 1907 and 1933.” Yale economist Gary Gorton’s Misunderstanding Financial Crises, Why We Don’t See Them Coming
Gorton writes the 2007-2008 crisis was systemic, spreading from one institution to another, and set off by a run on “repos and asset backed commercial paper” which are“forms of bank debt that grew to significant amounts and were vulnerable to being run on.”
Panic set in, selling becomes widespread – everyone was trying to squeeze out a narrow exit at the same time – from shorter term instruments like repos and commercial paper to longer term obligations like bonds, stocks, commodities and real estate.
Firms thought too big to fail, like Merrill Lynch, Lehman Brothers, Bear Stearns, Wachovia, Washington Mutual and Countrywide Financial disappeared.
In this author’s opinion it’s going to happen again.
It certainly couldn’t be a bad thing to have a little gold and silver tucked away for a rainy day. The recent drop in bullion prices makes for perfect timing.
Is establishing an easily accessible rainy day fund consisting of cash, gold and silver on your radar?
If not, maybe it should be.
Richard (Rick) Mills
Richard is the owner of Aheadoftheherd.com and invests in the junior resource/bio-tech sectors. His articles have been published on over 400 websites, including:
WallStreetJournal, USAToday, NationalPost, Lewrockwell, MontrealGazette, VancouverSun, CBSnews, HuffingtonPost, Londonthenews, Wealthwire, CalgaryHerald, Forbes, Dallasnews, SGTreport, Vantagewire, Indiatimes, ninemsn, ibtimes, businessweek.com, moneytalks and the Association of Mining Analysts.
If you’re interested in learning more about the junior resource and bio-med sectors, and quality individual company’s within these sectors, please come and visit us atwww.aheadoftheherd.com
If you are interested in advertising on Richard’s site please contact him for more information, rick@aheadoftheherd.com
***
Legal Notice / Disclaimer
This document is not and should not be construed as an offer to sell or the solicitation of an offer to purchase or subscribe for any investment.
Richard Mills has based this document on information obtained from sources he believes to be reliable but which has not been independently verified.
Richard Mills makes no guarantee, representation or warranty and accepts no responsibility or liability as to its accuracy or completeness. Expressions of opinion are those of Richard Mills only and are subject to change without notice. Richard Mills assumes no warranty, liability or guarantee for the current relevance, correctness or completeness of any information provided within this Report and will not be held liable for the consequence of reliance upon any opinion or statement contained herein or any omission.
Furthermore, I, Richard Mills, assume no liability for any direct or indirect loss or damage or, in particular, for lost profit, which you may incur as a result of the use and existence of the information provided within this Report.
With photography gone, and PV not plugging the gap, where is silver seeing the strongest demand…?
FOR ALL ITS monetary and investment history, silver is by far an industrial metal today.
The industrial sector consumed close to 466 million ounces of silver in 2012 according to the Silver Institute. Add what’s left of photographic demand, and you get to 524 moz, some 62% of total fabrication.
We already discussed what happened to photographic demand in Part 1 and we looked at photovoltaic silver consumption in Part 2 of this series. There we saw how PV demand remains a long way from filling the gap left by the collapse of photography.
So who does buy silver in bulk? Well, silver is also used in electronics and catalysts. And a fast-growing industry that consumes silver is the production of ethylene oxide.
Ethylene oxide (EO) is used in the production of antifreeze, polyester, heat transfer liquids, gas dehydration, and solvents. It is also used in cosmetics, pharmaceuticals, lubricants, paint solvents, soaps, detergents, gas purification, emulsifiers and dispersants. Because of the wonderful properties of this reactive chemical, its growth has benefited the silver market as well. Because the precious metal is used as a catalyst in EO production.
Some 90% of silver’s total catalyst demand comes from EO production. The EO market has enjoyed a 30-year continued growth cycle, according to consultancy Metals Focus Ltd. In 2002 it consumed 100 million ounces of silver, and it is projected by 2017 to reach 225 million ounces per annum. This rivals the historical high of the photographic industry. However, the EO market will not continue to grow at this pace. Because consumers are able to recover the silver from the catalyst. This means that at some point its demand will stabilize and perhaps decrease.
By geographical area, the United States is the largest consumer of silver. It is also the largest consumer of silver jewelry. Over the last couple of years demand to buy silver as jewelry has remained strong, as gold remained at high prices, leading consumers to substitute. But now, with the recent decline in the gold price, there’s good reason to think silver will have a bigger struggle to keep its share of the market.

What of that other major consumer of silver – investment? This is not a primary user. We are talking about the investor, who can substitute at will. As of this writing, the SLV (which is the call sign for the largest exchange-traded silver trust fund or ETF) is holding 320 million ounces of silver. This number represents 31% of annual world silver supply using 2012’s statistics.
That’s a significant overhang if it comes back to the market. But overall silver investment has grown significantly in both the ETF market and coins and medals. Since 2002 sales of coins and medals grew close to 250% worldwide. Yes, that only represents only half of the type of consumption we see for jewelry. But adding the ETF and other physical investment products together, it becomes larger than the jewelry by 28%.
What are the concerns then for an investor? What happens if the silver comes back into the market that is in the hands of investors? What happens if the price goes down? Finally what happens if the price goes up?
The funny thing with silver is that when the price goes down demand from the industrial sector and jewelry sector will rise and it will be consumed. It may take some time but it will happen. At the same time if the price is low then there will be less mining because of profitability. Eventually the fundamentals will drive the price higher.
If the price makes new highs we usually see large liquidations of metal either from scrap recovery or investors. This will force market prices to correct to a level that will sustain the available material. Of course if silver were to be demanded as forms of currency, then all bets are off. The price of silver would then reach unknown heights.
Fundamentally silver remains an indispensable metal. It is one that mankind cannot do without. There will always be uses and demand for silver. Its beauty and its relevance as a store of value – added along with its physical and chemical properties – make it an important part of anyone’s portfolio. Just like gold, it remains a good thing to own.
Miguel Perez-Santalla
Miguel Perez-Santalla is vice president of business development for BullionVault, the physical gold and silver exchange founded a decade ago and now the world’s #1 provider of physical bullion ownership online. A fierce advocate for retail investors, and a regular speaker at industry and media events, Miguel has over 30 years’ experience in the precious metals business, previously working at the United States’ top coin dealerships, as well as international refining group Heraeus.
(c) BullionVault 2013
Please Note: This article is to inform your thinking, not lead it. Only you can decide the best place for your money, and any decision you make will put your money at risk. Information or data included here may have already been overtaken by events – and must be verified elsewhere – should you choose to act on it.


-
I know Mike is a very solid investor and respect his opinions very much. So if he says pay attention to this or that - I will.
~ Dale G.
-
I've started managing my own investments so view Michael's site as a one-stop shop from which to get information and perspectives.
~ Dave E.
-
Michael offers easy reading, honest, common sense information that anyone can use in a practical manner.
~ der_al.
-
A sane voice in a scrambled investment world.
~ Ed R.
Inside Edge Pro Contributors

Greg Weldon

Josef Schachter

Tyler Bollhorn

Ryan Irvine

Paul Beattie

Martin Straith

Patrick Ceresna

Mark Leibovit

James Thorne

Victor Adair