
Currency
 With gold and silver plunging, the US dollar strengthening, and oil still above $100 a barrel, today Marc Faber told King World News this will “end in disaster.” This is part I of a series of written interviews that will be released today on KWN in which Faber discusses the end game, government theft, how investors can protect themselves, gold, silver, bail-ins, central planner actions, global markets, and much more.
Eric King: “Marc, you were talking there about the endless printing of money. Obviously it’s going to end in disaster, but when is that going to end?
Faber: “I agree with you, it’s going to end in disaster. But it’s not going to end at the hand of central bankers because I know very well how they think….

The market continues to live in a state of euphoria and confusion.
The U.S. government just told us the U.S. economy added a stronger-than-expected 195,000 jobs last month.
Once again, the market rises with promising job numbers. But because that signals QE tapering, the market was sent lower.
Finally, after the sell-off, the market ended up Friday with a 1% gain. For now, it seems the job numbers were good enough to shake off worries about the Federal Reserve scaling back its economic stimulus.
So while everyone is cheering about the amount of jobs created, no one has taken a look at the quality of jobs that are actually being created.
According to the Bureau of Labour and Statistics’ (BLS) household survey, part-time jobs in June soared by 360,000 to 28,059,000 (seasonally adjusted) from 27,699,000 – an all time record high. Full time jobs? Down 240,000, from 116,238,000 to 115,998,000.
Since the beginning of the year, the U.S. has added 557k part-time jobs, but only 130,000 full-time jobs. Perhaps that’s because of the jobs created, 239,000 went to minimum wage restaurant and bar jobs. As for manufacturing jobs: 13,000.
On the Canadian front, Canada’s unemployment rate didn’t budge last month, remaining at 7.1 per cent, according to Statistics Canada.
That doesn’t seem important, but it shows that Canada’s mild job growth will likely be just that: mild.
But mild may be putting it lightly.
As I mentioned in my Letters “How China’s Problems Affect Canadians,” and “The Impact of the TSX Venture on the Economy,” jobs in Canada may soon be at risk.
In those letters, I talked about the many jobs that will be lost as a result of the TSX Venture crisis and the decline of the mining sector.
But the housing market itself will also play a big role in the decline of Canadian jobs. The construction of new homes and condos is already fading and that means a lot of construction jobs may soon be lost.
Will Dunning, the economist for mortgage industry group CAAMP, estimates that Canada will lose about 180,000 construction jobs as a result of the slowdown in home building. Housing analyst Ben Rabidoux predicts 250,000 job losses as a result of the housing slowdown.
Therein lies one of the biggest concerns facing the Canadian market: housing.
The Canadian Housing Market
 Over the last year, I have argued that Canadian housing prices are far too high and have only one way to go: down.
In the past year, real estate has apparently gone up, with the average price of a Canadian home at $388,910 in May, up from $375,062 a year earlier.
In Toronto, average price hit a record $542,174 in May, up 5.4 per cent from May of 2012.
Was I wrong? Are prices still climbing?
Instead of looking directly at the numbers spewed out by the Canadian Real Estate Association (CREA), I look at what matters: what I see around me.
Everywhere I go, I see unsold homes and falling prices. There are more vacant condos in Toronto and Vancouver than I have ever seen in my life. Real estate developers are slashing costs and giving buyers extremely strong incentives to come back – only no one seems to be coming back.
I don’t know of any new condo development that isn’t struggling to sell their units right now. Every condo developer I know is offering insane discounts to market. They’re not only offering monetary discounts, many of them are even offering to build custom walls and shelving units at no charge just to attract buyers.
If the market was so strong, none of this would be happening.
In Vancouver, while prices appear to be climbing, the Real Estate Board of Greater Vancouver has announced that May home sales were 19.4 percent below the 10-year average for that month, while new listings were 7.4 percent lower than the 10-year average.
If real estate is so strong, according to the CREA, why are home prices around me dropping? Why are home sales slumping?
Are real estate prices dropping or rising in your area? Are they slumping or growing?
The Canadian housing market is in a lot worse shape than it appears.
While we’ll unlikely see a major collapse like the U.S., I do expect the markets to fall at least 20% from these levels over the next couple of years. In stock market terms, that’s a bear market.
I find it absurd that I am reading articles from Canadian journalists touting that the Canadian housing market won’t fall. They claim the market is actually rising and sales are increasing. This overconfidence is misleading homebuyers into taking more risks, in an environment where risk has no reward.
But I guess I can’t just blame the media – especially when they’re being told by the Conference Board of Canada that housing prices are supposed to edge up – not down.
They’re telling us that Vancouver – despite having the highest real estate prices in the country, and despite being the target of continued warnings from economists who see a bubble poised to pop – will apparently be one of the most resilient markets of all.
According to Mario Lefebvre, the director of the board’s Centre for Municipal Studies, real estate should continue to rise, especially in Vancouver, despite affordability issues. He says that the growth of foreign-born population continues to bring new buyers into the market.
But in other reports – more unbiased reports – the numbers show otherwise.
Last month, the Organization for Economic Co-operation and Development, (OECD), revealed that Canada has the third most overvalued real estate in the developed world.
Based on the ratio of house prices to disposable income, Canada’s housing market is over-valued as much as 30 per cent. Compare it to the historical value of rent and the overvaluation skyrockets to 60 per cent.
While Lefebvre and other Canadian organizations give us many reasons why real estate has gone up and why housing looks good, they have blatantly forgotten the most important reason why real estate prices have climbed: cheap and available credit.
Lots of Easy Money
Over the last decade, we’ve had an unprecedented credit boom fueled not only by low interest rates, but also by the availability of easy credit.
While the influx of immigration and foreign money may have played a role in housing prices in Toronto and Vancouver, as Levebre suggests, it can’t be the only reason; if it was, prices should have really only affected those areas – not all of Canada.
One look at different metros across Canada and you will see that every one of them has experienced a parabolic rise in housing prices since 2003.
Credit conditions in Canada used to be much tighter than it has been over the last decade. As a matter of fact, Canadian banks were held in high regard over their strict financial lending policies after the 2008 financial crisis.
But since that time, Canadian banks have over leveraged themselves with easy approvals of mortgages to consumers that simply cannot afford them – especially if interest rates rise (and they will.)
While the government has tightened up the rules, including, most recently, reducing the maximum amortization period for a government-insured mortgage, lowering it from 30 to 25 years, there still remains the fact that a lot of mortgages already come with a lot of risk.
That’s why the federal government and policy makers are scrambling to engineer a soft landing for the country’s overheated housing market. They know that prices are so high that Canadians simply can’t afford to keep up if market conditions change.
And with interest rates already at all-time lows, there’s really only one way for rates to go: up.
When interest rates go up, affordability always goes down, and in turn, always pushes housing prices lower. Always.
The higher the interest rate, the lower the housing prices. It’s not rocket science.
But the problem is that even with our current record low interest rates, housing has become extremely unaffordable for the major metros in Canada.
Debt and Affordability
The numbers just don’t add up.
In Vancouver, we have the highest average house price in the country, and yet average income is lower than in most major Canadian centres.
The average income in Metro Vancouver in 2009 was only $41,176, according to Canada Revenue Agency statistics. Richmond residents are barely scraping by at $33,350 a year – the lowest average income in the region, followed by Burnaby, with an average of $34,961.
According to Andrew Romlo, executive director of Urban Futures, only 0.56 per cent of British Columbians declared incomes higher than $250,000.
B.C.’s debt-to-income ratio is now the highest of all Canadian provinces, with Albertans a close second. B.C. replaced Alberta in the first quarter as the province with the highest debt per person: $38,619 versus $36,223. BC was also the only province not to experience a quarter-over-quarter decrease in consumer debt. As a matter of fact, it was up 3.69 per cent.
Consumer debt, of course, does not include real estate debt.
When you combine real estate debt, Canadians are now one of the most indebted people in the world.
According to the latest IPSOS Canada study, 13.5% of Canadian families last year were labeled as “highly indebted.”

The Bank of Canada, which calls households owing more than 250% of their gross income “highly indebted,” said last month that household imbalances remain the biggest domestic risk to the financial system. The chart above shows the growing number of Canadians that are ‘highly indebted.” Most of the debt is also related to real estate.
Just how far are the residents of BC living beyond their means?
While BC is the most indebted province, the average selling price of a detached house in Vancouver has reached a whopping $1.116-million. Yet, average incomes in Vancouver are lower than other major Canadian centres.
Housing Affordability by the Numbers
Every three months, RBC shows us exactly how much Canadians can afford.
In the report, RBC notes that lenders typically qualify borrowers by checking whether mortgage payments, property taxes and heating costs account for no more than 32 per cent of gross household income.
In the first quarter of 2013, this package reached a whopping high of 82.3 per cent in Vancouver for a detached bungalow.
Nationally, housing costs ate up 42.5 per cent of the average household’s income.
That means, based on RBC’s borrower qualification, the average Canadian household cannot qualifyfor a mortgage to buy a detached bungalow.
RBC also found that when bungalow affordability gets above 44.5 per cent, it’s usually followed by a housing price correction of 5 per cent or more.
When 82.3 per cent of household income goes towards housing, what correction should follow?
When we talk about two-storey homes, the issue becomes even greater.
Two-storey houses were at 48 per cent nationally, with Vancouver coming in at 87.2 per cent, and Toronto at 62.7 per cent.
A couple wanting to buy the average-priced two-storey home in Toronto and Vancouver in Q1 would need gross annual household incomes of $132,100 and $156,200, respectively. Ottawa sits at $92,500, while the national number was $87,800.
According to Statistics Canada, the median annual income for two-parent families with kids in 2010 is $84,410. Overall, the median level of household income was $64,900 – well short of what RBC says is necessary to buy even the average bungalow on a Canada-wide basis, let alone a two-storey home.
Its no wonder condos are springing up everywhere. They are the only ones that are now affordable for the average household. According to RBC data, the condo market is comfortably affordable on a national basis, with 28.1 per cent of the average household’s income consumed by housing costs.
But therein lies yet another problem.
If condos are so affordable now, why are developers having such a difficult time selling and why are there so many vacancies in Vancouver and Toronto?
Housing is already becoming unaffordable for most Canadians – even with historically low interest rates.

So what happens when interest rates start moving up?
Interest Rates and Housing
According to the OECD, the Bank of Canada will probably begin raising interest rates in the second half of 2014 to contain inflation as the job market tightens.
They predicted that inflation will rise to 1.7% by the end of next year from 0.9% in 2013 and the unemployment rate is forecast to fall to 6.7% as the economy nears its potential amid a weaker currency.
So let’s take that into the context of housing.
A small rise in interest rates could dramatically affect the affordability of homes. Considering that interest rates have been at all-time lows, they only have one way to go and that’s up.
Let’s say the average 30-year fixed rate mortgage jumps by 60 basis points and assume that the average family has a $2000/month budget to be spent on amortizing a mortgage.
That small jump in rate suddenly means that instead of being able to afford a $425K house, the average consumer can now only buy a $395K house.
All else equal, housing just sustained a 7% drop in the average equilibrium price based on what buyers can afford!
Let’s look at another scenario:
RBC’s current 5-year fixed rate is 3.69%. Let’s assume a $500,000 mortgage (maybe just enough to buy a condo) over a five-year term.
At 3.69%, the monthly payment for that mortgage would be $2,547.
At 5.69%, the monthly payment would jump to $3,107. An increase of 22%.
At 7.69%, the month payment would jump to $3,718. An increase of 46%.
In other words, if interest rates jump 2%, housing affordability decreases by 22%. If it jumps 4%, it could decrease by 46%!
What’s scary is that a lot of homeowners have already been pushed to their limits on affordability – especially in Vancouver and Toronto. These homeowners with a budget of $2,000 per month have been lucky to have locked in low rates but their mortgages will be coming up for renewal within the next few years.
If interest rates go up even a percent or two, many of these homeowners may not be able to meet their financial obligations.
Of course, I don’t expect interest rates will move that quickly, but this activity shows us just how fragile the Canadian housing market is.
US Housing Versus Canadian Housing
Canadians often complain about the price gap between U.S. and local stores, but the biggest price gap of them all belongs to housing.
According to an analysis from BMO Capital Markets economist Doug Porter, Canadians now pay a whopping 62 per cent more for housing than Americans.
“A 62 per cent gap is simply not sustainable for long,” Porter wrote in a note to clients.
According to Porter, Canadian and U.S. house prices have historically tracked each other closely for at least 25 years, but that all changed with the U.S.’s housing bubble. Since then, House prices in the two markets have been moving in opposite directions for much of the past six years.
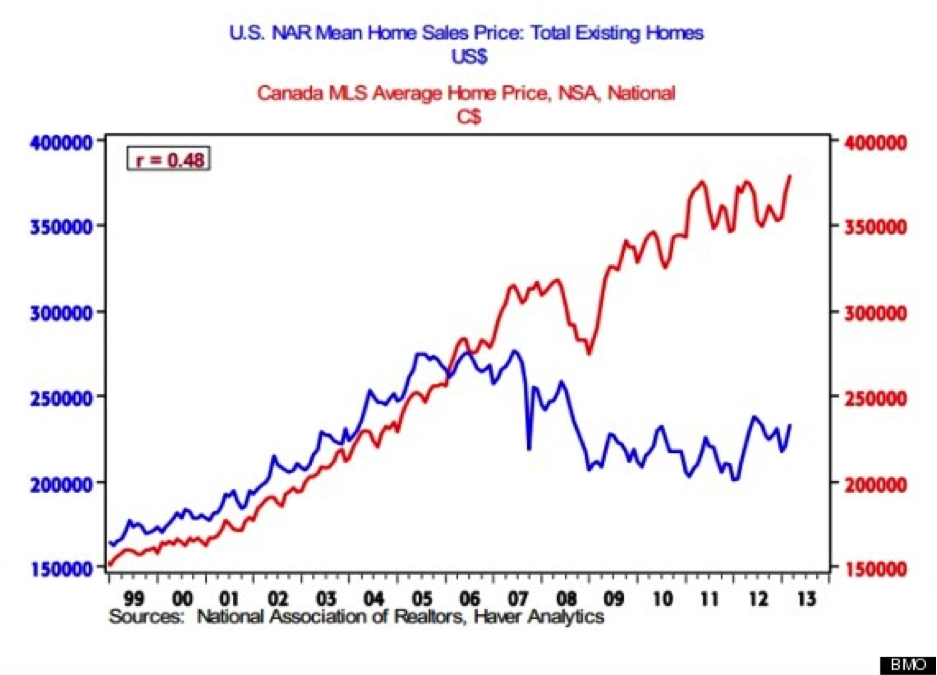
I expect we will eventually see the price gap converge as U.S. house prices creep higher, while Canadian prices fall.
The demand for real estate in Canada has already been in a one-year slowdown. Historically, it takes about a year for prices to catch up with home sale declines.
We are now at that one-year mark.
Stock Market Outlook
So where is the market headed at this point?
Being in uncharted territory, with algo-traders and Fed stimulus running the market, its almost impossible to truly predict what the short-term holds.
But looking from a historical perspective, it would seem we are close to topping out.
According to Barclays, the S&P 500′s 4.3 year rally (from the lows in March 2009) is now the 6th longest bull market out of the 24 bull markets of the last 113 years of data.
Of all the 24 bull markets, the average performance has been +127.36% (over 3.16 years). Our current market performance? +127.72%.
Oh, and remember on December 2009 when I talked about the US debt clock? At that time, the U.S. National Debt was just over $12 trillion. Today?
Nearly $17 trillion and counting…
Until next time,
Ivan Lo
The Equedia Letter

INSTITUTIONAL ADVISORS
SATURDAY, JULY 6, 2013
BOB HOYE PUBLISHED BY INSTITUTIONAL ADVISORS
The following is part of Pivotal Events that was published for our subscribers June 27, 2013.
Signs Of The Times
“Detroit Recovery Plan Threatens Muni-market Underpinnings”
“Plan to suspend payments on $2 billion of Detroit’s debt threatens basic tenet of the $3.7 trillion municipal market: that states and cities will raise taxes as high as needed to avoid default.”
– Bloomberg, June 16
The problem with too many cities and counties is that unions have been using monopolistic powers to rip off the taxpayer. City Hall will reduce the numbers of firefighters and police in order to keep extortionate pension plans going. The ordinary citizen is expected to service such demands without enjoying the benefits. Or should they be called privileges or prerogatives?
The ordinary citizen will discover the power of “No!” along with pending default.
“Lauren has boosted prices for her wedding-planning services by about 25% since 2009 as the economic expansion puts Americans in the mood for bigger parties and fancier locations.”
– Bloomberg, June 17
We have used it before:
Like civilizations, bull markets are born stoic and die epicurean.
“China’s worst cash crunch in at least seven years is an indicator of shadow lending gone awry.”
– Bloomberg, June 18
“A more prudent approach would have been to wait for tangible signs that the economy was strengthening.” St. Louis Fed on the story about “tapering” the buying program.
– Bloomberg, June 21
*****
Perspective
Once again policymakers are caught between a crock and hard place. How do they continue the image of “being in control” when Mother Nature imposed a mini-panic? They talk about “Taper”.
The mini-panic appeared almost everywhere, including China.
Did the Fed research department know what can happen to a speculative surge in credit markets in the not-so-merry month of May?
It is doubtful that something as simple as old market-lore is grasped by the suits at the top. The establishment still really believes that the Fed is in charge.
Back in the 60s and 70s a bust follow a boom and on the recession the story would be that the Fed induced the recession to bring inflation down. That meant CPI inflation, not inflation in financial assets.
Absolute nonsense.
The 3 to 4-year business cycle has been well-documented back to the 1500s. It comes and goes as it pleases. When it is on the up interventionists look good and, inevitably, when it is down they look bad.
Variation on the shorter term also includes the cycle for share certificates and credit instruments. And when it is time for a significant change it is signaled by the credit markets.
By the last week in May we described the sell-off in bonds as the “Crack of Doom”. Monday’s Disorderly Credit Markets noted that initial slump had become measurably
overdone. A period of relief would follow.
This seems on the path from excitement in April, reversal in May to heavy liquidation in the fall.
In the 1998 (LTCM) example, the main sell-off in lower-grade bonds began in that fateful August.
In the 1997 “Asian Crisis” liquidity problems in Thailand appeared on July 1st. As it rippled out around the world New York corporate bond traders believed the official line that the problem was “contained” and stayed long.
It hit the US corporate market like a freight train in that September.
Global credit markets have recorded a profound change and it has caught most traders, investors and central banks offside. Probably to an unprecedented degree.
The action could be volatile over the next six weeks or so, but as summer progresses more and more investors will become aware of the consequences of reckless policymaking. Not to overlook the implacable nature of the credit cycle.
Stock Markets
Senior indexes in New York were the last to be included in the big Rounding Top pattern. The S&P set its high at 1687 on May 22nd and the “test” made it to 1664 and then took out the previous low. Taking out 1560 will extend the downtrend. This could take a number of weeks.
Action in the senior indexes seems to be completing a cyclical bull market.
China and Hong Kong set tops early in the year and have been hit very hard over the past four weeks.
This seems to be extending their cyclical bear.
Over in the traditional cyclicals, Base Metal Miners (SPTMN) have extended the bear market that began in early 2011 at 1600. The last key low was 719 set in April. Monday’s low was 662 with the Weekly RSI down to 27. This seems low enough to prompt a brief rally.
Financial markets have been perilous with central bankers pushing radical “stimulus” that seems to hook up when the market wants to go up. This financial historian is awe-struck by the audacity of policymakers. The audacity lies in imagining that there is such a thing as a national economy and that, because it is national, it can be managed.
Then after decades of accommodation, markets brewed up into a series of bubbles. The private sector has a long history of accomplishing great speculations on its own and created a Great Bubble that climaxed in 2007.
After all of the theorizing and editorials about Fed policy when it was time another 1929, or 1873 it was accomplished in 2007. A typical crash was also accomplished. The first business expansion out of the crash has been typically week. This has been accompanied by a favourable credit cycle that exhausted itself in May.
What has aggressive to belligerent central banking accomplished? It has not materially changed the path of financial history from a Great Bubble to a Great Contraction. What is has done is exaggerate speculative furies when Mother Nature allowed it. She also decides what will become the focus of speculation.
Since last fall this has been in credit instruments and the action became excessive in April and reversed – dramatically – in May.
Typically, this pattern for the curve (charts follow) and spreads sets up forced liquidation in the fall. This will include most classes of stocks.
Based upon the brief recovery in the credit markets the improvement in the general stock market could run well into July.
Link to June 28, 2013 ‘Bob and Phil Show’ on TalkDigitalNetwork.com:
http://talkdigitalnetwork.com/2013/06/doldrum-alert/
BOB HOYE, INSTITUTIONAL ADVISORS
E-MAIL bhoye.institutionaladvisors@telus.net
WEBSITE: www.institutionaladvisors.com
Treasury Yield Curve
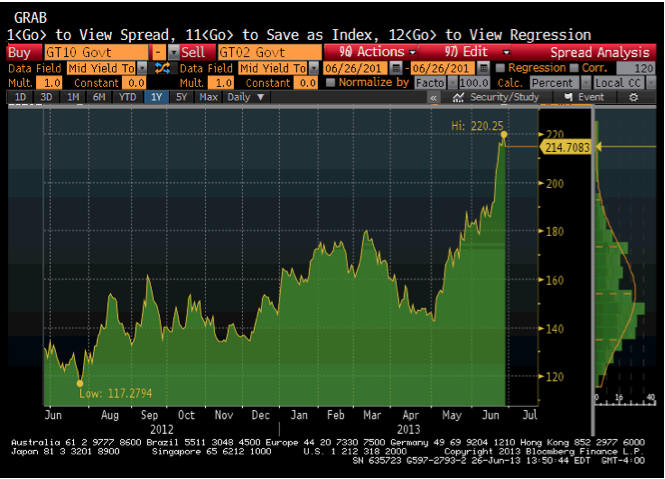
- Typically intense speculation in credit markets ends with a reversal in the curve to steepening.
- In May-June 2007 the curve was likely to reverse to steepening, and it did.
- Something similar was likely for this time this year.
- The breakout was accomplished at 180 bps at the end of May.
- The move since is impressive.
- In ordinary business conditions, a steepening curve enhances banking spreads.
- In the face of speculative financial markets the reversal is a “Sell” signal for commercial banks.
- Central banks are not traded on any market.
- Pity.
Treasury Yield Curve
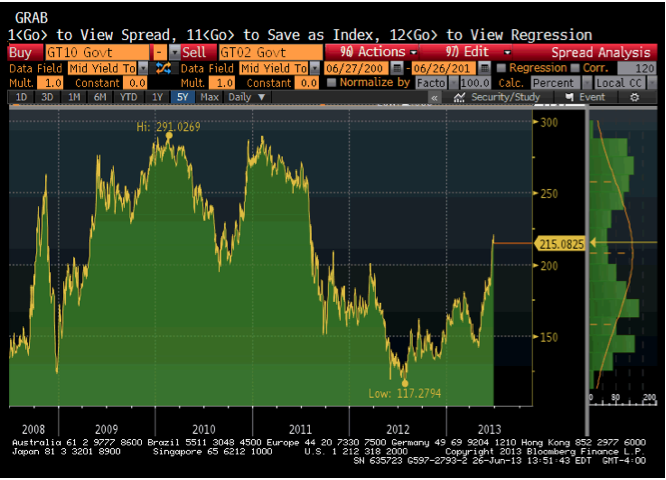
- Shows the action in 2008.
- The “breakout” occurred in that fateful June.
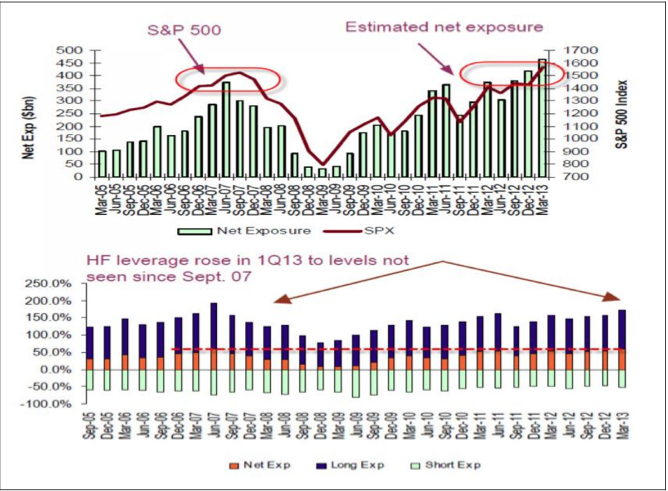
Hedge Fund Leverage
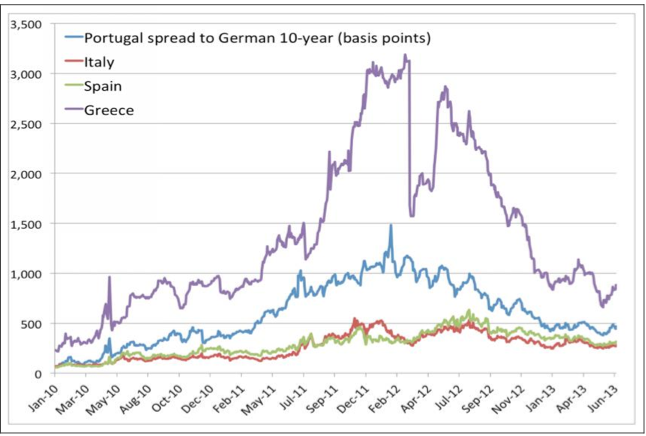
European Bond Spreads
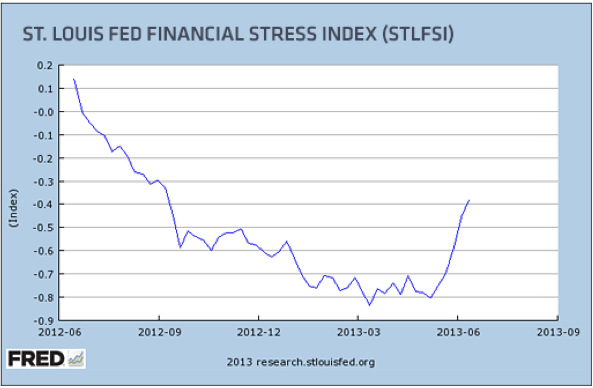
Stress Index

 Everyone loves making gains while markets rise, and we always hope that the good times will continue, even though we know deep down that markets simply don’t work that way. Right now, we have a clear dichotomy between the investment positioning of Institutional Managers (with Fiduciary Duty), and the recommendations of retail advisors.
Many big-money managers with Fiduciary Duty to their clients are taking their portfolio risk down by selling to those late-comers who are kicking themselves for not having bought during the previous panics. The buy and hold crowd including most mutual fund sales people are singing the same tune as always. Remember, mutual fund sales people only get paid their trailer fee if they keep you invested (no conflict of interest there, eh?)
As with every aspect of your life, you should make your decisions based upon your own priorities, not upon what others think is “the right thing to do.” In these silly markets, be Mindful of Your Priorities.
In this context, here’s the critical question: Is it more important for you to try and squeeze a few more percent of possible gains from equity markets, or is it more important for you to focus now on preserving your capital from the emerging risk?
When asked the above question near market highs, prudent tactical investors answer in exactly the opposite way that the majority do. “The Masses are always wrong at the extremes, but help create the trend in between.”
While the mainstream financial press is yammering on about whether or not the Federal Reserve will actually follow through on its recent musings about “tapering” its $85 billion of monthly market stimulus, here are some things to consider:
- Europe’s currency, stocks and peripheral bond markets are showing signs of FINALLY falling apart,
- Precious Metals are failing to rally with any strength and thereby foreshadowing more declines,
- Q2 Earnings Estimates are being significantly downgraded globally, and
- For 19 specific reasons to be concerned about the Global Economy, Click Here: http://www.zerohedge.com/news/2013-07-05/19-reasons-be-deeply-concerned-about-global-economy
Meanwhile, stocks are already priced for perfection. Over the next couple months, does this strike you as a time to stay in, or get your capital to safety?
In these silly markets, be mindful of your priorities, and follow through with a specific plan that matches them. If your advisor tries to impose their agenda over your priorities, just remember whose money it is.
Patience and Discipline are accretive to your wealth, health and happiness; Fear and Greed are destructive.


-
I know Mike is a very solid investor and respect his opinions very much. So if he says pay attention to this or that - I will.
~ Dale G.
-
I've started managing my own investments so view Michael's site as a one-stop shop from which to get information and perspectives.
~ Dave E.
-
Michael offers easy reading, honest, common sense information that anyone can use in a practical manner.
~ der_al.
-
A sane voice in a scrambled investment world.
~ Ed R.
Inside Edge Pro Contributors

Greg Weldon

Josef Schachter

Tyler Bollhorn

Ryan Irvine

Paul Beattie

Martin Straith

Patrick Ceresna

Mark Leibovit

James Thorne

Victor Adair