
Personal Finance
With almost half of Canadian farmers aged 55 and over, a burgeoning number looking to build a retirement fund from the sale of their land have access to a new class of buyer – venture capitalists.
Strong investor interest is based on the assumption that Saskatchewan land is a relatively safe investment and that global demand for food, feed and biofuel products will continue to increase over the long term.
Saskatchewan farmland, based on its productive capacity, continues to trade at a significant discount compared to land in other parts of Canada and around the world. “We particularly like … Saskatchewan because there’s this demonstrable discount on farmland prices if you look at (the cost for) a bushel of productive capacity,”
…..read more HERE

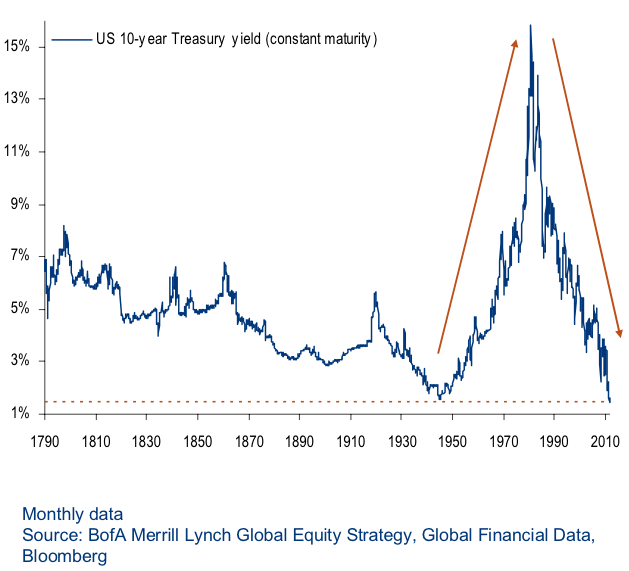
To best answer the question as to where U.S. Treasury yields are headed in the next quarter or two, it is important to know where they would be without the manipulation of our central bank, where they would be in a growing economy and, also, absent the threat from an imminent collapse of a major foreign currency.
The current yield on the Ten-Year Note is 2.6%, up from 1.6% less than two months ago. True, that rate has surged of late but it is still far below its 40-year average of around 7%. But just prior to the beginning of the Great Recession (in fall of 2007) the yield on the Ten-Year Note was 4%–140 basis points higher than today.
And in the spring of 2010; a year after the recession ended, the conclusion of QEI and prior to the Greek bailout, the Ten-Year posted a yield of 3.8%. Therefore, it isn’t at all a stretch to anticipate yields going back toward 4% in the very near future–If indeed it is true that we are not currently in a recession, the Fed will soon start to winding down QE and there is no mass piling into Treasuries from a collapsing foreign currency.
What’s more, the Fed now holds over $3.5 trillion worth of securities on its balance sheet, $1.9 trillion of which are U.S. Treasuries. That compares with just $800 billion at the start of 2008. This means if the market now believes the Fed has started down the path of eventually unwinding its balance sheet the selling pressure will be immensely magnified as compared to several years ago. In addition, due to banking distress in China and a back up in yields in Japan, these sovereign governments may not be able to support Treasury prices to the same extent as they did in the past. These two nations already own $2.3 trillion of the current outstanding $11.9 trillion worth of Treasury debt.
Meanwhile, the Fed persists in sophomoric fashion to scold the market for misinterpreting its mixed messages about tapering the amount of asset purchases. But the big surprise for Mr. Bernanke and co. will be the realization that they have much less control of long term rates than they now believe.
I’ve been on record warning that once the market perceives the exit for QE is near, yields will rise. Nevertheless, expect most on Wall Street to claim the increase in rates has its basis in a growing economy and, therefore, represents good news for markets. But the true fallout from interest rate normalization will not be pretty; for it will reveal a banking system and an economy that is perilously close to insolvency.
Michael Pento
President: Pento Portfolio Strategies
O (732) 772-9500
M (732) 213-1295
The game has changed for investment markets. Drawing to a close are the days of boundless monetary stimulus to support steadily increasing risk asset prices. In its place, a new path is now being put in place where securities will now be forced to do more of the heavy lifting to justify their valuations. While this is a most welcome development for the global economy and the long-term outlook for capital markets, the transition to what will ultimately be a profoundly different policy backdrop is almost certain to be accompanied by periods of heightened turbulence and short-term volatility along the way. Thus, it is worthwhile to plan accordingly now in anticipation of what could be a particularly challenging market to navigate in the months ahead.
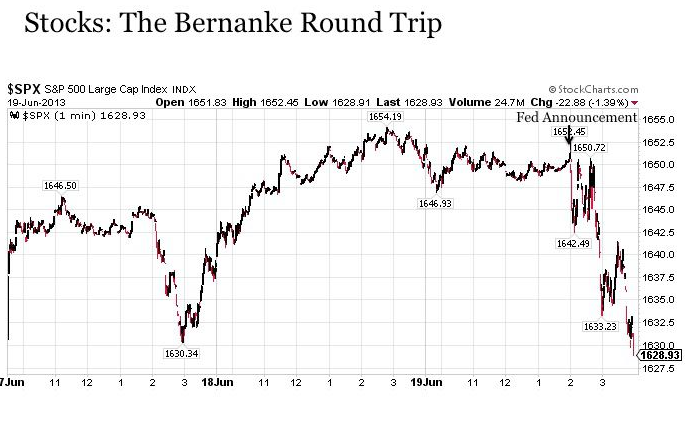
So what exactly has changed in recent weeks? It is the monetary policy stance of the central banks of the two largest economies in the world. And the benchmark date we are all likely to reflect back upon years from now when everything officially changed is June 19, 2013.
The Events Of June 19, 2013
What specifically happened on this day?
The obvious first answer is the press conference that followed the conclusion of the U.S. Federal Reserve’s latest Federal Open Market Committee meeting where Chairman Ben Bernanke took to the podium and all but explicitly stated the Fed’s intent to begin scaling back on QE3 asset purchases in the months ahead. Suddenly, the Fed’s economic outlook was more sanguine and the necessary bounds for the U.S. economy to justify scaling back on stimulus had become more attainable.
And as it became increasingly clear as the press conference progressed that the monetary support that had soothed markets higher for so long was finally on the block to go away, investors reacted swiftly and violently. Over the final two hours of the trading day, the S&P 500 (SPY) shed -1.5%, the 10-Year U.S. Treasury yield tacked on 11 basis points to 2.31% and gold (GLD) declined by -1.9%
……read & view much more HERE

- For decades, the American “paper gold” market (the COMEX) has been the primary market for determining the POYG (price of your gold).
- Most analysts in the gold community believe that demand for physical gold will somehow overwhelm the COMEX, and “liberate” the POYG. They predict vastly higher prices are coming, when that happens.
- I disagree. I believe paper gold markets will continue to be the primary price setting mechanism for gold, but Asian paper gold markets will be where most of the action is.
- Like the COMEX, the Shanghai futures exchange (SHFE) is a paper gold market. Yesterday marked the beginning of extended trading hours (night trading) for the SHFE, and volume was superb.
- The average trading volume during the day is about 90,000 contracts. The first night session saw more than 220,000 contracts change hands.
- Slowly, Shanghai’s paper gold market should begin to rival the COMEX. That’s excellent news for bullish gold investors in the West!
- Public investors in Asia are generally “pro-gold”, while Westerners are generally “pro-fiat”. Institutional paper gold investors in Asia are more reluctant to sell into price declines than their Western counterparts, and they can be eager buyers of size!
- Also, when analysing the gold price, the market actions of Japanese investors should not be overlooked. “Assets held by Mitsubishi UFJ’s gold ETF reached 24.58 billion yen ($243 million) on July 5, compared with 25.86 billion yen at the end of last year, Hoshi said. About half of the assets are held by individual investors, with the rest owned by financial institutions, pension funds and corporations and foreigners, Hoshi said. Trading value in Mitsubishi UFJ Trust’s gold ETF on the Tokyo Stock Exchange amounted to 7.23 billion yen in May, becoming the most-traded commodity fund listed in Japan, according to data compiled by the bank.”–Bloomberg News, July 9, 2013.
- The rise of Eastern paper gold markets will be a process, rather than a one-time event, so patience is required. Japan’s paper gold markets are still very small, but they are gaining popularity. The trend is definitely your friend.
- “SPDR Gold Trust, the world’s largest gold ETF, said its holdings fell 1.56 percent to 946.96 tonnes on Monday – the lowest since February 2009.” –Reuters News, July 9, 2013.
- SPDR is a Western gold ETF. In the big picture, the West continues to bail out of gold, and the East is an eager buyer of all that is offered.
- The banks are also substantial buyers, as shown by recent COT reports. To view the latest one, please click here now .
- You can see that the commercial traders’ long position is growing nicely. The gold community is not alone; powerful banks and many types of Asian entities are buyers now.
- Please click here now . That’s the hourly bars chart for gold. It shows the trading on the COMEX.
- It will be interesting to see if the SHFE night session traders can put a bit of a scare into COMEX pit traders this week.
- Regardless, my suggestion to both Eastern and Western gold traders is to be a light seller in the $1255 – $1275 range, and a buyer at $1175 – $1225.
- Please click here now . That’s the daily gold chart. No significant rally has occurred yet, but a number of bank analysts have suggested the decline is nearly finished.
- Note the position of my stokeillator. A buy signal is in play, and I don’t like to bet against it. Longer term investors should book some profits in the $1280 – $1320 zone, if the price gets there. Hold the rest as a core position.
- Chinese inflation is apparently on the rise again, as are Chinese gold imports from Hong Kong.
- Please click here now . You are looking at the GDX daily chart. It’s an appalling picture, but I’m a buyer anyways. From a tactical standpoint, I recommend adding short positions or put options with every purchase of gold stock, to maintain some semblance of emotional sanity.
- One reason that I’m now focused on gold stocks more than bullion, is because I believe that gold stocks outperform in an inflationary environment. Since 2008, deflation has been the main investment theme, but I think there is a transition to inflation, in play now.
- Also, there’s a lot of talk about owning gold bullion as a “growth with safety”play. I believe in “safety first”, not “safety after I’ve blown up in gold stocks”. Gold bullion is arguably the safest asset in the world, so it should be the first item on every investor’s buy list, not one that is bought in hindsight, after a portfolio wipeout occurs. It’s too late to transition to bullion from gold stocks now, and it’s the wrong play, in my professional opinion.
- Silver investors should click here now . That’s the daily chart for silver. I prefer to own silver stocks, rather than bullion. Buyers of silver stocks should already own silver bullion, as your “safety first” play. The red supply line on this chart is a pesky one. The stokeillator is flashing a buy signal, but the silver price still can’t break above that annoying trend line. Patience is the virtue that is required here.
- Please click here now . That’s the daily chart of SIL-NYSE, which is a silver stocks ETF. I own it, and I want to own a lot more of it. Will you join me today, in a small way, and show the East… how the West was really won? Hi, ho, silver!
Jul 9, 2013
Stewart Thomson
Graceland Updates
website: www.gracelandupdates.com
email for questions: stewart@gracelandupdates.com
email to request the free reports: freereports@gracelandupdates.com
……..But ‘Sell May And Go Away’ Risks Still Exist!
AS JULY TENDS TO BE SKEWED HISTORICALLY POSITIVE. AND, WE HAVE NOW MANAGED TO CLOSE ABOVE THAT WIDELY FOLLOWED 50 DAY MOVING AVERAGE. HOW FAR AND HOW HIGH IS THE BIG QUESTION NOW, AS WE’RE STILL IN A THEORETICAL CHOPPY PERIOD (REMEMBER, ‘SELL MAY AND GO AWAY!). HAVE TO TAKE IT A DAY OR WEEK AT A TIME. NEW HIGHS? VERY POSSIBLE, BUT THAT DOES NOT PRECLUDE ANOTHER SELL-OFF LATER. TRYING TO RIDE THE WAVE IN THE MEANTIME.

WELCOME TO VRTRADER.COM TRIAL SIGNUP:
The 30 day trial is allowed one time only. By taking this 30 day 50% trial, you agree to be charged the full cost of the monthly Silver or Platinum service (choose one only) at the end of the 30 day trial subscription period, unless you cancel first. The regular Silver monthly rate is $55.00 and the Silver quarterly rate is $145.00. The regular Platinum monthly rate is $145.00 and the Platinum quarterly rate is $390.00.
About Mark Leibovit
Mark Leibovit, CIMA, is Chief Market Strategist for VRTrader.Com. His technical expertise is in overall market timing and stock selection based upon his proprietary VOLUME REVERSAL ™ methodology and Annual Forecast Model.
He began his, thus far, 35 year career in the financial industry as a market maker on the Chicago Board Options Exchange where he made a market in such issues as Newmont Mining and later continuing on to serve as Director of Research at Rodman and Renshaw. He is both a Certified Investment Management Analyst (CIMA) and Accredited Investment Fiduciary (AIF) and is also a member of the Market Technicians Association (MTA) and the CFA Institute. Mr. Leibovit’s extensive media profile includes seven years as a consultant ‘Elf’ on Louis Rukeyser’s WALL STREET WEEK television program and over thirty years as a ‘Market Monitor’ guest for PBS’ THE NIGHTLY BUSINESS REPORT. His specialty is Volume Analysis and his proprietary Leibovit Volume Reversal Indicator is well known for forecasting accurate signals of trend direction and reversals in the equity, metals and futures markets. His comprehensive study on Volume Analysis , ‘The Traders Book of Volume’ was recently released by McGraw-Hill. Mr. Leibovit is currently Timer Digest’s #2 Gold Market Timer for 2011 and has also been named the #1 Gold Market Timer for the 5 year period ending in 2010. And, he was named the #1 Intermediate Market Timer for the 10-year period ending in 2007.
Past performance does not guarantee future results.


-
I know Mike is a very solid investor and respect his opinions very much. So if he says pay attention to this or that - I will.
~ Dale G.
-
I've started managing my own investments so view Michael's site as a one-stop shop from which to get information and perspectives.
~ Dave E.
-
Michael offers easy reading, honest, common sense information that anyone can use in a practical manner.
~ der_al.
-
A sane voice in a scrambled investment world.
~ Ed R.
Inside Edge Pro Contributors

Greg Weldon

Josef Schachter

Tyler Bollhorn

Ryan Irvine

Paul Beattie

Martin Straith

Patrick Ceresna

Mark Leibovit

James Thorne

Victor Adair