
Stocks & Equities
Economist Marc Faber Predicts Stock Market Crash : Marc Faber had a grim prediction for the Stock Market when he appeared on The Crash Proof Retirement Show® and spoke to Phil Cannella about the future of the markets. He thinks a big crash is coming soon, and that now is not the time to be investing in stocks. (in 38 seconds Marc outlines the 2 scenarios he sees)
Ed Note: 2 more short commentaries made on Monday from Marc below….
Marc Faber warns about colossal Credit Bubble in China
This Money Printing has a number of unintended consequences that will eventually be very costly
screenshot below is linked to the youtube above (its just for presentation on front page)
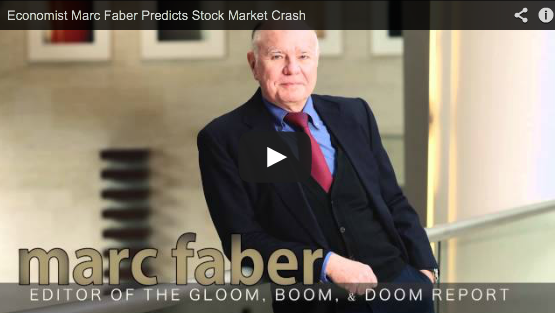

 He shares his thoughts on Gold (“Expect higher prices”), Silver (“It’s still money’), Oil (“$200 a barrel”), and Freedom (“I’m optimistic”)
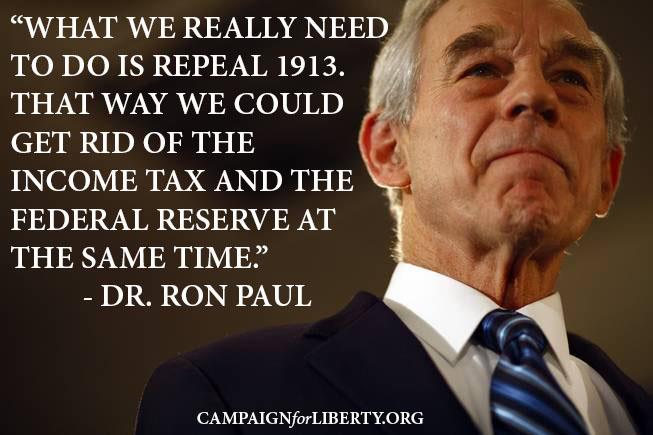
It would be impossible to find someone in Washington who knows more about monetary and fiscal policy, the Federal Reserve, free markets, Austrian economics, and gold and silver than former congressman and presidential candidate Ron Paul.
In addition to being a medical doctor, and a 23 year veteran if Congress, Dr. Paul is the author of numerous books including The Case for Gold, End the Fed, Liberty Defined, and A Foreign Policy of Freedom.
If it is not legendary yet, Ron Paul’s prescience certainly deserves to be. From warning about the consequences of Nixon’s abandonment of the dollar’s ties to gold, to alerting the country to the calamity that would be the Iraq war, to his statement in Congress describing with shocking precision in advance just how the housing bubble would inflate and burst, Dr. Paul has demonstrated that his views must be taken very seriously, indeed.
In an exclusive interview for my readers, I spoke with Ron Paul the day before Independence Day.
….whole interview HERE

 Consumer prices picked up in June and underlying inflation pressures showed signs of stabilizing.
U.S. consumer prices rose a seasonally adjusted 0.5% in June to mark the biggest increase since February, as the cost of gasoline, housing, medical care, clothing and food all rose, the Labor Department said Tuesday. The energy price index shot up 3.4%, spurred by a 6.3% gain in gasoline. Food prices rose 0.2%. The core CPI, which excludes volatile food and energy costs, also advanced 0.2%. Economists surveyed by MarketWatch had forecast a 0.5% increase in the broad CPI and a 0.2 % gain in the core rate. Consumer prices have risen an unadjusted 1.8% over the past 12 months, up from 1.4% in May. Real or inflation-adjusted hourly wages, meanwhile, were flat in June. Real wages have risen just 0.4% over the past 12 months.
Other data yesterday showed industrial production pushed higher in June as manufacturing output found some momentum.
While both inflation measures remain below the Federal Reserve’s 2 percent target, details of the report suggested the recent disinflation trend was fading, with medical care costs rising. Prices for new motor vehicles, apparel and household furnishings also increased.
Fed Chairman Ben Bernanke, who last month said the central bank would start cutting back the US$85 billion in bonds it is purchasing each month to keep borrowing costs low, has viewed the low inflation as temporary and expects prices to push higher.
Alan Ruskin, an analyst at Deutsche Bank in New York, said the report should “counter arguments that there is a material deflation risk.”
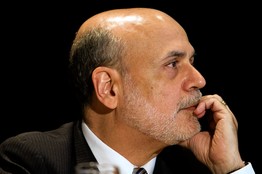 Federal Reserve Chairman Ben Bernanke appears before the House Financial Services Committee Wednesday at 10 a.m. to kick off his two-day semiannual testimony on the economy and monetary policy. In a break from past custom, Mr. Bernanke’s prepared testimony will be released at 8:30 a.m., giving investors and lawmakers a good while to digest the document before the Fed chief even opens his mouth and before U.S. markets open. As is often the case, however, any new nuggets of information are more likely to come during the question-and-answer session than from the prepared statement.
It’s been a wild couple of weeks for markets since Mr. Bernanke’s June press conference, when he laid out a tentative timetable for winding down the Fed’s bond-buying program. Here are three things to watch for as he speaks again:
…..all 3 HERE
 Oil may hold the key to the next big move in gold. On the geopolitical front, the Iranian government’s nuclear program could trigger an attack from Israel, and that could cause oil to surge higher.
- Syria and Egypt are two more “hotspots” that could cause traders to buy oil aggressively, if military action intensifies.
- Please click here now. You are looking at the monthly oil chart, and it could be argued that a major upside breakout is now in play.
- I’ve highlighted a symmetrical triangle on that chart. The technical target is about $145, which is close to the all-time highs in the $147 area.
- If oil surges higher because of a geopolitical shock, gold is likely to follow.
- Despite the breakout, there is strong HSR (horizontal support and resistance) in the $110 – $115 area. Oil is likely to hesitate there.
- If there is no intensification of military action in Iran, Syria, or Egypt, and the US economy shows growing inflationary pressures while slowing down, value-based fund managers could move funds from the general stock market to gold.
- Monday’s retail sales report was disappointing, and today the key CPI (Consumer Price Index) report will be released, followed by the Fed’s industrial production report.
- In the eyes of mainstream fund managers, today’s reports are important economic barometers, and if economic production is disappointing, they could buy gold aggressively. That could push the price to $1300, or higher.
- I’ve suggested that traders should be sellers in the $1280 – $1340 price zone. If today’s reports cause gold to rally, book some profit.
- Please click here now. That’s the daily gold chart. Note the position of the lead line of my stokeillator. It’s risen to about the 70 level. Minor market trends tend to last for about one to three weeks. My stokeillator is arguably ideal for identifying the potential start and end of these price movements.
- In the “minor trend picture”, profit booking is the current theme, because the move to the upside is getting a little long in the tooth. When the stokeillator gives a sell signal, the price can turn lower or just drift sideways.
- In the biggest picture, events in India have become very important to the gold price. A ban on gold coin and bar sales to all citizens is in effect now, and it is being enforced.
- Almost 40% of the Indian population makes less than two dollars a day, yet they are the largest gold buyers in the world. The industrialization of India will dramatically increase the gold-buying power of Indians, and I expect that Indian demand for physical gold will exceed global mine supply by around the year 2020. Also, I believe the current coin and bar sales ban in India will be lifted fairly quickly. Here’s why:
- The government blames the current account deficit on gold imports. I blame it on foreign investment outflows and government corruption. Regardless, the Indian government seems to be working quickly to not only halt the outflows, but reverse them. Legislation is pending that should increase FDI (foreign direct investment). Foreign ownership restrictions are set to be chopped, in a big way.
- If that happens while US stock markets enter the dangerous “crash season” of September – October, institutions could pour a lot of money into India.
- Please click here now. You are looking at the daily chart of the dollar versus the rupee. As the dollar has surged, money has poured out of India, but you can see that the dollar just broke the uptrend line.
- The rupee is already stabilizing, and a stable currency, regardless of the price level, attracts foreign investment.
- As I mentioned earlier, if oil surges on a geopolitical shock, gold should leap higher too. If it falls on economic downturn news, while the rupee is stable, it will help India’s current account deficit, because the nation is a massive importer of oil. The price action of oil, up or down, is likely to be a “win win” situation for the gold community!
- India’s central bank hiked short term lending rates yesterday, further stabilizing the rupee. It’s highly likely that Indian finance minister CP Chidambaram and central bank governor Duvvuri Subbarao will gain global support for their plan to stabilize the currency, and increase FDI. The G20 central bank and finance minister meeting in Russia is only two days away, and I think Chidambaram and Subbarao will make it very clear to the rest of the G20, that India is critically important to the health of the global economy.
- While India is probably the “prime mover” of the gold price for now, events in America are also important. Ben Bernanke makes it pretty clear that he has major concerns about deflation and the US economy. The longer that QE continues, whether tapered or not, the more diluted the US dollar becomes. The weakening of the dollar is a much longer term process than most analysts realize, but it is very real.
- My recommendation every year is for US stock market investors to sell all holdings around August 7th. Stay on the sidelines until the market either crashes, or to the end of October. Historically, the cost of taking a two or three month break from the stock market has been very small, and most of the worst crashes tend to occur in September and October. Also, I think it is good for the spirit, not just for the pocketbook, to take a break from playing the stock market.
- Please click here now. This weekly chart compares the Dow to GDX (gold stocks). I’ve highlighted an RSI technical non-confirmation. It doesn’t suggest that the Dow is about to crash, but it does suggest that investors may be wise to sell the Dow and buy gold stocks.
- Please click here now. You are looking at the daily GDX chart. Note the hesitation at $25, highlighted with a blue HSR line. Also, there may be a bullish wedge pattern forming; note the black trend lines that are converging. The technical action on this short term chart adds weight to the argument that gold stocks could be the best asset to hold, going into stock market crash season!
Special Offer For Website Readers: Please send me an Email to freereports4@gracelandupdates.com and I’ll send you my free “Battle Of The Metals!” report, comparing the relative merits of gold, silver, platinum, and palladium!
Thanks!
Cheers
St
Note: We are privacy oriented. We accept cheques. And credit cards thru PayPal only on our website. For your protection. We don’t see your credit card information. Only PayPal does. They pay us. Minus their fee. PayPal is a highly reputable company. Owned by Ebay. With about 160 million accounts worldwide.
Written between 4am-7am. 5-6 issues per week. Emailed at aprox 9am daily.
Email: stewart@gracelandupdates.com
Rate Sheet (us funds):
Lifetime: $799
2yr: $269 (over 500 issues)
1yr: $169 (over 250 issues)
6 mths: $99 (over 125 issues)

-
I know Mike is a very solid investor and respect his opinions very much. So if he says pay attention to this or that - I will.
~ Dale G.
-
I've started managing my own investments so view Michael's site as a one-stop shop from which to get information and perspectives.
~ Dave E.
-
Michael offers easy reading, honest, common sense information that anyone can use in a practical manner.
~ der_al.
-
A sane voice in a scrambled investment world.
~ Ed R.
Inside Edge Pro Contributors

Greg Weldon

Josef Schachter

Tyler Bollhorn

Ryan Irvine

Paul Beattie

Martin Straith

Patrick Ceresna

Mark Leibovit

James Thorne

Victor Adair