
Energy & Commodities
There’s no denying China’s massive economic growth over the past decade, as the country recorded an average GDP of more than 10% per year. In only seven years, China’s economy doubled; in 13 years, it tripled.
With this incredible expansion, China began to import commodities at an incredible pace. In 2000, the country imported only 70 million tons of iron ore; today, it’s more than 10 times that amount, at 763 million tons. Copper imports increased dramatically too, growing from 1.6 million tons in 2000 to more than 4 million tons per year today, according to BCA Research data.
And when it comes to oil demand, 17 years ago, China was a net exporter. Today, it is the second-largest importer, transporting 5.4 million barrels of oil into the country every day.
That’s why it is widely accepted that the Asian giant spurred higher commodity prices in the past decade.
And if the country was the force behind the boom, then the assumption is that China’s lower, but still healthy growth will be a drag on commodity prices.
But recent research challenges this assumption.
According to BCA Research’s Chen Zhao, what is initially an “outrageous proposition” may not actually be. The analyst says the fact that China’s consumption of industrial commodities significantly increased at the same time prices rose may have only created “the impression that China was the main driving force behind the commodities boom.”
Consider that since the substantial growth early in the last decade, China has continued to import commodities at a remarkable pace. Since 2007, the Asian giant buys 2 times more iron ore, 1.5 times more copper and 6 times more coal from other countries.
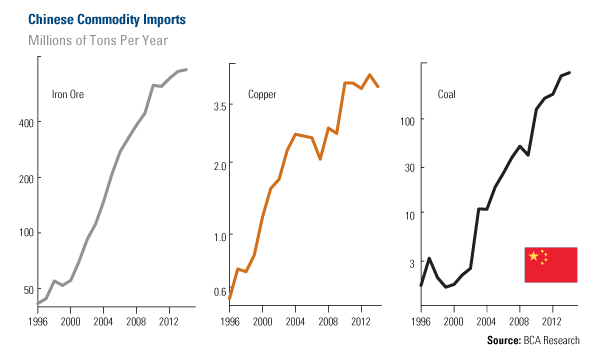
“The level of Chinese commodity imports obviously reflects the size of its economy,” says BCA. So even if the growth rate has slowed down, “the absolute level of Chinese commodity demand continues to set new records every year.”
…..read page 2 HERE

 One study of bull market peaks over the past 80 years finds eerie similarities with current conditions.
We may be closer to a major market top than most investors think.
That at least is the conclusion that emerged when I compared the current market environment to what prevailed at major market tops of the past century.
To be sure, there are some dissimilarities as well. But that doesn’t necessarily mean we’re not peaking. No two tops are exactly alike. As Mark Twain famously said, even if history does not repeat itself, it does rhyme.
With that thought in mind, I examined all 35 bull market tops since the 1920s. I searched for patterns in the performance of not only the market itself, but of various internal market factors, such as earnings and price/earnings ratios. I was also interested in how small company stocks tend to perform in the months leading up to a top, both in their own right and relative to large-cap stocks. Likewise, I searched for patterns in the relative returns of growth and value stocks.
I relied on several extensive databases: Yale University Prof. Robert Shiller’s database of Standard & Poor’s 500 earnings and P/E ratios, as well as a database showing the relative performances of small- and large-cap stocks, as well as of the growth and value styles, maintained by Eugene Fama of the University of Chicago and Ken French of Dartmouth. To determine when bull and bear markets have begun and ended, I relied on the precise definitions employed by Ned Davis Research, the quantitative research firm.
Here’s what I found.
Market rises steeply before bull dies
The typical bull market comes to an end following a period of extraordinary performance. In other words, some of a bull market’s best returns are produced right before it dies.
This is important to know if you thought that this bull market would, before it breathes its last, begin to slow down and go through a period of modest performance. That’s not typically the case: On a price chart, the average market top looks more like a pointed mountain peak than a plateau.
While it is of course possible that the next market top is more like a plateau, it would be the exception rather than rule: Since the 1920s, the average bull market has gained more than 21% over the 12 months prior to a top — more than double the long-term average.
Interestingly, the stock market recently has produced a return that is quite similar to this average 12-month gain prior to market tops: The S&P 500 over this period is up nearly 23%.
Riskiest stocks shine before market tops
One of the most striking patterns about these months leading up to a market top is that the riskiest stocks far outperform the most conservative ones.
Profs. Fama and French have devised two proxies for risk. One is the relative performance of value stocks over growth issues; stocks with low price-to-book ratios are deemed value stocks, while those with high ratios are in the growth category. Their second risk proxy is the performance of small company stocks relative to the large-caps.
…..read page 2 HERE

CRUDE:
Crude Oil bottomed (weekly data) about 12/25/1998 at $10.75. It rose erratically for several years, hit another low on 8/24/2007 at $68.70, and then rallied dramatically to an all-time high of $147.20 on 7/11/2008. Subsequently, crude collapsed to $35.35 on 12/26/2008.
SILVER:
Silver bottomed (weekly data) about 11/23/2001 at $4.01. It rose erratically for several years, hit another low on 2/5/10 at $14.78, and then rallied dramatically to a nearly all-time high of $48.58 on 4/29/2011. Subsequently, silver collapsed to $18.53 on 6/28/2013.
SO WHAT?
Both crude and silver took about 9.5 years to rally from a significant low to an important high. The high to low ratios were similar – over 13 and over 12. Both collapsed after their blow-off highs and fell 76% and 62% from their highs. Crude rallied during the next four years and is now over triple its crash low. Silver, a much smaller and more volatile market, seems likely to do something even more dramatic.
Questions:
Assume market prices for crude oil are based on supply and demand of physical crude oil. Do you think supply and demand for physical crude oil changed sufficiently between the crude low in August of 2007 to the high in July 2008 to the low in December 2008 to justify a rise from $68.70 to $147.20 and then a fall to $35.35?
- Answer one: Obviously it did; the market price changed and the market price is always correct.
- Answer two: Perhaps politics, High Frequency Trading (HFT), and derivatives also affected the supply and demand of paper contracts for crude such that the price of crude more than doubled and then collapsed by 76% in about 1.3 years.
- You choose the best answer.
Assume market prices for silver are based on supply and demand. Do you think supply and demand for physical silver metal changed sufficiently between the silver low in February 2010 to the high in August 2011 to the low in June 2013 to justify a rise from $14.78 to $48.55 and then a fall to $18.53?
- Answer one: Obviously it did; the market price changed and the market price is always correct.
- Answer two: Perhaps politics, High Frequency Trading, and derivatives also affected the supply and demand of paper contracts for silver such that the price of silver more than tripled and then collapsed by 62% in about 3.4 years.
- You choose the best answer.
WHY DISCUSS THIS PARALLEL?
Sentiment for silver and gold was (June 2013) exceptionally low – at multi-year or multi-decade lows depending on who is measuring sentiment. As of the end of June 2013 there seemed to be “no light at the end of the tunnel” for silver bulls and there was no joy in “silver-ville.” Most people I know wanted nothing to do with silver or gold.
It was about the same with the crash low in crude 4.5 years ago in December of 2008 and the S&P500 crash low in early 2009. But the world economies demanded crude oil while the supply was flat or declining. Consequently the price rallied back to over $105 this month – about triple its collapse low price.
I think it is quite reasonable to expect that silver will also rally substantially from here. In fact an explosive rally would not be surprising. What seems likely is a multi-year rally (that culminates in another price blow-off) to four or six (or ten) times the low price in June, the inevitable price collapse, and then some months or years in a trading range at prices that make sub-$20 silver look like an absolute bargain. I suppose that if the US congress balances the budget AND world peace is confirmed, then silver prices are unlikely to rally… but I would rather bet on higher silver prices.
How are crude oil and silver similar?
Both had a nine plus year rally to a blow-off peak, collapsed, and rose again. Crude began its rally about three years before silver, and peaked about three years earlier. Both are essential for modern economies and their prices on the paper exchanges are heavily influenced by politics, HFT, and derivatives. The supply of crude is probably declining and the supply of silver is growing quite slowly. The world-wide demand for crude is likely to increase, even with slowly growing economies. The world-wide demand for silver is likely (my opinion) to dramatically increase due to increasing industrial demand and potentially explosive investor demand. There is good reason and good historical precedent to expect the price for both commodities to increase substantially, with great volatility.
Do you remember when crude was priced under $5.00 per barrel and silver was priced under $2.00? Given the penchant for governments around the world to run huge deficits, amass unpayable debt, and increase themoney supply (monetize bonds) in seemingly unlimited quantities, do you think either $250 crude or $100 silver is unlikely in the next several years?
Neither do I!
We will see $250 crude, $10 gasoline, and $100 silver, unless the world’s economies and governments become responsible and accountable.
Have you purchased your Silver Eagles today?
Read: Silver – Keep It Simple
Read: Gains In Silver Will Be Historic
GE Christenson | The Deviant Investor

The majority of gold and silver miners are on the ropes, big time. Downgrades by credit-rating agencies are imminent. So they’re scrambling to cut costs, dump assets, and beef up their balance sheets.
That’s what happens when the price of your underlying product plunges, like gold and silver have over the past two years. A call I made way back in September 2011.
And now, the average mining share has lost about 63 percent of its market value. The average junior miner even more, a whopping 78 percent.
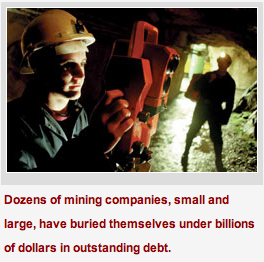
According to BMO Capital Markets, 55 gold and silver companies the firm analyzed increased their net debt, or debt minus cash, from less than $2 billion 10 years ago to a record $21 billion today.
Most of that debt was borrowed at extremely low interest rates. Now that rates are rising, many mining companies will get absolutely killed by the additional debt payments.
 Consider gold mining giant Barrick Gold (ABX). In 2008, Barrick had $4.5 billion in outstanding debt. It now has $14.8 billion of debt, after borrowing heavily to pay for its $7.65 billion takeover of Equinox Minerals Ltd. in 2011.
That deal was Barrick’s way of diversifying into copper. That wasn’t a smart move since the company borrowed billions and bought a copper company at the top of the copper market.
So in addition to the higher interest rates that Barrick will have to pay on its debt now, it’s also losing money hand over fist on its copper.
As a result, Barrick is postponing its flagship Pascua-Lama mine, whose cost estimate has gone up to $8.5 billion from around $5 billion. It’s also writing off as much as $5.5 billion of debt it thinks will go bad.
There’s more: Due to the rising costs of mining, it costs Barrick roughly $1,800 to get an ounce of gold out of the ground. So with gold at $1,300, Barrick is losing about $500 on every ounce of gold it mines, in addition to its copper losses.
Put another way, gold would have to rally well past $1,800 an ounce for Barrick to make even a few percentage points of profit on its gold. Copper would have to get back to well above $4, up about $1 from its current price. And interest rates would have to come down and stay down for Barrick to survive its debt burden.
A pretty picture? Hardly. But Barrick isn’t alone. It’s the same story for dozens of mining companies out there, small and large.
But quite frankly, it’s also music to my ears.
Why? Because I love buying mining shares when they are beaten up, not when they’re rocketing higher and at the top of a major run.
That’s what my subscribers did way back in the 2000 when I told them to buy gold and mining shares.
If you had heeded my major “buy” and “sell” signals on the yellow metal since then — and you acted on my signals to buy and sell some of the top gold mining shares — you could have grabbed substantial long-term profits. Profits like:
• A 150.6 percent gain in AuRico Gold …
• A 288.8 percent gain in Harmony Gold …
• A 301.5 percent gain in AngloGold Ashanti …
• A 415.4 percent gain in Newmont Mining …
• A 541.1 percent gain in International Minerals Corp. …
• A 554.8 percent gain in Gold Fields Ltd, and …
• A 750.1 percent gain in IAMGOLD Corp. — enough to turn every $1,000 invested into more than $85,000.
And believe it or not, these are not even close to the biggest gainers you could have jumped on:
• Agnico Eagle Mines jumped 850.2 percent …
• Kinross Gold Corp. jumped 877.8 percent …
• Newcrest Mining jumped 1,059.4 percent …
• Goldcorp jumped 1,248 percent, and …
• Royal Gold, one of my favorites, jumped an amazing 2,957.9 percent.
That gain in Royal Gold alone would have been enough to turn every $10,000 you invested into $305,790 … and a $40,000 investment into more than $1.2 million.
Unfortunately, it’s impossible to travel back in time and grab these entire moves. Nobody can. But that’s ok because — as I’ve been warning you recently — gold and silver are bottoming and so are mining shares.
To grab your share of this huge new profit potential,
take these critical steps IMMEDIATELY.
FIRST, make sure you have plenty of cash on hand. If you’ve been following my signals for the last two years — to stay out of or refrain from buying more precious metals and mining shares and to build your hoard of cash instead — please make sure that cash is ready to be deployed on a moment’s notice.
If for some reason you didn’t follow my signals and did not build up your cash hoard, be sure to do so immediately. The best way: Dump any bond investments you own.
As interest rates continue to rise, believe me, those are going down the tubes. Even municipal bonds are a disaster. Just consider Detroit’s bankruptcy last week and how much money bondholders stand to lose there.
SECOND, make sure you have a brokerage account set up and ready to trade mining shares and mining ETFs and leveraged ETFs.
It’s all up to you and what you can afford. But my recommendation is to commit at least $25,000 to trading the next bull market in the precious metals.
THIRD, never forget the biggest profits come from buying assets that the majority are bearish on … from buying companies and investments when they have been beaten down.
But you also can’t just run out and willy-nilly buy any beaten down mining company. For instance, though I liked Barrick before, it’s now off my buy list. In fact, it’s on my list of 10 mining shares to dump right now.
Best wishes,
Larry

After no involvement with gold for a few years, I came back into the gold market in the spring of 2003 because it looked like gold had bottomed—it was just under $325 at the time—and the thought was that it could make a run towards key resistance at $400. That’s right – $400. While stepping aside for corrections in gold and silver along the way, I rode gold to its September 2011 highs…
The neon sign over my picture that flashed “GENIUS” would end up blowing a fuse and then fall and smack me in the head, a reminder of the infamous saying among pundits, “You’re only as good as your last call.”
I said a couple of weeks ago during an interview that we won’t see gold under $1,200 again in my lifetime, and at age 57, I’m not planning any exit soon from this earth. (But if I end up wrong my wife could force the issue.)
Because of some critical factors, I have never been more bullish on gold.
The first factor, IMHO, is the single biggest bullish factor and I doubt it will be found on top of most others’ lists, if mentioned at all. However, I believe it was the match that lit the fuse to a coming explosion in gold unlike any other since gold began free trading 40+ years ago, and those who know me throughout my 30-year career in and around Wall Street know I have never even remotely spoken like this.
After initially not allowed to see its own gold despite demanding to do so, Germany announced this year that it will seek to have 20% of its gold held by the U.S. returned to Germany. Now, that in itself didn’t make it my number one bullish reason; the fact that Germany was told it would take up to SEVEN YEARS to complete the task did!
Stop here. If you honestly can’t grasp the gravity of that it’s senseless for you to read any further. If you’re like me and smell a rat, read on.
 There’s no *@#%^ it should take such a time frame except that you don’t have the gold to ship. Anyone like members of GATA who have dared to suggest that official gold reserves are way overblown and much of that gold has been already lent out have been labeled kooks, goldbugs and tin-foil-hat wearers. What do I think of this?
Okay, let’s just say for a moment we kooks are right – that real metal for official purposes is scarce. What would need to take place? One would need to acquire massive amounts of gold quickly. How would one attempt to do so? Create a reason or reasons for those who own it to sell it. How? Use an old adage of “selling begets selling,” and do so at the worst possible time to create the view that prices could fall sharply.
This took place earlier this year and the number of bears increased as if Miracle-Gro was spread on them. Throw in the merry men of financial journalism who are little more than mouthpieces for the “Don’t Worry, Be Happy” crowd which controls Wall Street, and you literally create panic selling.
The story could have ended there and the Federal Reserve lives happily ever after while the German gold demand dies, but a funny thing happened on the way to the forum. Paper gold was sold hard and heavy but, instead of causing physical players of gold to fall in line, physical buyers screamed, “Feed me more!” People were willing to pay $100 or more above the current paper price of gold just to get some real metal. The Fed Chairman even went so far as to talk out of both sides of his mouth about “tapering” the Fed’s bond buying in hope of pushing gold lower.
Gold not only stopped going down, but it began to rebound as the market saw incredible amounts of gold being bought in the Far East even as holdings in known gold vaults were falling faster than A-Rod.
When it comes to gold, it’s not just Denmark where something was rotten but right here in the U.S., and I think the jig is up. As the situation becomes known even to the “Talking Heads” on TOUT-TV, we shall see a rise in gold unlike any other. If not and we actually go the other way, look for me on a future segment of Divorce Court.
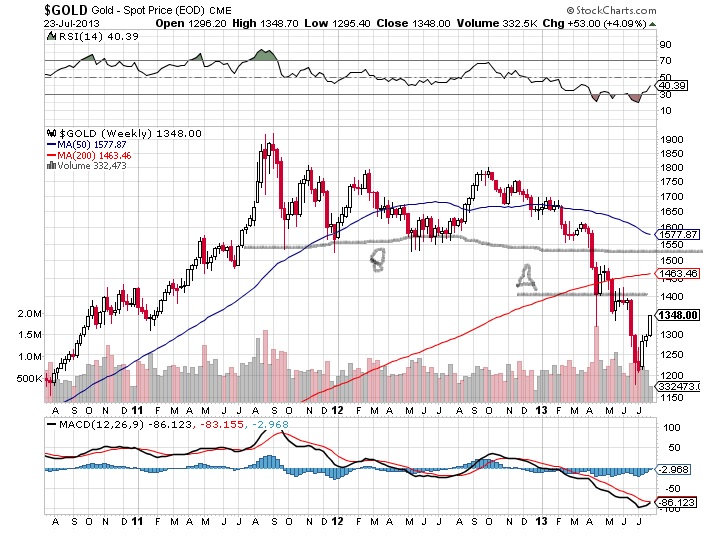
We need to get above two key resistance levels before my belief can have any real chance of success. For starters, we need to get above $1400 (Point A) and stay there in the not-too-distant future. The overwhelming number of bears can and will argue this area is just another selling opportunity, and until that is proven wrong, their friends in the financial media will continue to give them carte-blance coverage (We can back off $1.350 once or twice before a run to $1,400).
More importantly, the old key support in the $1,500 – $1,550 area (Point B) will be difficult to overcome and likely need several challenges before giving away to a run to new, all-time highs in 2014 and beyond.

-
I know Mike is a very solid investor and respect his opinions very much. So if he says pay attention to this or that - I will.
~ Dale G.
-
I've started managing my own investments so view Michael's site as a one-stop shop from which to get information and perspectives.
~ Dave E.
-
Michael offers easy reading, honest, common sense information that anyone can use in a practical manner.
~ der_al.
-
A sane voice in a scrambled investment world.
~ Ed R.
Inside Edge Pro Contributors

Greg Weldon

Josef Schachter

Tyler Bollhorn

Ryan Irvine

Paul Beattie

Martin Straith

Patrick Ceresna

Mark Leibovit

James Thorne

Victor Adair