
Gold & Precious Metals

What If War Against Syria Causes China, Russia And The Rest Of The World To Stop Buying US Debt?
Can the U.S. really afford to greatly anger the rest of the world when they are the ones that are paying our bills?  What is going to happen if China, Russia and many other large nations stop buying our debt and start rapidly dumping U.S. debt that they already own? If the United States is not very careful, it is going to pay a tremendous economic price for taking military action in Syria. At this point, survey after survey has shown that the American people are overwhelmingly against an attack on Syria, people around the globe are overwhelmingly against an attack on Syria, and it looks like the U.S. Congress is even going to reject it. But Barack Obama is not backing down. In fact, ABC News is reporting that plans are now being made for a “significantly larger” strike on Syria than most experts had expected.
If Obama insists on going forward with this, it will be the greatest foreign policy disaster in modern American history.
….read more HERE

Gold – We need to watch gold closely as it’s at a critical junction. After getting above initial resistance around $1,350, it has wobbled at next key resistance around $1,425 – $1,450. It’s critical gold remain above the $1,350 area and eventually get above $1,450 to put a nail in the coffin of those who have tried to break its back and still are out there as we speak.
U.S. Stock Market – It’s been my belief for quite some time now that the U.S. stock market won’t see a major sell-off until such time the perception of the FED goes from being in front of the curve to behind. I suggested this could occur as fall took hold and the economy accelerates to the downside, causing any “tapering” to end and cries for more trillions to be created and thrown at the economy increase.
Last Friday’s employment numbers are just another indicator that the U.S. economy is very weak despite trillions created to make it stronger and now shall also choke off real economic expansion thanks to a debt crisis that only gets bigger each day.
While the “Don’t Worry, Be Happy” crowd can spin “tapering” into a good thing for now, the weight of years of total fiscal mismanagement and a monetary policy gone wild is setting us up for yet another economic crisis that the those who normally bail it out will need a bail-out themselves.
I would use continued strength in U.S. equities to lower exposure greatly and limit my general equities holdings to companies outside the U.S.
U.S. Bonds – While we may see a respite to rising rates in the short term, the worse investment for the next decade remains just that.
U.S. Dollar – The trading range has become so tight that movements that in the past wouldn’t even batter an eye now cause long-winded responses. It’s kissing your sister until further notice.
Mining and Exploration Shares – While clearly off the bottom, the heavy damage from the worse bear market in my 30-year career still lingers – especially as one goes down the food chain to juniors. I don’t see how that changes until either gold gets above $1,550 or we officially have said good-bye to 2013.


…..more at Grandich.com
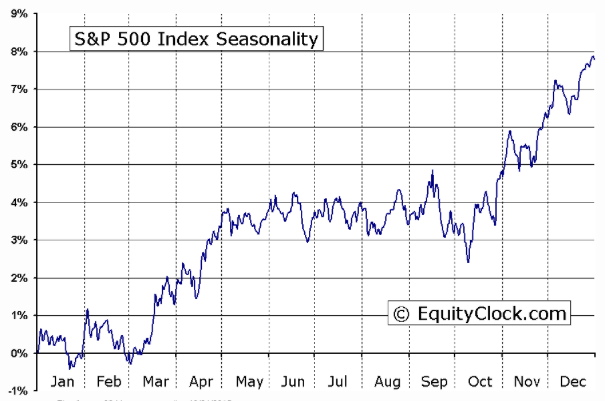
Seasonally, equity markets hold up rather well during the first half of September (Gold Cycles below), posting gains of 1.3% on average over the last 20 years. The weakest three weeks of the year occurs during the last two weeks of September and the first week of October. Declines over this three-week period reach 2.5%, on average, based on the same 20-year time-span. Contradicting this calendar tendency is the “Sell Rosh Hashanah and Buy Yom Kippur” tendency, which runs through to this Friday.
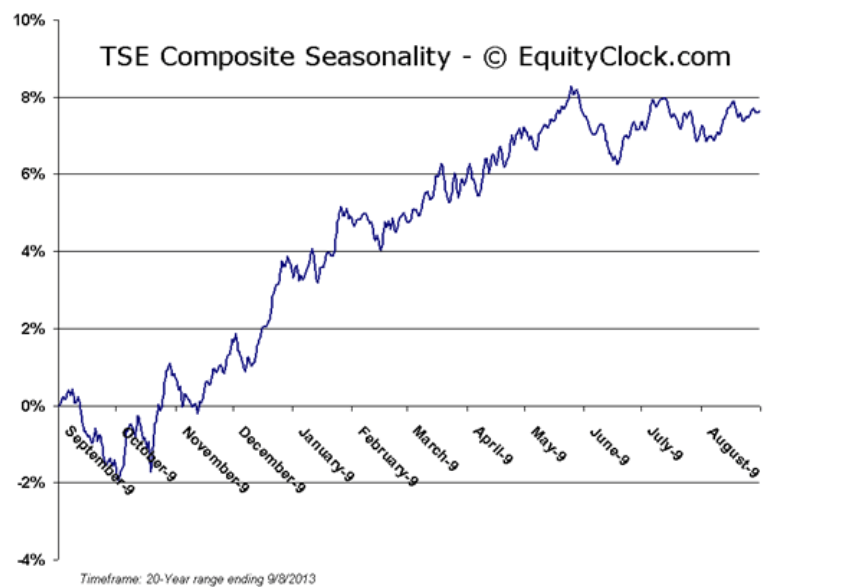
Loss for the S&P 500 between these key dates on the Jewish calendar averages 1.25%. Whichever scenario plays out, caution is warranted as seasonal volatility fuels erratic returns over the weeks ahead.
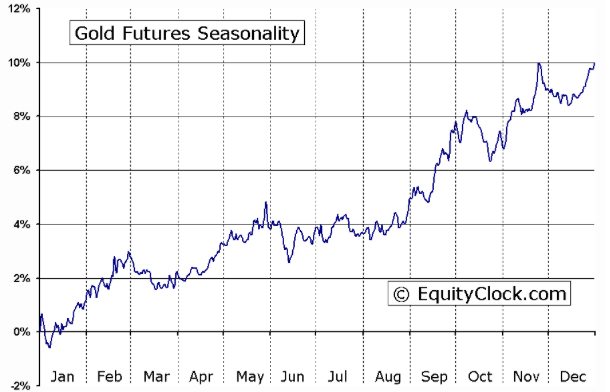
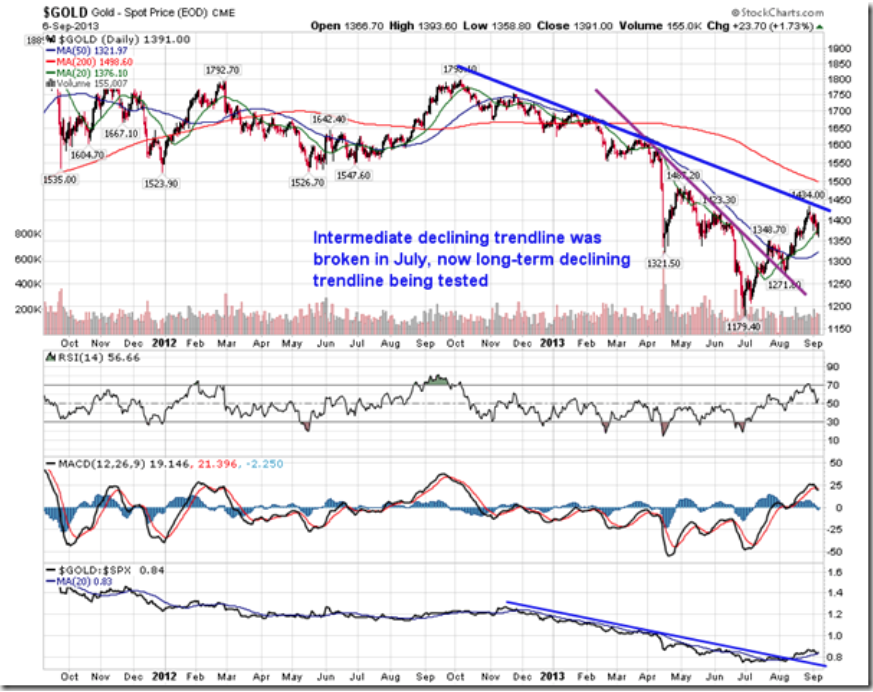
The price action of Gold has received much discussion over recent days as volatility amongst the precious metals has investors questioning whether the seasonal trade has concluded early this year. The price of Gold benefits from a period of seasonal strength starting in July and running through to the start of October as increased demand ahead of a number of end of year holidays, as well equity market volatility through the third quarter, drive the price of the precious metal higher. In July, the price of Gold broke above an intermediate declining trend line and now a long-term declining trendline is being tested. Short-term trend remains positive, derived by a series of higher-highs and higher lows. Reason to be optimistic of the intermediate trend is now being provided. The 50-day moving average is starting to curl positive for the first time in a year. As well, a reverse head-and-shoulders pattern can be picked out on the chart, offering the possibility of seeing the upside target of 1525 in the near future. Momentum indicators continue to trend positive as well, giving little indication of waning buying pressures, as of yet. The risks to the trade remain obvious (taper talk, situation in Syria, equity market volatility), however, as long as the recent trend of higher-highs and higher-lows remains intact, staying with the trade appears warranted; technicals have yet to show evidence that the short-term trend has changed. Positive inflation expectations since the end of June have acted as a catalyst for higher Gold prices, but in recent weeks the trend in inflation expectations has leveled off, stripping away some of the momentum from the Gold trade. The trend of inflation expectations, which will be highly dependent on the Fed’s actions in the upcoming weeks, warrants close attention due to the leading indications it presents upon the trend of Gold.
….for many more charts and commentary from Equity Clock on these cycles go HERE
“September Is the Cruelest Month”
While October is technically the worst month for the stock market on a statistical basis due to the propensity for stocks to have crashed during the month, September is actually the month that investors should fear the most.
According to Mark Hulbert, since 1896 (when the Dow Jones Industrial Average was created), the venerable index has lost an average of 1.07 percent during the month of September. And since 1929, the Dow has lost an average of 1.3 percent each time September rolled around. For the record, the average gain for all other months is 0.71 percent. And for those keeping score at home, that’s a spread of 1.78 percentage points, which, statistically speaking, is meaningful.
Hulbert also pointed out that during each of the last nine decades, September’s rank relative to other months in terms of performance has never been higher than ninth. Ugh!
….to continue to read of this article on go HERE
John Kerry gives Syria week to hand over chemical weapons or face attack
The US secretary of state has said that President Bashar al-Assad has one week to hand over his entire stock of chemical weapons to avoid a military attack. But John Kerry added that he had no expectation that the Syrian leader would comply.
The US Senate is due to vote this week on whether to approve an attack and Kerry was ambivalent over whether Barack Obama would use his powers to ignore the legislative chamber, if it were to reject an attack.
Kerry said the Americans were planning an “unbelievably small” attack on Syria.
….read it all HERE

-
I know Mike is a very solid investor and respect his opinions very much. So if he says pay attention to this or that - I will.
~ Dale G.
-
I've started managing my own investments so view Michael's site as a one-stop shop from which to get information and perspectives.
~ Dave E.
-
Michael offers easy reading, honest, common sense information that anyone can use in a practical manner.
~ der_al.
-
A sane voice in a scrambled investment world.
~ Ed R.
Inside Edge Pro Contributors

Greg Weldon

Josef Schachter

Tyler Bollhorn

Ryan Irvine

Paul Beattie

Martin Straith

Patrick Ceresna

Mark Leibovit

James Thorne

Victor Adair