

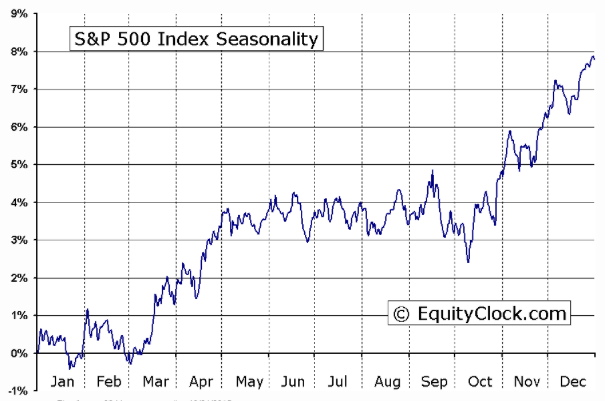
Seasonally, equity markets hold up rather well during the first half of September (Gold Cycles below), posting gains of 1.3% on average over the last 20 years. The weakest three weeks of the year occurs during the last two weeks of September and the first week of October. Declines over this three-week period reach 2.5%, on average, based on the same 20-year time-span. Contradicting this calendar tendency is the “Sell Rosh Hashanah and Buy Yom Kippur” tendency, which runs through to this Friday.
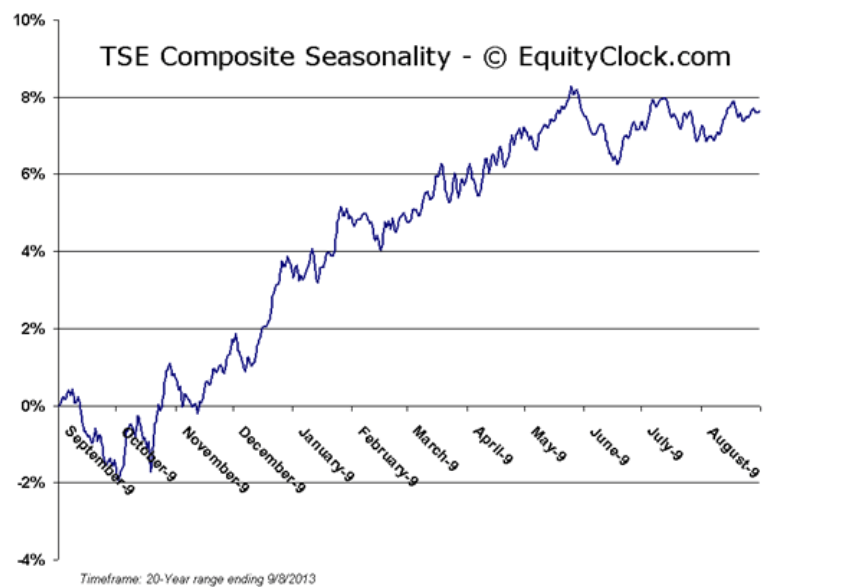
Loss for the S&P 500 between these key dates on the Jewish calendar averages 1.25%. Whichever scenario plays out, caution is warranted as seasonal volatility fuels erratic returns over the weeks ahead.
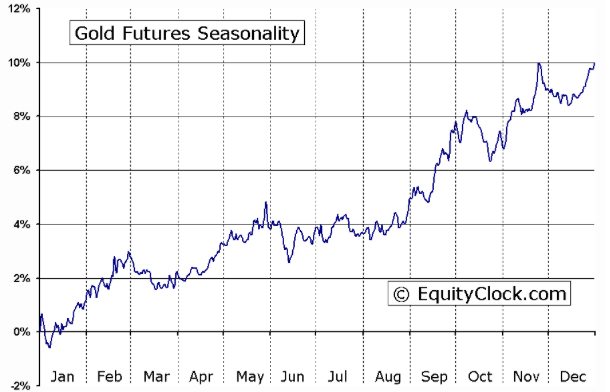
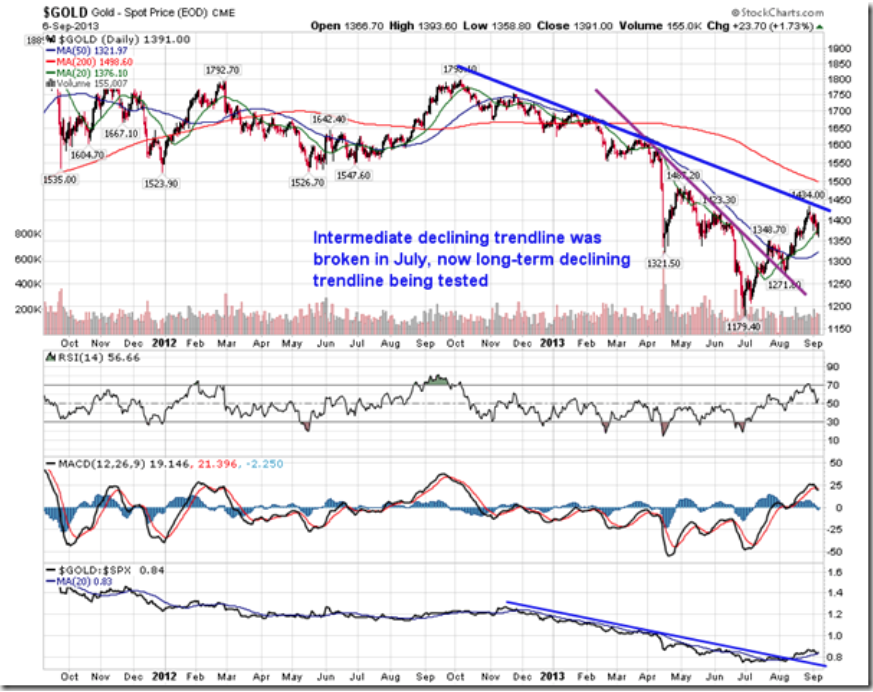
The price action of Gold has received much discussion over recent days as volatility amongst the precious metals has investors questioning whether the seasonal trade has concluded early this year. The price of Gold benefits from a period of seasonal strength starting in July and running through to the start of October as increased demand ahead of a number of end of year holidays, as well equity market volatility through the third quarter, drive the price of the precious metal higher. In July, the price of Gold broke above an intermediate declining trend line and now a long-term declining trendline is being tested. Short-term trend remains positive, derived by a series of higher-highs and higher lows. Reason to be optimistic of the intermediate trend is now being provided. The 50-day moving average is starting to curl positive for the first time in a year. As well, a reverse head-and-shoulders pattern can be picked out on the chart, offering the possibility of seeing the upside target of 1525 in the near future. Momentum indicators continue to trend positive as well, giving little indication of waning buying pressures, as of yet. The risks to the trade remain obvious (taper talk, situation in Syria, equity market volatility), however, as long as the recent trend of higher-highs and higher-lows remains intact, staying with the trade appears warranted; technicals have yet to show evidence that the short-term trend has changed. Positive inflation expectations since the end of June have acted as a catalyst for higher Gold prices, but in recent weeks the trend in inflation expectations has leveled off, stripping away some of the momentum from the Gold trade. The trend of inflation expectations, which will be highly dependent on the Fed’s actions in the upcoming weeks, warrants close attention due to the leading indications it presents upon the trend of Gold.
….for many more charts and commentary from Equity Clock on these cycles go HERE
“September Is the Cruelest Month”
While October is technically the worst month for the stock market on a statistical basis due to the propensity for stocks to have crashed during the month, September is actually the month that investors should fear the most.
According to Mark Hulbert, since 1896 (when the Dow Jones Industrial Average was created), the venerable index has lost an average of 1.07 percent during the month of September. And since 1929, the Dow has lost an average of 1.3 percent each time September rolled around. For the record, the average gain for all other months is 0.71 percent. And for those keeping score at home, that’s a spread of 1.78 percentage points, which, statistically speaking, is meaningful.
Hulbert also pointed out that during each of the last nine decades, September’s rank relative to other months in terms of performance has never been higher than ninth. Ugh!
….to continue to read of this article on go HERE


