
Timing & trends
Seasonality refers to particular time frames when stocks/sectors/indices are subjected to and influenced by recurring tendencies that produce patterns that are apparent in the investment valuation. Tendencies can range from weather events (temperature in winter vs. summer, probability of inclement conditions, etc.) to calendar events (quarterly reporting expectations, announcements, etc.). The key is that the tendency is recurring and provides a sustainable probability of performing in a manner consistent to previous results.
Identified below are the periods of seasonal strength for each market segment, as identified by Brooke Thackray. Each bar will indicate a buy and sell date based upon the optimal holding period for each market sector/index.
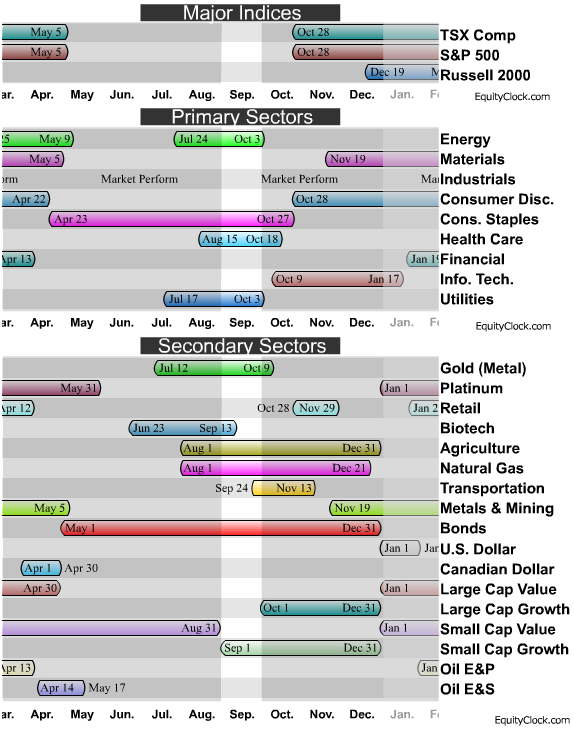
A seasonality study preferably uses at least 10 years of data. Most of our studies use 10-20 years of data, however, data may not always be available for periods greater than 10 years in length. Studies using less than ten years of data can be used, but they tend to be less reliable. Results of shorter term studies have a higher chance of being skewed by a single data point.
AN EXAMPLE OF INDIVIDUAL MARKET CHART BELOW. MORE INDIVIDUAL MARKET CHARTS HERE:
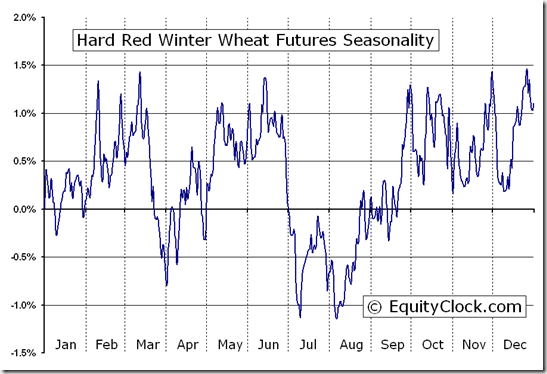
The above chart represents the seasonality for Gold Futures (GC) Continuous Contract for the past 20 years.
- Date range: January 1, 1990 to December 31, 2009
- Type: Commodity Futures – US
- Symbol: GC
Gold Futures Continuous Contract Seasonality
Analysis has revealed that with a buy date of September 13 and a sell date of May 23, investors have benefited from a total return of 183.61% over the last 10 years. This scenario has shown positive results in 9 of those periods.
Conversely, the best return over the maximum number of positive periods reveals a buy date of September 16 and a sell date of May 20, producing a total return over the same 10-year range of 159.82% with positive results in 10 of those periods.
The buy and hold return for the past 10 years was 125.11%.
**Results shown are compounded
FOR ALL SEASONAL MARKET CHARTS FROM FOREX, INDICES, COMMODITIES AND MORE GO HERE
Equity Clock is a division of the Tech Talk Financial Network, a market analysis company that provides technical, fundamental and seasonality analysis on a daily basis via TimingTheMarkets.com andEquityClock.com. Equity Clock’s mission is to identify periods of reoccurring strength among individual equities in the market using methodologies presented by some of the top analysts in the industry, including that of Don Vialoux, author of TimingTheMarkets.com.
Feel free to use any of the content or seasonality studies (charts, timelines, or otherwise) presented as long as a link-back to this site at EquityClock.com is provided.
For further information on indicators used in reports presented on this site, please visit our reference page.

One unfortunate habit that we commonly see with investors is the tendency to look to short-term market activity for investment guidance. As human beings, most of us are hardwired to defer judgement to the will of the group or at least question our own judgement when the consensus is against us. In some cases, pronounced movements in the stock market can accurately signal a fundamental change in the economy but in most cases, these movements prove to be little more than ‘noise’ created by fear, greed, or the interaction between conflicting investment strategies.
You can generally divide investment strategy (or investment mentality) into four main camps: 1) buy and hold; 2) momentum; 3) value; and 4) pure speculation. Each of these investor types makes buying and selling decisions based on a different set of rules and impacts the market in different ways. The buy and hold investor is the most benign of the camps. They don’t make investment and asset allocation decisions based on current market conditions. This type of investor simply purchases stocks when they have capital available and looks to hold these positions for years or even decades through various market cycles and economic conditions. Momentum traders and value investors, on the other hand, do not invest passively; they actively look for opportunities that they believe can be profitably exploited. Momentum traders make investment decisions based on stock price and volume trends. Increasing stock prices and growing volumes signal the buy opportunity while declining share prices and volumes signal sells. Value investors take the approach of focusing on fundamentals (such as earnings, cash flow, growth and financial position). Value investors want to buy stocks when they are cheap relative to underlying earnings and cash flow and will often purchase companies that have recently experience a price decline or that are largely unknown, untraded or just currently unloved. Pure speculators are less relevant to this discussion but would exhibit buying and selling behaviour similar to that of the momentum camp.
The effect that momentum traders and value investors have on market volatility is polarized. When the market moves in one direction, the momentum traders exacerbate the movement and therefore increase market volatility, by increasing buying when the market is rising and increasing selling when the market is falling. In fact, momentum traders unwittingly work together to generate market extremes. But when market prices move too far in either direction, value investors get involved. When prices get too high, value investors create a dampening effect by selling into the strength as many of the stocks they own have likely become overvalued. The selling results in a slowing or reversal of the previous uptrend, which signals to momentum traders that it is time to sell. As the market weakness persists, more and more momentum trades drive prices continuously lower until stocks get to a point where they start to look undervalued. This signals to value investors that it is time to start buying again which stabilizes the downward trend and once again can even reverse. And so on and so forth, the cycle continues.
Obviously not all investors can neatly be categorized into one of these investment types. Real world investment strategy involves a lot of human behavior and is too complex to be summarized into a few lines of text. Some investors will utilize multiple investment strategies. For example, an investor can purchase on value but then transition to a buy and hold approach. Investors can also purchase on initial momentum but then sell on value. Some investors will subscribe to one strategy in theory but another in practice. Some investors switch between strategies from trade to trade. And in the case of professional money managers, there is also the structural issue of investor contributions and redemptions: the fund manager may subscribe to a value strategy, but if the fund investors decide to redeem in down markets and contribute in up markets, the impact the fund has on the market may be more closely associated with momentum than with value.
Complexities aside, most investors, whether they know it or not, are largely loyal to their respective strategy. Equally true is the growing trend in favour of momentum strategies. This trend, which naturally increases volatility, is being driven by a number of factors. The evolution of discount brokerages and low cost trading has made trading easier from a logistical and financial perspective. Many brokerages also encourage excessive trading by offering lower fees to high-frequency traders and platforms which provide momentum-based research tools. Next, a virtual explosion has occurred in the market in the usage of computerized trading programs that promise to automate the BUY/SELL decision for unsophisticated investors. Of course, legitimate global economic risks and the fresh memory of recent stock market crashes have also made investors more willing to hit the sell button at the first sign of trouble and potentially the buy button when the market appears to be improving. And finally we have the growing influence of high frequency trading (HRT) companies, which have exploded in numbers and importance over the past several years. HRT uses sophisticated computing programs to execute (in some cases) thousands of trades per minute, resulting in profits of a faction of a cent per trade. The impact of HRT in today’s market is becoming more and more evident. Estimates will vary, but the research we have seen is staggering. In August 2011 (an extremely volatile period), Bloomberg reported that the percentage of average daily volume attributable to high frequency trading had exceeded 80% in the U.S. markets.
We only need to look to the Flash Crash of 2010 (also referred to as The Crash of 2:45) for a not so distant example of how momentum trading creates abnormal volatility. The Flash Crash occurred on May 6, 2010, when the Dow Jones Industrial Average plunged about 1000 points and then quickly recovered after a few minutes. This was the biggest intraday point decline in the Dow’s history. On September 30th, the Securities and Exchange Commission (SEC) and Commodity Futures Trading Commission (CFTC) issued a report on the crash after a five month investigation. The report “portrayed a market so fragmented and fragile that a single large trade could send stocks into a sudden spiral.” The report also discussed how immediately before the crash, a large institutional investor sold an unusually large number of S&P 500 contracts. The report concluded that this activity put selling pressure on an already weak market, which triggered high-frequency traders to start selling aggressively, causing a mini-crash to occur.
When we examine how different investment strategies interact with each other it is easy to understand why markets have been so volatile over the last 4 years. There has always been a divide between momentum and value investors. The difference today, in addition to legitimate economic concerns, is that technology has facilitated a trend in favour of momentum trading and the decline in per trade brokerage commissions over the last 10 years may actually be driving firms to encourage higher frequency client trading. But although hyper-volatility is very frightening to most retail investors it actually presents a great opportunity. Ultimately, a stock is a piece of a business and as long as that business generates positive cash flow, it will be able to invest in growth, pay a dividend, and command a fair price in a takeover transaction. There is nothing disconcerting if momentum traders give value investors the opportunity to purchase these companies at discounted prices, and then potentially sell them right back when those prices become inflated.
Exclusive Money Talks Radio Offers
 Find out how you can receive up to 200 cheques per year and save $200 on our Income Stock Service – Dividends are King!
KeyStone’s Latest Reports Section
Disclaimer | ©2013 KeyStone Financial Publishing Corp.

 UP EIGHT DAYS IN A ROW TOUCHING 1689.97 ON THURSDAY. ARE WE STALLING OR ABOUT TO BREAKOUT TO NEW HIGHS? MUCH DEPENDS ON WEDNESDAY’S FOMC REPORT. OVERALL, WE’RE OVERBOUGHT, AT RESISTANCE MAY HAVE ONLY RUN UP TO TEST HIGHS. THE EXCEPTION IS STRENGTH IN THE NASDAQ WHICH IS SITTING AT NEW BULL MARKET HIGHS. WE KNOW THE FED HAS ENGINEERED AND CONTIUES TO ENGINEER A HIGH STOCK MARKET – THE INFAMOUS BERNANKE PUT SO WE’RE MORE THAN LIKELY TO SEE NEW HIGHS ANYWAY. I WOULD HAVE CERTAINLY PREFERRED TO SEE MORE OF A CORRECTION, PARTICULARY SINCE THE CALENDAR STILL SAYS WE’RE IN A TRACHEROUS TIME FRAME. FORGETTING THE MAJOR INDEXES, STOCK SELECTION HAS BEEN THE KEY WITH NOTABLE ‘NAME’ STOCKS PUSHING HIGHER AND HIGHER.
MEANWHILE, I HAVE MY TRIGGER FINGER ON A BUY SIGNAL. NEXT STOP COULD BE 1730, 1750 OR EVEN 1800 IN THE SPX ONCE WE CLEAR 1709.
COME NEXT YEAR, PROBABLY IN LATE SPRING, CYCLES INDICATE THE POTENTIAL OF THE BEGINNING OF A MULTI-MONTH IF NOT TWO-YEAR BEAR MARKET BUT THE SPX COULD BE 1800 BY THEN. MY ORIGINAL FORECAST CALLED FOR A STRONG 2013 FOLLOWED BY A NEGATIVE 2014-2015. WORST CASE COULD BE A 50% CORRECTION – THAT’S 500 POINTS OR 1200 IN THE SPX- MEASURING FROM THE 667 BEAR MARKET LOW IN 2009 TO THE 1710 PEAK.
——————————————–
On Friday, excluding a brief dip during the opening hour, the major averages were confined to narrow ranges. The early weakness took place after it was reported that the University of Michigan Consumer Sentiment Index dropped to its lowest reading since April (76.8) in the preliminary September reading. That was down from 82.1 in August and well below the consensus expectation of a drop to only 82.0. Typically, consumer sentiment follows trends in employment, equity prices, oil prices, and media reports.
Tuesday and Wednesday of next week will bring the FOMC policy meeting where many expect the Fed to announce a reduction in the size of its asset purchases. The taper talk began after Fed Chairman Ben Bernanke mentioned, during his June 19 press conference, that barring a downturn in the economy, the Fed could scale back the size of its purchases later in the year. Following the press conference, participants began looking to the September meeting as a possible start date for tapering.
In economic data, the retail sales and PPI reports conveyed a familiar message of modest growth and low inflation. August retail sales came in below expectations (0.2% v. 0.4% Briefing.com consensus), but the July reading was revised higher to reflect an increase of 0.4% (0.2% prior).
Separately, total PPI jumped 0.3% (Briefing.com consensus 0.2%) while core PPI, which excludes food and energy, was flat (Briefing.com consensus 0.1%).
Total business inventories rose 0.4% in July after increasing an upwardly revised 0.1% (from 0.0%) in June. The Briefing.com consensus expected business inventories to increase 0.3%. Manufacturer (0.2%) and merchant wholesaler (0.1%) inventories were known prior to the release. The only new information was that retailer inventories increased 0.8% in July after increasing 0.1% in June.
On Monday, the September Empire Manufacturing survey will be released at 8:30 ET while August industrial production and capacity utilization will be reported at 9:15 ET.
The Leibovit VR Gold Letter Subscriptions:
We offer multiple subscription plans to best suit your needs.
Click HERE and scroll down to view subscription plans, pricing and sign up.

One market that’s set to pop 28% this year, according to an industry expert…
“The tipping point is that magic moment when an idea, trend or social behavior crosses a threshold, tips and spreads like wildfire.”
— Malcom Gladwell, The Tipping Point
3-D Printing: Richard’s $2 Billion Dollar (Severed) Hand
Hype or harbinger of new-Western prosperity?
Profit windfall or investor sinkhole?
New-age appliance or subniche cult item?
We leave it for you to decide… but one thing’s certain: Now that the mainstream press has begun asking these questions about 3-D printing, we’ve reached a tipping point. Search “3-D printing” in Google News and you’ll get 30,800 stories from the past month alone.
In this publication, we’ve called it “The New Industrial Revolution,” “The Fourth Technological Revolution” or simply the “Click. Print. Revolution.” Take your pick.
The most recent story before us: the 3-D-printed “Robohand.”
Richard Van As, a South African carpenter, lost four of his fingers to a circular saw, reports The Associated Press. An artificial limb — one that could detect the muscles’ electrical impulses and move — would have cost him tens of thousands of dollars. Sadly, he was unable to afford that.
“After my accident, I was in pain, but wouldn’t take painkillers,” he told AP.
“I barely slept, and the more pain I had the more ideas I got. Sometimes you have to chop fingers off to start thinking.” Soon after, Van As teamed with an Ivan Owen from Seattle.
 10,000 miles separated Van As in Johannesburg from Owen. But with the help of two 3-D printers donated by MakerBot, the two created their own “Robohand” prosthetic. They were able to cut the prototyping time from a week to just 20 minutes. And the cost? Just $500… more than a 95% discount.
“Maybe Robohand took the 3-D printing world by surprise with what we’ve done,” says Van As in a MakerBot YouTube video, “but if you have a look at the broad spectrum of it, I think that printing a mechanical device that can aid you when you’ve lost fingers, is a tiny little part of it. It’s a big, big picture, this 3-D printing…”
It’s not just Van As who sees potential in this space. “The idea that [3-D printing] is a gimmick, suitable only for hobbyists, looks ever less likely,” reads the latest Economist.
“Cheap 3-D printers for consumers are selling fast, but account for just 5% of the market. Many printers are still used for models and prototypes, but in 2012, more than 25% of the items emerging from 3-D printers were finished parts, up from 4% in 2003, according to Wohlers Associates, a consultancy.”
Wohler predicts that the 3-D printing industry will grow by 28% this year. But he doesn’t buy into the “Click. Print. Revolution” idea.
The company’s eponymous president says, “It’s unsettling to read this oversimplification where you push a button and out pops a shiny new thing,” he posted on his company’s site.
Despite many designs being accessible and simple to print (the websiteThingiverse.com comes to mind), Terry Wohlers argues that the process requires intensive design. We respect his authority on the topic. After all, Wholers’ 297-page industry market report is the go-to publication on additive manufacturing.
“The part you print won’t be as good as the part you order,” Nick Allen adds in an interview with USA Today. Mr. Allen, believe it or not, is both a 3-D printing skeptic and the CEO of a 3-D printing company, 3D Print UK. He thinks that expectations of 3-D printing have been set too high.
“We now live in a world where we can get something to our door by 9 a.m. if we order it at 5 p.m.,” he says. “Printing takes time.”
Au contraire, parries our good friend Josh Grasmick.
3-D Printing for Mature Audiences Only
“Today, I’ll show you the financial perfect storm brewing in the tech sector,” he writes below. “You are in for a hell of a ride.”
In today’s episode of The Daily Reckoning, Josh outlines three forces that will intersect in the next 12 months. He believes they’re set to create a windfall for early investors in the 3-D printing space. “This is it,” he writes: “the calm before the perfect storm.”
….read the entire article HERE
 Faber views China’s huge credit bubble, one that had been growing rapidly since 2008, as the next global financial crisis hot spot.
“The inflation in China is much higher than it seems. Credit growth in China will slow down. It is very much depends on whether they’re going into hard landing or soft landing, but this will inevitably lead to economic slowdown in emerging markets,” he said.
He sees the colossal credit bubble in China that had been expanding rapidly since 2008 as the next biggest risk to global economic growth.
….read it all HERE
Gold has not been a very good Investment over longer periods of time
We have to be aware that over longer periods of time, gold has not been a very good investment, since it does not generate new businesses, it does not generate dividends or cash flow. I would suggest some money ought to be in gold, as a replacement for having money on deposits with banks, for the risks in the banking system.
Protecting Yourself in the Coming Economic Collapse
Ed Note: Marc begins talking about Protecting Yourself in the Coming Economic Collapse @ the 3:38 mark in this 9:12 video


-
I know Mike is a very solid investor and respect his opinions very much. So if he says pay attention to this or that - I will.
~ Dale G.
-
I've started managing my own investments so view Michael's site as a one-stop shop from which to get information and perspectives.
~ Dave E.
-
Michael offers easy reading, honest, common sense information that anyone can use in a practical manner.
~ der_al.
-
A sane voice in a scrambled investment world.
~ Ed R.
Inside Edge Pro Contributors

Greg Weldon

Josef Schachter

Tyler Bollhorn

Ryan Irvine

Paul Beattie

Martin Straith

Patrick Ceresna

Mark Leibovit

James Thorne

Victor Adair