

Seasonality refers to particular time frames when stocks/sectors/indices are subjected to and influenced by recurring tendencies that produce patterns that are apparent in the investment valuation. Tendencies can range from weather events (temperature in winter vs. summer, probability of inclement conditions, etc.) to calendar events (quarterly reporting expectations, announcements, etc.). The key is that the tendency is recurring and provides a sustainable probability of performing in a manner consistent to previous results.
Identified below are the periods of seasonal strength for each market segment, as identified by Brooke Thackray. Each bar will indicate a buy and sell date based upon the optimal holding period for each market sector/index.
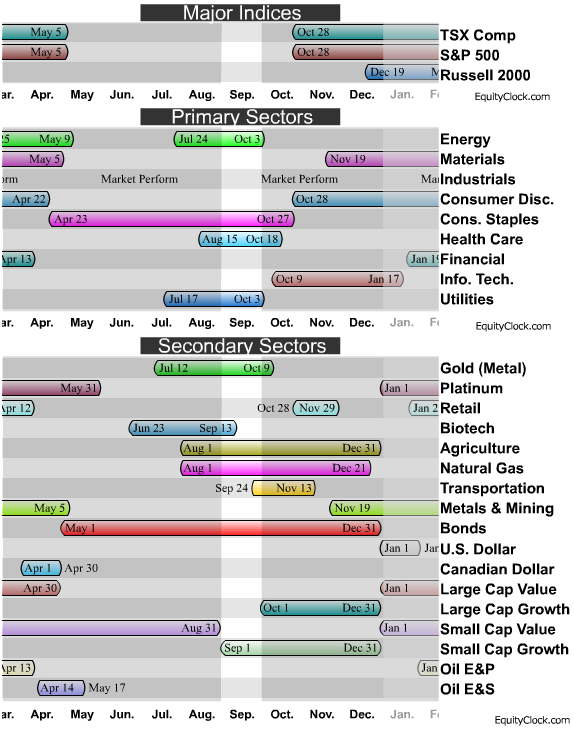
A seasonality study preferably uses at least 10 years of data. Most of our studies use 10-20 years of data, however, data may not always be available for periods greater than 10 years in length. Studies using less than ten years of data can be used, but they tend to be less reliable. Results of shorter term studies have a higher chance of being skewed by a single data point.
AN EXAMPLE OF INDIVIDUAL MARKET CHART BELOW. MORE INDIVIDUAL MARKET CHARTS HERE:
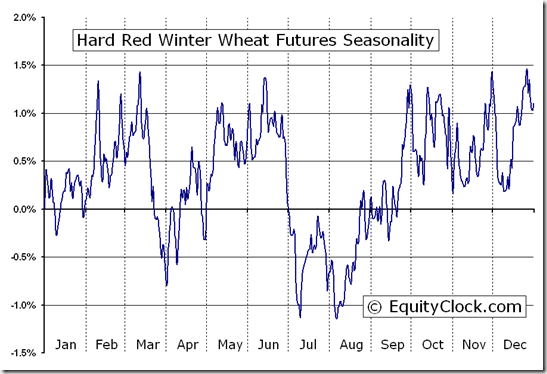
The above chart represents the seasonality for Gold Futures (GC) Continuous Contract for the past 20 years.
- Date range: January 1, 1990 to December 31, 2009
- Type: Commodity Futures – US
- Symbol: GC
Gold Futures Continuous Contract Seasonality
Analysis has revealed that with a buy date of September 13 and a sell date of May 23, investors have benefited from a total return of 183.61% over the last 10 years. This scenario has shown positive results in 9 of those periods.
Conversely, the best return over the maximum number of positive periods reveals a buy date of September 16 and a sell date of May 20, producing a total return over the same 10-year range of 159.82% with positive results in 10 of those periods.
The buy and hold return for the past 10 years was 125.11%.
**Results shown are compounded
FOR ALL SEASONAL MARKET CHARTS FROM FOREX, INDICES, COMMODITIES AND MORE GO HERE
Equity Clock is a division of the Tech Talk Financial Network, a market analysis company that provides technical, fundamental and seasonality analysis on a daily basis via TimingTheMarkets.com andEquityClock.com. Equity Clock’s mission is to identify periods of reoccurring strength among individual equities in the market using methodologies presented by some of the top analysts in the industry, including that of Don Vialoux, author of TimingTheMarkets.com.
Feel free to use any of the content or seasonality studies (charts, timelines, or otherwise) presented as long as a link-back to this site at EquityClock.com is provided.
For further information on indicators used in reports presented on this site, please visit our reference page.


