
Stocks & Equities
The VIX index, also known as the “fear index” has broken above 20% today. The political deadlock in Washington is continuing to take its toll on the market. The VIX has only seen 3 other days this year where it has broken above 20%.
Drew Zimmerman
Investment & Commodities/Futures Advisor
604-664-2842 – Direct
604 664 2900 – Main
604 664 2666 – Fax
800 810 7022 – Toll Free

The recent week was tough for the U.S. currency. Investors avoided the dollar as uncertainty over the U.S. government shutdown and the upcoming debate on the debt ceiling weighed on sentiment. The shutdown, with its suspension of funding for government workers and some programs, could hamper U.S. growth and delay tapering. Therefore, some investors buy gold as a safe haven or alternative to the U.S. dollar on the view that it will outperform other assets during political or economic turmoil. However, looking at chart of gold, it seems that these circumstances have had a limited effect on the gold market.
“(…) Sentiment remains hesitant towards gold, which has been reflected in the market positioning. While the temporary U.S. government shutdown has not proved to be a positive driver for prices, the risk of a debt ceiling breach holds scope to spark interest, in our view, given gold’s response in 2011,” Barclays noted.
In our previous essay on gold price in October 2013 we wrote that the debt ceiling issue came up in 2011. Back then, an agreement was reached only in the last minute and gold hit an all-time high of $1,920 an ounce, in part because of the uncertainties surrounding the deal.
Taking the above into account, investors are focusing now on the U.S. government shutdown and its impact on the dollar, and probably wondering where the final bottom of the current corrective move will form. When we take a look at the chart, we see that the dollar dropped to its new eight-month low in the previous week. What’s interesting, at the same time we didn’t notice a sharp increase in gold. This relationship between the U.S. dollar and gold has encouraged us to examine the US Dollar Index once again (from many perspectives) and the medium-term gold chart to see if there’s anything on the horizon that could drive gold prices higher or lower shortly. We’ll start with the USD Index very long-term chart (charts courtesy by http://stockcharts.com).
The situation in the long-term chart hasn’t changed much recently and all of what we wrote in our essay on the dollar and gold is still up-to-date.
The long-term breakout above the declining long-term support line was not invalidated. (…) However, since the medium-term breakdown (below the support line marked with red) is visible also from this perspective, we could see some short-term weakness anyway. It seems that the long-term support line will stop the decline – that is, if the USD Index gets that low. Therefore, from the long-term perspective, it seems that the downside is still quite limited.
Now, let’s examine the weekly chart.
On the above chart, we see that the USD Index reached the upper edge of the target area (marked with a black ellipse), so the bottom might be in. However, the situation is unclear, because even if the dollar moves three index points lower, it still will be in the target area.
The breakdown below the rising, medium-term support line is confirmed, which makes the picture more bearish. However, as you can see on the short-term chart, it’s not that important from the precious metals investors’ point of view.
Let’s check the short-term outlook.
Before moving to the main point, let’s focus on a different interesting situation. At the same time, the USD Index broke above the short-term declining resistance line and below the June low. In our opinion, the breakdown below the June low is more important, because it is of a more long-term nature. When two technical factors are in conflict, the stronger – more long-term / more significant one – usually prevails.
As mentioned earlier, it is not the most important thing that we can see on the daily chart. The most important thing is gold’s clear underperformance compared to the USD Index, something that used to herald declines in the precious metal market in the past months.
If we compare the dollar’s and gold’s performance in the last few weeks, we will see that gold has been underperforming the USD Index more and more significantly. In the final part of September, gold didn’t move visibly higher even though the USD Index started to decline, and this was proved last week on Tuesday when gold plunged without any signal from the dollar.
Again, this underperformance is the key thing to keep in mind at this time because it means the lack of clarity for the USD Index is not so important.
Gold can decline even without a signal (namely: without a rally) from the US Dollar Index.
Having discussed the current situation in the U.S currency, let’s now move on to the chart that shows us the yellow metal’s performance in the medium term.
On the above chart, we see that two important things happened last week.
The first is the completion of the head and shoulders pattern and the breakdown below the neck level. The second thing is the invalidation of this breakdown. The invalidation by itself is a bullish signal, so further strength in the short term should not surprise us.
Please note that there is a short-term declining resistance line based on the August and the September 19 highs, which intersects with the 38.2% Fibonacci retracement level based on the August-October decline and serves as resistance. If this resistance is broken and we see a breakout, we could also see another significant rally, perhaps above the $1,400 level. However, please remember that this is just a possibility, because this time, the medium- and short-term trends remain down.
Summing up, although the situation in the USD Index is unclear, it is not so important, because it seems that gold can decline even without a rally in the dollar. The medium-term outlook for gold remains bearish and the downward trend is not threatened at the moment, even though we could see some strength on a short-term basis.
To make sure that you are notified once the new features are implemented, and get immediate access to our free thoughts on the market, including information not available publicly, we urge you to sign up for our free gold newsletter. Sign up today and you’ll also get free, 7-day access to the Premium Sections on our website, including valuable tools and charts dedicated to serious Precious Metals Investors and Traders along with our 14 best gold investment practices. It’s free and you may unsubscribe at any time.
Thank you for reading. Have a great and profitable week!
Przemyslaw Radomski, CFA
Founder, Editor-in-chief
Gold Price Projections – SunshineProfits.com
* * * * *
About Sunshine Profits
Sunshine Profits enables anyone to forecast market changes with a level of accuracy that was once only available to closed-door institutions. It provides free trial access to its best investment tools (including lists of best gold stocks and silver stocks), proprietary gold & silver indicators, buy & sell signals, weekly newsletter, and more. Seeing is believing.
Disclaimer
All essays, research and information found above represent analyses and opinions of Przemyslaw Radomski, CFA and Sunshine Profits’ associates only. As such, it may prove wrong and be a subject to change without notice. Opinions and analyses were based on data available to authors of respective essays at the time of writing. Although the information provided above is based on careful research and sources that are believed to be accurate, Przemyslaw Radomski, CFA and his associates do not guarantee the accuracy or thoroughness of the data or information reported. The opinions published above are neither an offer nor a recommendation to purchase or sell any securities. Mr. Radomski is not a Registered Securities Advisor. By reading Przemyslaw Radomski’s, CFA reports you fully agree that he will not be held responsible or liable for any decisions you make regarding any information provided in these reports. Investing, trading and speculation in any financial markets may involve high risk of loss. Przemyslaw Radomski, CFA, Sunshine Profits’ employees and affiliates as well as members of their families may have a short or long position in any securities, including those mentioned in any of the reports or essays, and may make additional purchases and/or sales of those securities without notice.


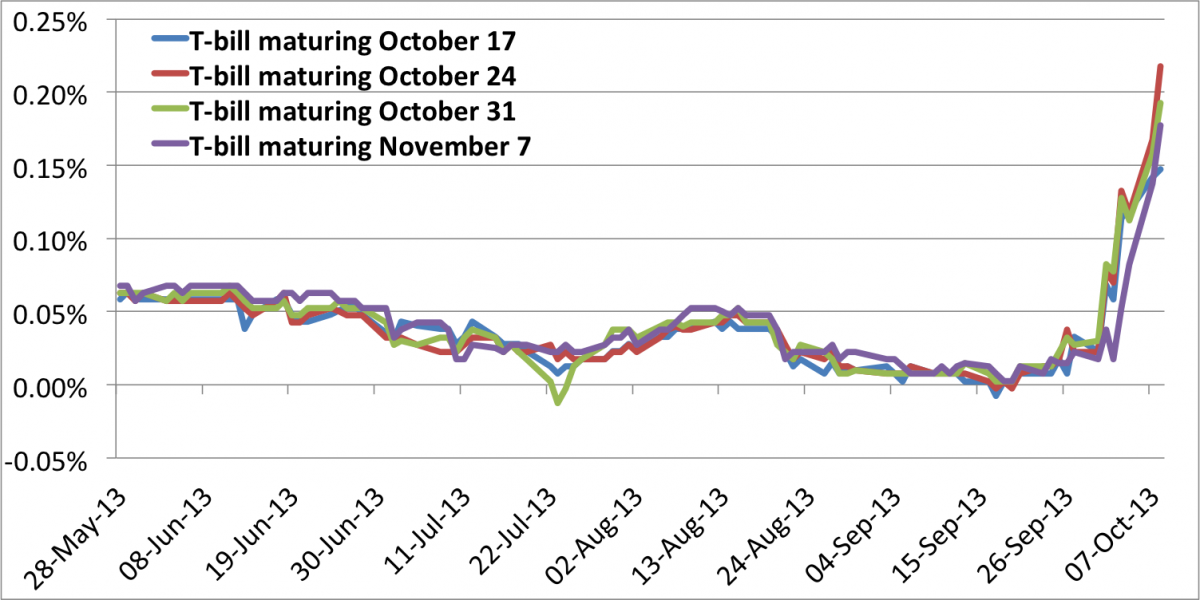
Short-Term Interest Rates Are Blowing Out Again This Morning As Debt Ceiling Tensions Get Worse.
Yields on the front end of the Treasury bill curve are blowing out this morning as markets price in higher odds that the disagreement in Congress over raising the debt ceiling will not be resolved in a timely manner.
….read & view more HERE
….also from ZeroHedge: JPY Jolts Stocks To Overnight Highs As T-Bill Yields Explode Higher
U.S. economic confidence plunged more in the past week than in any week since the collapse of Lehman Brothers on September 15, 2008 — the catalyst for the financial crisis and U.S. recession.
…..read more HERE


-
I know Mike is a very solid investor and respect his opinions very much. So if he says pay attention to this or that - I will.
~ Dale G.
-
I've started managing my own investments so view Michael's site as a one-stop shop from which to get information and perspectives.
~ Dave E.
-
Michael offers easy reading, honest, common sense information that anyone can use in a practical manner.
~ der_al.
-
A sane voice in a scrambled investment world.
~ Ed R.
Inside Edge Pro Contributors

Greg Weldon

Josef Schachter

Tyler Bollhorn

Ryan Irvine

Paul Beattie

Martin Straith

Patrick Ceresna

Mark Leibovit

James Thorne

Victor Adair