
Timing & trends
“Cave In” Triggers Buying Avalanche
It should really not come as a “shock” to anyone that the Republican controlled Congress “caved” to the demands of the White House at the “11th Hour.” Since the “deal” was stuck last week there have been a plethora of articles trying to put a positive spin on the GOP’s decision. However, the reality is that they were simply “out negotiated” at every turn.
Let me just say this now – when the debt ceiling debate returns in January/February it will NOT be an issue for the markets. The reason I say this is because of a little known provision inside the bill that effectively removes Congress’ ability to control the “debt ceiling”
“The plan includes a proposal offered by McConnell in the 2011 debt ceiling crisis that allows Congress to disapprove of the debt ceiling increase, which means lawmakers will formally vote on whether to reject a debt ceiling increase until Feb. 7. Obama can veto that legislation if it passes. If Congress fails as expected to gather a two-thirds majority to override the veto, the debt ceiling would be raised.”
What this means is that the Republicans voted on a bill that changes the mechanics of the “debt ceiling” vote to make failure nearly impossible. Instead of needing Congress to approve a debt-ceiling increase, Congress has to override an Obama veto in order to prevent it. So now it requires a two-thirds vote to trigger a “debt ceiling” fight rather than a 50 percent–plus–one vote previously.
Of course, it also won’t be an issue for the markets as they are now convinced that the Republicans will ALWAYS cave into the pressure from the White House. With the Republican Party fractured, and with the latest vote effectively neutering them, the markets are no longer concerned about another fight in three months. With the Fed fully engaged in QE though at least the first half of 2014 – the 3rd stage of the bull market has likely begun.
Market Breaks Out Of Consolidation
At the end of August I issued the first “official” sell signal of 2013. While this
signal did not result in a sharp market decline it did help navigate some of the
extreme volatility that has occurred since.
However, during that time frame, there have been many headwinds resolved
for the markets:
- The “Syrian Crisis” has been resolved
- IRS, NSA, Bengazi, AP, etc. – have all been resolved by being forgotten about.
- German elections are past with Angela Merkel remaining in control
- Janet Yellen is “in” at the helm of the Federal Reserve
- The fear of the Fed “Taper” is now gone for quite some time.
- Debt Ceiling/Shut Down is over.
- Corporate earnings are weak but still beating much lowered expectations. (It’s only the “beat “ that matters)
With all of these previous “headwinds” now successfully resolved, combined
with the ongoing impact of monetary interventions ($85 billion/month) at least
through mid-2014, there is little to keep the markets from advancing further
from here. This statement, however, doesn’t mean that I have changed my
mind on the fundamental underpinnings of the markets which are clearly
weak. It simply means that with mounting levels of liquidity, and no real
constraints, the markets have entered into the “vacuum of space” from a
technical basis.
I have notated several things in the chart below that I feel are critically
important to understand.
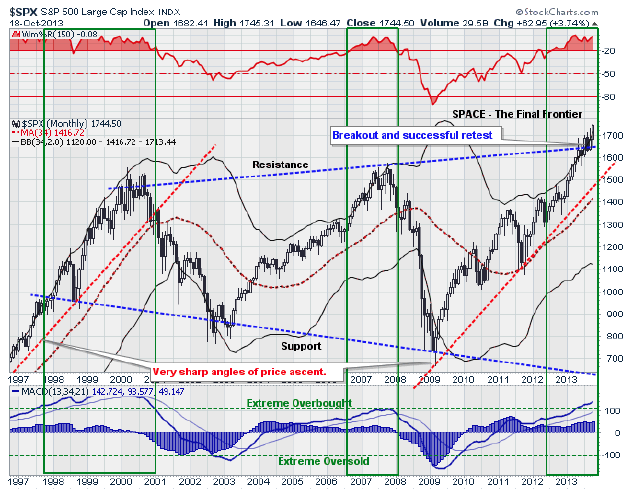
The chart above is a MONTHLY price chart so the measures of
overbought/sold are critically important. However, BECAUSE it is a monthly
chart it means that it is a very slow moving chart which can take months to
develop.

The leading American stock indices are at All Time Highs…and could be going a lot higher. The bears claim that the stock market rally is fuelled by Central Bank money printing…and that sooner or later that has to stop…or at least be cut back. But what if it doesn’t? The bears claim that the fools who are driving the market higher will get clobbered once the market “sees through” the idiocy of Central Banks monetizing government debts and deficits. Maybe so…but if you look at the stock market in Caracas, Venezuela ( up 300% last year, up over 300% so far this year) you might wonder why it is such a strong bull market…do you think that the fools who are driving it higher care about P/E multiple expansion? Not likely. Just like in Zimbabwe, which had the world’s hottest stock market a few years back, the people in Venezuela are driving their market higher because they are frightened by their currency’s tumbling purchasing power and they are desperate to exchange it for shares…or anything else.
I frequently ask myself, “Why do you believe what you believe?” I like to think that I saw the crash of 2008 comingbut maybe I’m just “naturally” predisposed to be skeptical of bull market enthusiasm. Having lived and traded through the 2008 crash (and several others going back to the 1974-75 crash) and having grown up listening to my Granddad’s stories of the Great Depression…maybe I’m predisposed to think that cash is king. Maybe I was right for a while…maybe I’m wrong now.
The American stock market, and many others around the world, have been on a bull run for over 4 years. The major indices are at All Time Highs. The more speculative small cap indices are rising faster than the large cap indices…it’s been a Risk-On Market in Full Bloom. The waves of bullish enthusiasm have been inspired by the anticipation of continuing Central Bank largess…the periodic set-backs in the market’s rise have come on fears that the flow of “financial heroin” would be reduced. We have been trading the Anticipation of Central Bank Policy…little else has mattered…including the recent Fiscal Follies in DC…the current Market Psychology is that the easy money is going to keep coming. (Of course Market Psychology is most bullish at an All Time High…how else would we have arrived here…Long Live the Fed!)
Trading comment:
One of my key questions is, “Are you trading what the market is doing…or what you think it should be doing?” I’ve been actively trading gold, stocks and currencies…I’ve made some money…but mostly because my risk management “overrides” have either kept me from making some trades or have taken me out of losing trades quickly…some of my “pet theories” about what the market “should be doing” have just been dead wrong recently.
Chart comment:
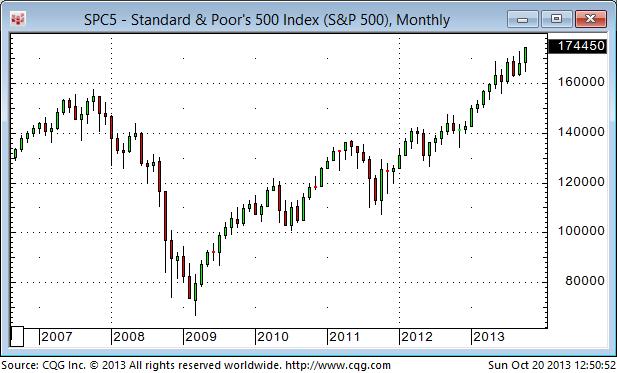
The S+P 500 – weekly: In the Big Picture Time Frame it’s clearly a Bull Market in Full Bloom…the guys who think Cash is Trash are certainly winning this round. The money printing may be helping the people who took risks and hurting the people who were risk averse…but it is what it is.
The S+P 500 – daily: When stocks started to fall away from the All Time Highs made Sept18 on the Fed’s “Non Taper” event I wondered if we had seen a Key Turn Date. I couldn’t bring myself to get short…there was no confirmation that a top had been made…and trading on the “got a hunch / bet a bunch” program usually produces miserable results…so I just watched stocks fall as the noise from the DC Fiscal Follies intensified. It was interesting that stocks turned higher on Wednesday Oct 9 – the day Janet Yellen was nominated. Once the market anticipated that the DC distraction was ending prices surged higher…even Fisher (the hawk?) declared that easy money has got to keep flowing…don’t fight the Fed!

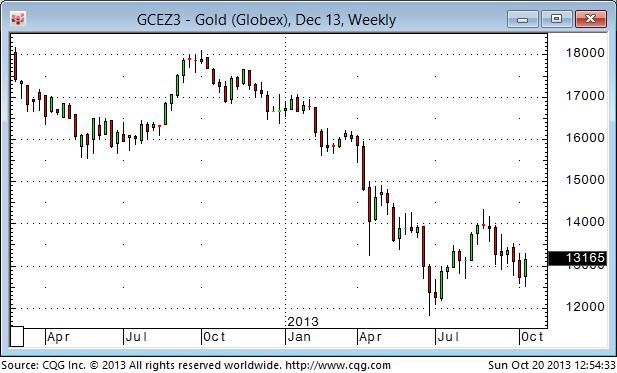
Gold – Weekly: In the Big Picture Time Frame it’s been a bear market in gold. Prices fell $740 or 38% from the Sept 2011 ATH to the 3 year lows made in late June. Comex Open Interest peaked in late 2010 and fell 43% to the September 2013 lows. Outstanding gold ETFs have fallen by more than 700 tonnes or 28% from the highs made late 2012. Money has been flowing to the stock market…not to gold.
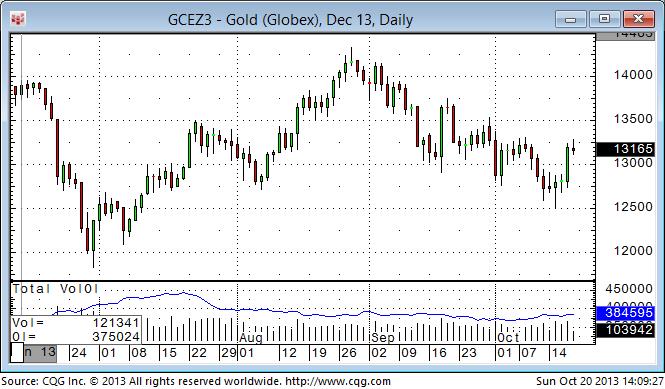
Gold – Daily: We’ve seen a couple of sharp sell-offs on big volume recently…the sell-offs came right on the opening of the US floor sessions…and it looked like forced selling from margin clerks…but who knows…and then we had a burst of buying (up $40 in a few minutes) very early Oct 17 (just after the Euro and Yen had surged higher) on the Chinese Credit Rating Agency downgrade of the USA. If the June lows were THE lows then the lows made this past week are important…and a move through $1350 would be a bullish confirmation. Gold came very close to making a perfect Weekly Key Reversal higher last week. HOWEVER, gold has been in a bear market…the $250 rally off the June lows may have just been a correction…and if last week’s lows at $1250 don’t hold then look for at least a challenge of the June lows.
Gold in terms of Gold shares – Weekly: For the past 2 years this blog has warned against buying gold shares because they were “cheap.” The ratio of gold/gold shares has recently gone to a 25 year extreme. If gold bullion is indeed making a turn higher from last week’s lows then gold shares may come roaring back…but wait for a confirmation.
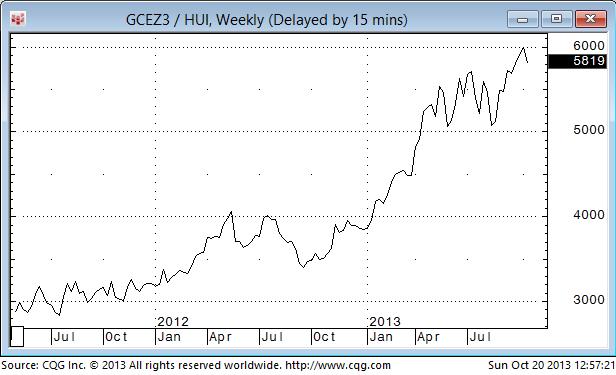
Gold in terms of the S+P 500 – Weekly: Money has been flowing to stocks and away from gold…stocks have been rising sharply in terms of gold. If you think that trend has run its course…sit down…and check out the perspective from the monthly chart below.
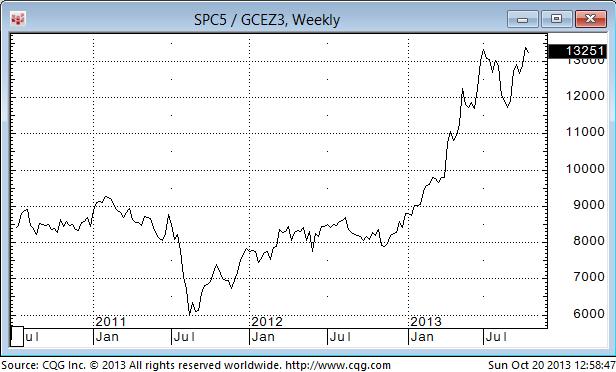
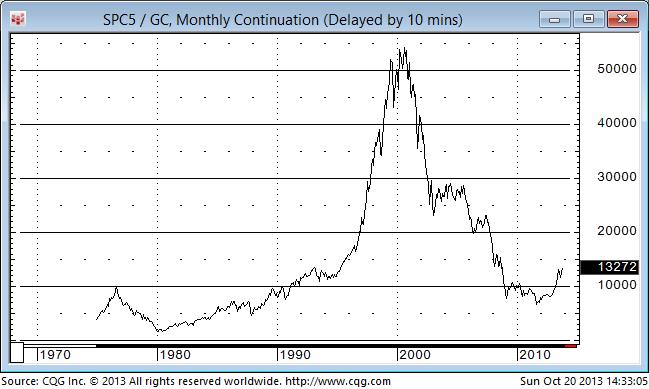
Gold in terms of the S+P 500 – Monthly: Stocks made huge gains in terms of gold during the 1990’s…the gains over the past two years have been relatively tiny.
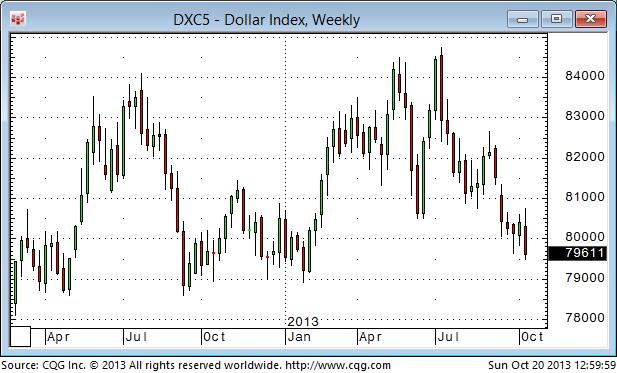
The US Dollar Index – Weekly: One of my key themes (a theme is an idea with a time frame longer than my trading horizon) has been that the US Dollar began a bull market in 2011…and is going to keep rising. A theme will often lead me to trade a market the way I think it should be going…rather than the way it is going. I bought the US$ Index during the DC Fiscal Follies (although my lack of conviction on the trade kept me to a ½ sized position) and I closed it out with a small loss when the Euro surged to new highs last week. The US Dollar Index traded to a 3 year high in early July but made a Weekly Key Reversal Down…and kept falling. It just registered another Weekly Key Reversal Down…I think taking a small loss was a good idea!
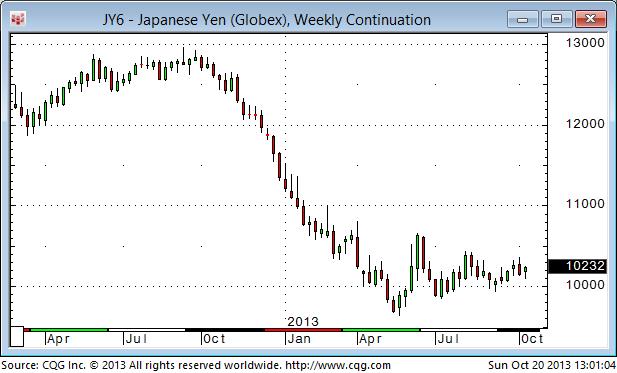
The Japanese Yen – Weekly: The Yen began to tumble last November when the market realized that Abe was going to win the election…but since the May lows it’s been unable to stay decisively below “Par”…confounding the Yen bears.
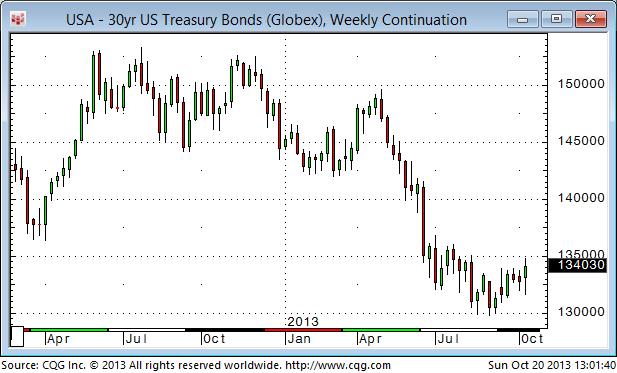
The US Long Bond – Weekly: The long bond traded at lifetime low yields in 2012…lower yields than were made in the panic of 2008…but beginning in May 2013 yields moved sharply higher. David Rosenberg, who was a bond bull for 25 years, thinks we’ve seen the lows in terms of yield and that, after a bit of a rally, bond prices are headed lower again. Other long time bond bulls (Gary Shilling, Lacy Hunt) think that the 2013 decline in the bond market was just a correction and that bonds are headed higher. It’s interesting that bonds rallied with the stock market the past few days…don’t fight the Fed!

In this Weekend Report I would like to show you some charts as to why I have made an abrupt short term move out of our short positions in the precious metals complex. I know some of you think I have lost my mind but I can assure you that isn’t the case. Regardless if I’m bullish or bearish I’m always looking at both sides of the market looking for clues for either direction. This week we got a major clue when the US dollar finally finished its third backtest to the bottom rail of the 11 point diamond top. It’s possible that gold and US dollar can trade in the same direction for awhile but I don’t think that will be the case longer term. So lets look at some charts for the US dollar first as that’s where the biggest clues lie.
A diamond is generally consider a bearish topping pattern but from my experience they can go either way. I’ve shown you some beautiful diamond consolidation patterns that worked out very well. It’s the same with the rising and falling wedges. Whichever way they breakout will be the direction of the next move. It just so happens that our 11 point diamond pattern on the US dollar has broken down and out of the pattern. If the reversal point at #10 held and the price action rallied back up and through the top rail it would have been a consolidation pattern but that is not the case. After a month or so of backtesting the bottom rail of the diamond pattern it now looks like the move down on Thursday maybe starting the impulse leg lower.
….read more & view 20 more charts HERE
WTI Crude Oil Futures traded have broken below $100/barrel this morning for the first time since July 3. Crude has traded as high as $112.24 in the past 3 months.
Drew Zimmerman
Investment & Commodities/Futures Advisor
604-664-2842 – Direct
604 664 2900 – Main
604 664 2666 – Fax
800 810 7022 – Toll Free

 The 1st 1/2 hour begins with Michael’s Economic & Financial Commentary.
{mp3}mtoct19leadfp{/mp3}
The second hour of Money Talks begins with Michael interviewing David Bensimon of Polar Pacific Financial Market Research
{mp3}mtoct19hourfp{/mp3}


-
I know Mike is a very solid investor and respect his opinions very much. So if he says pay attention to this or that - I will.
~ Dale G.
-
I've started managing my own investments so view Michael's site as a one-stop shop from which to get information and perspectives.
~ Dave E.
-
Michael offers easy reading, honest, common sense information that anyone can use in a practical manner.
~ der_al.
-
A sane voice in a scrambled investment world.
~ Ed R.
Inside Edge Pro Contributors

Greg Weldon

Josef Schachter

Tyler Bollhorn

Ryan Irvine

Paul Beattie

Martin Straith

Patrick Ceresna

Mark Leibovit

James Thorne

Victor Adair