Gold & Precious Metals

Financial Doom: Is This Time Different?

“I’m only rich because I know when I’m wrong — I basically have survived by recognizing my mistakes.” George Soros

Strebler’s Perspective:

I think of the 1980s and 1990s as sort of the “bounce around” decades. During those 20 years, I lived in San Diego, then southern Oregon, then San Diego, then northern Idaho, then San Diego. I was, in order: a broker and market analyst, a college professor, a broker, an investment adviser, a high-school teacher.

Gold had two similarly bounce-around decades, but they were twenty more frustrating, less productive years than mine. Shown on this chart from USAGold.com, we see the two decades framed within the goalpost-shaped black lines. Starting off around $850, down to $300, up to $500, down to $300, up to $500, down to the low $300s up to $400, down to $255 – THAT is the sad, mostly downward history of gold prices between the great bull markets on either side of those two decades.

gold-price-1970-2008

The ’80s and ’90s were extremely frustrating and unprofitable times for the yellow metal’s True Believers, yours truly included. I had witnessed and benefitted from the great 1970’s gold bull market and thus, expected more to come! Time after time, year after year, we thought gold was finally getting something going on the upside. The non-stop series of budget deficits, we believed, meant that the dollar, real estate, and the stock market were all finished. True redemption, in the form of crashing stock and real estate markets, were just around the corner, we heard over and over again. The precious metals would soar, making us wealthy and leaving the vast majority – the poor, ignorant masses – wondering what hit them.

Instead, the US and the world moved forward and huge fortunes were made in stocks and in real estate. It was our voices of doom that were out of step with reality, not the other way around. Those decades are burned into my long-term memory, much as the hardships of the Depression were burned into the minds of people who lived through the 1930s. So with some signs that the long bull market in gold that started in 2000 may now be over, forgive me for fearing the possibility now of years of sideways to lower prices. And forgive me for questioning the inevitability – right around the corner! – of the dollar’s collapse and the ascendancy of gold to its rightful place many times higher than current prices. I understand the rationale behind that narrative, but choose to look for confirmation in the markets themselves, rather than blindly accepting the latest promises of financial doom.

To subscribe to Richard Russell’s Dow Theory Letters CLICK HERE.

About Richard Russell

Russell began publishing Dow Theory Letters in 1958, and he has been writing the Letters ever since (never once having skipped a Letter). Dow Theory Letters is the oldest service continuously written by one person in the business.

Russell gained wide recognition via a series of over 30 Dow Theory and technical articles that he wrote for Barron’s during the late-’50s through the ’90s. Through Barron’s and via word of mouth, he gained a wide following. Russell was the first (in 1960) to recommend gold stocks. He called the top of the 1949-’66 bull market. And almost to the day he called the bottom of the great 1972-’74 bear market, and the beginning of the great bull market which started in December 1974.

Letters are published and mailed every three weeks. We offer a TRIAL (two consecutive up-to-date issues) for $1.00 (same price that was originally charged in 1958). Trials, please one time only. Mail your $1.00 check to: Dow Theory Letters, PO Box 1759, La Jolla, CA 92038 (annual cost of a subscription is $300, tax deductible if ordered through your business).

Baltic Dry Index Shows The Global Economy Headed For A Slowdown

The Baltic Dry Index is an indicator of demand in the global economy. If the Baltic Dry Index is declining, it means the global demand for goods is softening. When you look at the chart, you’ll see the devastated Baltic Dry Index—the index is saying demand never came back after the credit crisis of 2008.

 Baltic-Dry-Index-EOD-Chart

Canada’s Red Hot Housing Mkt Teeters On The Brink

Goldman Sachs Warns – ‘large correction’ in Canada housing

Canada is careering towards a sharp fall in house prices with some areas of the country’s market already showing signs that overbuilding and ultralow interest rates are taking their toll on the property market, Goldman Sachs reports.

Adding its voice to a growing chorus of concern, a report from Hui Shan, an economist at Goldman, late last week warned: “what goes up can keep going up, but then tends to come down.”

Ranking high-growth property markets in the last four years, Canada comes fourth behind Israel, Norway and Switzerland, according to her research. But unlike some other markets, construction activity has been trending up for years and has not shown signs of slowing down in Canada, she explained.

(Read MoreCanada’s red hot housing market teeters on the brink)

“If the elevated level of homebuilding persists in coming years, the risk of overbuilding will increase substantially. And if the ongoing housing boom is followed by a housing bust, the price decline can be quite significant given the excess supply of housing at that point,” she said.

Housing starts in Canada have shown recent gains, trending at 190,492 units in September compared to 188,440 in August, according to Canada Mortgage and Housing Corporation (CMHC). House prices, meanwhile, continue to defy the odds, with the national average sale price rising 8.8 percent on a year-over-year basis in September, according to the Canadian Real Estate Association (CREA).

Sales activity continues to remain strong with national home sales ticking higher by 0.8 percent from August to September, CREA have said, roughly in line with a 10-year average. Inventory figures also remain stable, according to the CREA, currently standing at 5.8 months – meaning it would take that amount of time to completely liquidate current inventories at the current rate of sales activity. Both datasets indicate that demand is still prevalent to some degree.

CanadaHousing

(Read MoreFitch rings warning bell on Canadian banks

Meanwhile, Stephen Poloz, the governor of the Bank of Canada maintains that he remains vigilant on any heat in the property market. Renewed momentum in the housing market points to a return of risk,he said in a monetary inflation report last Wednesday, despite some confidence that households were reducing their debts.

The Goldman Sachs report forecast that, in the short term, house prices may continue to increase before any “large correction”, however Sebastien Galy, senior currency strategist at SocGen told CNBC that some data suggests that small pockets of the market could already be seeing that downward pressure.

In particular its figures from Montreal Island in Quebec, which is supposed be the “most solid” higher income market, according to Galy. The median price of single-family homes has dropped 7 percent (year-on-year), according to the Greater Montreal Real Estate Board. Condominiums have seen a 5 percent fall.

(Read MoreWhere’s the next property bubble building?)

The market has also been complicated by easy monetary policies around the globe, Shan said. Central banks in the U.S., Japan and the U.K. have all embarked onquantitative easing (QE) programs which have pushed interest rates to record lows.

Shan believes the country has inadvertently imported this policy. “Lower interest rates reduce the funding costs for purchasing homes and shift the buy versus rent decision in favor of buying,” she said.


CNBC.com’s Matt Clinch. Follow him on Twitter 

@mattclinch81


The Bells Are Ringing

There is an old adage that “they do not ring bells at the top.”

This is factually not true, there are usually multiple warnings that a top is forming in the stock market, but most investors ignore them.

A big reason for this is psychology: tops form when investor sentiment has become extremely bullish. Being bullish usually means enthusiasm and overconfidence in a positive outcome. Neither of these items lend themselves towards taking note of negative developments or “signs of a top.

For this reason it’s important to note market developments. I’ve got a few that should give investors pause.

1)   Carl Icahn wants Apple (AAPL) to leverage up.

AAPL has maintained low debt and a sizable cash hoard for years. The company recently issued $17 billion in bonds (the single largest corporate offering in history) in order to pay out a dividend to shareholders. A company with a record of no debt issuing the single largest corporate offering in history is definitely a “bell ringing.”

Now Carl Icahn wants the company to take out more debt to implement a stock buyback. This is effectively “leveraging” up the company (adding debt to increase profits per share). This is another “bell ringing.” Regardless of one’s views on AAPL or Icahn, the notion of the former world’s largest company which has never had much debt to suddenly consider issuing debt to increase EPS is a “bell ringing.”

2)   Former top performers, particularly Tesla (TSLA) and Netflix (NFLX) appear to have topped out or are topping.

Facebook saw a massive reversal yesterday based on announcements that it is losing out in the important “teen” demographic.

Google has entered a blowoff top.

Apple floundering.

One by one the market leaders are beginning to crash and burn. Take note.

3)   The “smart money” is selling.

The smart money is getting out of the market. Fortress Investment Group, Apollo Investment Group and other large “smart money” investors are literally “selling everything” they can. They’re not doing this because they expect things to improve and the market to continue to move sharply higher.

warrenIndeed, even investment legend Warren Buffett, who has virtually never advocated against investing in stocks (with the exception of the Tech Bubble) has stated the market is “fully valued” at today’s levels.

Buffett loves stocks. He’s made his fortune investing in them. He is a near eternal optimist. For him to state the markets are fully valued and be sitting in the single largest cash hoard of his investment life is a major indicator that stocks are topping.

Please take note of all of this. There are multiple bells ringing.


About Gains Pains & Capital


Gains Pains & Capital is our free daily market commentary penned by our Chief Market Strategist Graham Summers and our research team of analysts. In it, they detail the most pressing economic and financial issues of the day, combining macro-based, value and technical analysis to present investors with a single sheet of research that they can use to navigate the market’s action.

To sign up for Gains Pains & Capital and receive three free Special Reports…

CLICK HERE NOW!!!


Stock Market Rally Watch

As we move into a historically strong period for stocks in the final two months of the year, the S&P 500 Index is already up 26 percent in 2013.

And there’s no sign that the Federal Reserve, which has pumped almost //www.gliq.com/cgi-bin/click?weiss_mam+283801-14+MAM2838+vgbb@shaw.ca+++2+4422655++“>$4 trillion into the economy to support companies, will end its stimulus program soon.

That begs the question: Will the rally continue?

To fully answer this key question, it’s important to look at three major factors that influence the stock market’s direction: valuation, trend and sentiment.

Today I’ll cover the first of these market indicators: valuation. And over the next two weeks, I’ll tackle trend and sentiment.

Stocks More Than Double

Market valuation is one of the most hotly debated topics among investors. Stock prices and earnings have come a long way since the darkest days of the financial crisis, which caused the S&P 500 to plunge to as low as 666 in March 2009.

Since then, the benchmark index has surged 158 percent (184 percent with dividends reinvested). Earnings for the 500 companies in the blue-chip index are up 100 percent.

The difference between price appreciation and actual profits has been accounted for by an expansion in the price-to-earnings ratio (P/E).

* In 2009, when nobody wanted to own stocks, the P/E ratio briefly dipped below 10.

* Today, based on expected earnings over the next 12 months, the P/E has risen to 14.3.

chart1

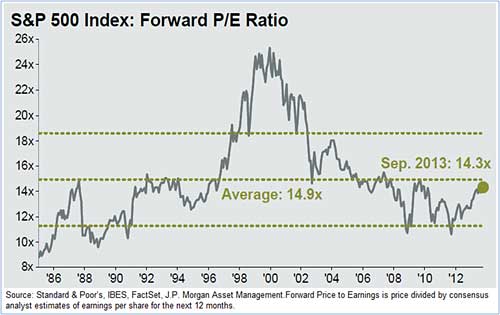
Historically, stocks aren’t overpriced based on this metric. In fact, the average forward P/E ratio for the S&P 500 has been 14.9 over the past 30 years, as you can see in the chart above.

Based on this picture, the market’s valuation still has some room to expand. The caveat is that any P/E expansion from here must rely more on rising prices than profits because earnings aren’t growing much anymore.

Profit Margins Maxed Out

After stocks bottomed in 2009, earnings exploded. In the first and second quarter of 2010, S&P 500 earnings surged an annual 92 percent and 51 percent, respectively, as business rebounded from the Great Recession.

But since then, earnings growth has slowed to a rate of only 5 percent, and revenue is growing even more slowly.

chart2

Third-quarter earnings have been upbeat, with more positive than negative surprises. But according to FactSet Research, S&P 500 profits are on pace to grow just 2.3 percent from the third quarter of 2012.

Over the past few years, businesses have cut costs to widen profit margins and lift earnings at a faster clip. But today, corporate profit margins are near an all-time high at 10 percent of gross domestic product (GDP).

That’s far above the average profit margin of 6.3 percent over the past 50 years.

As a result, investors shouldn’t expect cost-cutting and fatter margins to drive earnings higher. Instead, stronger revenue growth must do the heavy lifting for earnings to accelerate. And higher sales growth will only come from faster-than-expected GDP growth, or a sharp decline in the dollar.

So where does that leave us? Based on traditional valuation measures, like the P/E ratio, stocks don’t appear overly expensive today, but neither are they cheap. And I wonder how much higher the numerator (prices) can rise without much help from the denominator (earnings).

Next week I’ll explore two time-honored principles of stock-market behavior — the strong persistence of trends and the inescapable presence of mean reversion — and explain why they are at odds with each other.

Good investing,

Mike Burnick

test-php-789