
Gold & Precious Metals

The Real Economy Cannot Support the Financial One – A way to play coming defaults
 If we assume financial assets represent a claim against real assets, then it’s not a stretch to say financial asset valuation is way out of whack relative to the real economy.
Claims on the real economy have increased 11:1 since the credit crunch…I don’t think it is a stretch to expect lots of defaults and bankruptcies if this trend is not turned around quickly. And I don’t see much on the horizon to be optimistic about a quick turnaround.
A trading idea to play future defaults using ETFs.

How to Find and Profit from Hot Stocks
Position traders are those who hold stocks for weeks or months. Swing traders hold for days or may be a couple of weeks. Day traders are in and out within a day. No matter what style of trading you do or want to do, the simple concepts of the Stockscores Approach to trading can give you an edge. Attend one of these upcoming Stockscores presentations and learn:
– the essentials of stock analysis which will allow you to analyze any stock in seconds
– the simple rules of risk management that will help you avoid big losses
– how to use powerful tools to find hot stocks in minutes
With the sponsorship of Disnat, these presentations are free to attend. Each lasts 90 minutes and attendees may be eligible to receive some valuable services for free. Join us:
Calgary November 12th and 13th
Vancouver November 14th
Surrey November 16th
Online Webinar – to be announced soon
WEEKLY COMMENTARY
Stockscores Market Minutes Video
To trade or invest successfully, you must take your emotions out of the trading decision. This week’s Market Minutes video discusses some ways to do this plus provides Tyler’s weekly market analysis. Watch the video on Youtube by clicking here.
How to Sleep Well and Trade Better
Emotion is the enemy of every trader.
Our emotional attachment to money is what causes us to lose our discipline, to take big losses, to not let our strong and profitable trades run higher. It causes us to own too many stocks in one sector or fall in love with a stock that will only hurt us. Letting emotion in to our trading decisions is a fast way to insomnia.
The volatility of the past 5 years and the relative underperformance of the stock market over the last 13 years has caused many investors to simply abandon the stock market. In doing so, they have been left out of one of the strongest Bull markets in history. Not for rational reasons but because of the fear of losing has been too strong.
The perception is that the stock market is too risky, many investors don’t like the potential for a sharp sell off that can destroy their portfolio in a very short time period. The collapse of the stock market in 2008 has given many a form of post-traumatic stress disorder, leaving them on the sidelines when it has not made sense to do so.
The stock market may be volatile at times but that is not what determines risk. Risk is how you respond to the volatility, how you manage the potential size of your losses. The stock market is not risky, the people that play it are. It is how you deal with price volatility that determines risk.
If you want to sleep well while invested in stocks, you need to have a plan for managing risk. The notion that you can buy some “good” companies and forget about them is outdated and reckless.
Here are my essentials to being invested in the stocks and sleeping well:
- Plan to lose. When you buy a stock, know the price level where the stock market will have proven you wrong. Learn how to determine where a stock’s support price is and if the stock closes below that level, realize that the market is telling you that something is probably wrong at the company. Get out.
- Know your tolerance for risk. How much are you willing to lose on any one stock trade? If you risk more than this amount, you will get emotional. Take the difference between the entry price and the stop loss price and divide that in to your risk tolerance to determine how many shares to buy. If you are buying a stock at $10 with a stop loss point at $9 and you are willing to lose $500 on any one trade then you should buy 500 shares.
- Don’t obsess. You don’t need to watch your stocks constantly, if you are position trading then only look at the once a day or even once a week. You only need to check to see if your stock has given an exit signal, obsessing over every gyration will make you emotional and lead you to make mistakes.
- Have a written plan. You must write down your trading rules. When will you buy, when will you sell, how will you manage risk and how will you review your positions. Keep the plan simple but concise enough that there is no room for interpretation.
- Stick to your plan. Your plan should be based on strategies that you have tested and believe in. Deviating from the plan means you are going in to areas that have not been tested and that puts you closer to being a gambler. Gambling traders may win in the short term but in the long term they lose.
- Remember that trading stocks is as risky as you make it. Not having a plan with rules for limiting the size of your losses leaves you exposed to big losses if the market corrects sharply. With loss limits and discipline, you should never be the victim of a major market correction.
STRATEGY OF THE WEEK
This week, I applied the Stockscores Simple market scan, using a minimum number of trades of 200 for the Canadian Exchanges and 1000 for the US Exchanges. This scan looks for stocks that have a Sentiment Stockscore of at least 60 and a Signal Stockscore of 80 or higher and is a preset scan available to Advanced or Pro members of Stockscores. Many of the stocks that are found by this scan are well in to their upward trends already – good holds but too late to buy. I inspect the charts in search of stocks that are breaking from good long term chart patterns. Here are two standouts from this week’s trading.
STOCKS THAT MEET THAT FEATURED STRATEGY
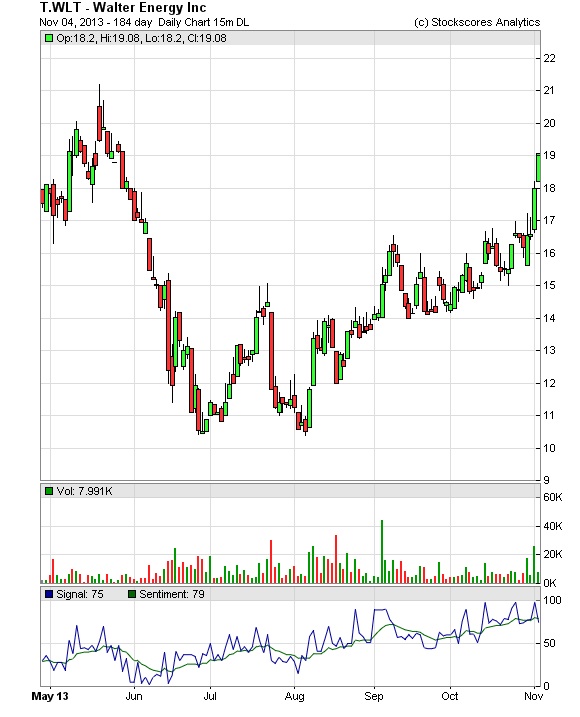
1. T.WLT
T.WLT (WLT) had a strong day on Friday, trading higher than average volume as it broke through resistance at $16.50. This stock has gained 18% since it was featured in the Tradescores daily newsletter two months ago but appears to have more upside from here. Support at $14.90.
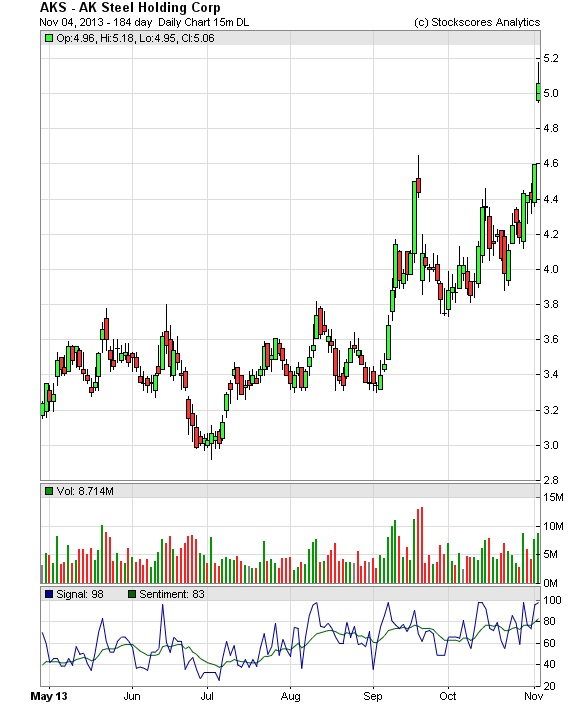
2. AKS
AKS is another recently featured stock from the Tradescores Alerts and Analysis newsletter, it broke higher last week as investors are starting to want to own stocks that benefit from a global economic turnaround. The stock is now up 14% in 35 days and looks like it is in the early stages of a long term trend reversal. (note, these remarks were prepared on the weekend, AKS received an upgrade from Goldman Sachs Monday morning and is now up another 12%)
- References
- Get the Stockscore on any of over 20,000 North American stocks.
- Background on the theories used by Stockscores.
- Strategies that can help you find new opportunities.
- Scan the market using extensive filter criteria.
- Build a portfolio of stocks and view a slide show of their charts.
- See which sectors are leading the market, and their components.
Disclaimer
This is not an investment advisory, and should not be used to make investment decisions. Information in Stockscores Perspectives is often opinionated and should be considered for information purposes only. No stock exchange anywhere has approved or disapproved of the information contained herein. There is no express or implied solicitation to buy or sell securities. The writers and editors of Perspectives may have positions in the stocks discussed above and may trade in the stocks mentioned. Don’t consider buying or selling any stock without conducting your own due diligence.


Question: Could you please clarify the relationship between interest rates and inflation. Why would rising interest rates cause an uptick in inflation? I understand that a strengthening economy puts upward pressure on both yields and inflation, but how (on the absence of economic growth and ignoring forex rate changes) can interest rate hikes directly affect inflation? Help!
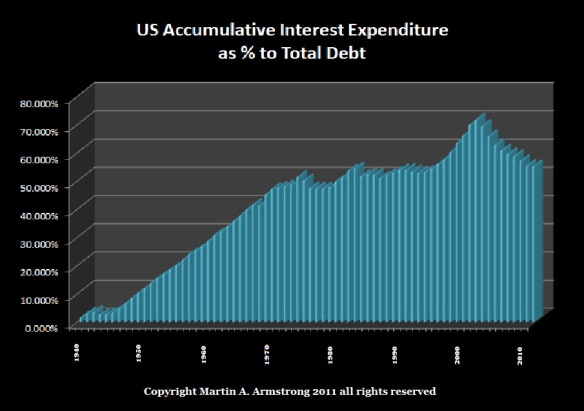
ANSWER: The idea that rising interest rates will reduce demand perhaps might apply if the ONLY borrower was the private sector. But the biggest borrower that a rise in rates has ZERO impact on is government. When Volcker raised rates to insane level in 1981 to stop inflation, he succeeded in sending the US national debt from $1 trillion to $8 by the end of the decade. About 70% of the entire debt is past interest.
Rate hikes today cause the government deficits to rise and thus the national debt will explode. I will be publishing a book very soon that takes the newspaper accounts before 1929 and after demonstrating that it has been socialism that has altered our thinking. Before 1929 rates rose and that was seen as bullish because people were still borrowing and the economy expanding. Rates declined in recession and depressions.
After 1929, rates rose and people said “OH GOVERNMENT WANTS TO STOP US FROM BUYING!” Sorry, but rates decline in Japan for 23 years and it stimulated nothing. Rates decline with the lack of borrowing (demand) and rise with expansion (demand).
– More from Martin:
Interest Rates & the Bell Curve
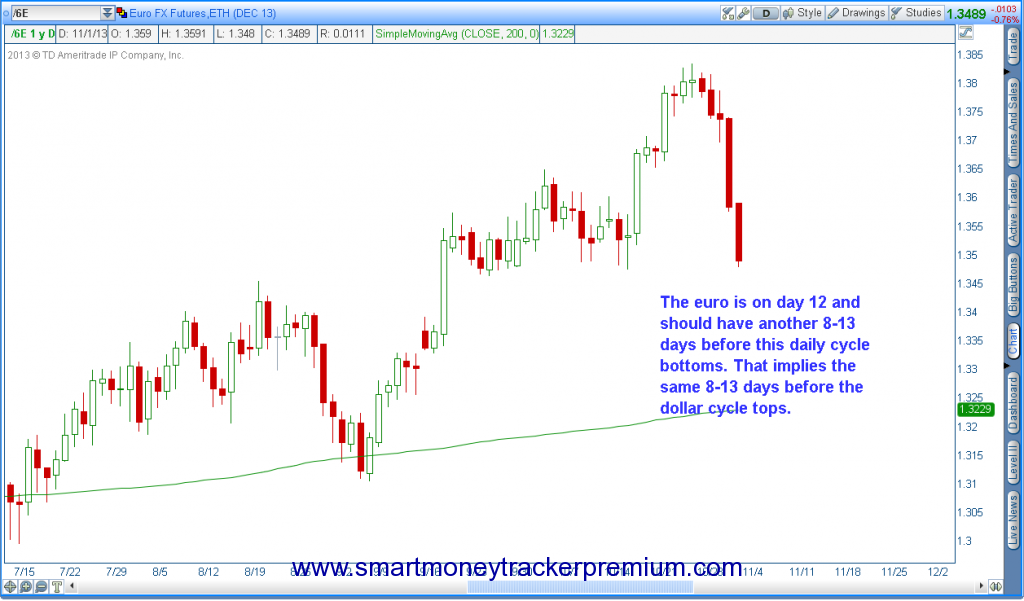
A rather interesting development occurred on Friday, and one that I wasn’t really expecting. The dollar sliced right through its intermediate trend line on its first attempt. I thought for sure we would see some kind of pullback from that trend line before a break. In my opinion this signals that there are a lot of people caught on the wrong side of this market.
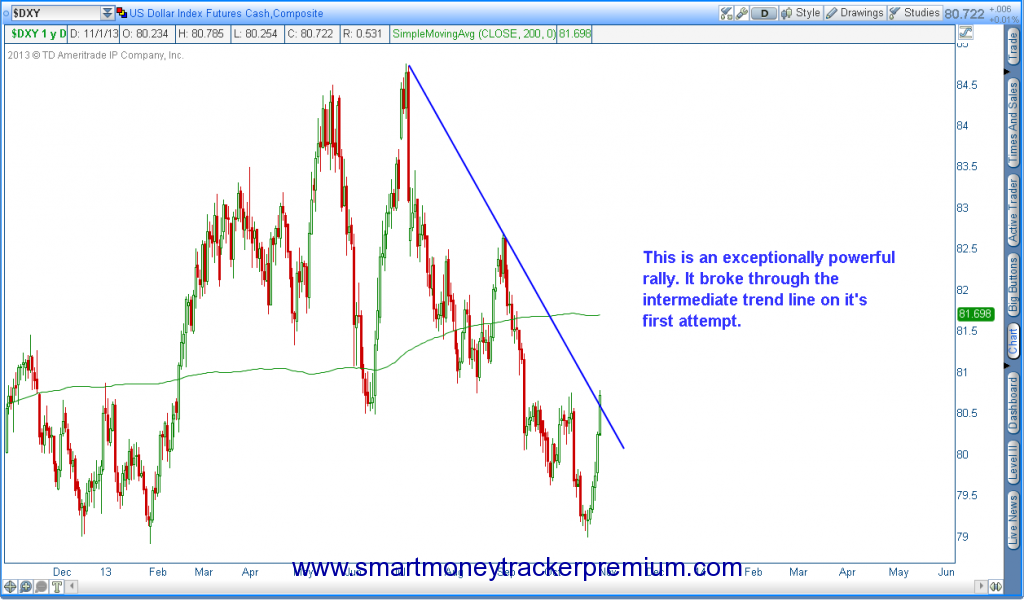
The ferocity of the first five days out of this yearly cycle low has me wondering if the megaphone pattern isn’t still in play and we’re about to see a test of the upper trend line area over the next 1-2 months.


-
I know Mike is a very solid investor and respect his opinions very much. So if he says pay attention to this or that - I will.
~ Dale G.
-
I've started managing my own investments so view Michael's site as a one-stop shop from which to get information and perspectives.
~ Dave E.
-
Michael offers easy reading, honest, common sense information that anyone can use in a practical manner.
~ der_al.
-
A sane voice in a scrambled investment world.
~ Ed R.
Inside Edge Pro Contributors

Greg Weldon

Josef Schachter

Tyler Bollhorn

Ryan Irvine

Paul Beattie

Martin Straith

Patrick Ceresna

Mark Leibovit

James Thorne

Victor Adair