Easy Money Will Lead to Bubbles
The difference between genius and stupidity is that genius has its limits.
– Albert Einstein
Genius is a rising stock market.
– John Kenneth Galbraith
Any plan conceived in moderation must fail when circumstances are set in extremes.
– Prince Metternich
You can almost feel it in the fall air (unless you are in the Southern Hemisphere). The froth and foam on markets of all shapes and sizes all over the world. It is an exhilarating feeling, and the pundits who populate the media outlets are bubbling over with it. There is nothing like a rising market to help lift our mood. Unless of course, as Prof. Kindleberger famously cautioned (see below), we are not participating in that rising market. Then we feel like losers. But what if the rising market is … a bubble? Are we smart enough to ride and then step aside before it bursts? Research says we all think that we are, yet we rarely demonstrate the actual ability.
This week we’ll think about bubbles. Specifically, we’ll have a look at part of the chapter on bubbles from my latest book, Code Red, which we launched last week. At the end of the letter, for your amusement, is a link to a short video of what you might hear if Jack Nicholson were playing the part of Ben Bernanke (or Janet Yellen?) on the witness stand, defending the extreme measures of central banks. A bit of a spoof, in good fun, but there is just enough there to make you wonder what if … and then smile. Economics can be so much fun if we let it.
I decided to use this part of the book when numerous references to bubbles popped into my inbox this week. When these bubbles finally burst, let no one exclaim that they were black swans, unforeseen events. Maybe because we have borne witness to so many crashes and bear markets in the past few decades, we have gotten better at discerning familiar patterns in the froth, reminiscent of past painful episodes.
Let me offer you three such bubble alerts that came my way today. The first is from my friend Doug Kass, who wrote:
I will address the issue of a stock market bubble next week, but here is a tease and fascinating piece of data: Since 1990, the P/E multiple of the S&P 500 has appreciated by about 2% a year; in 2013, the S&P’s P/E has increased by 18%!
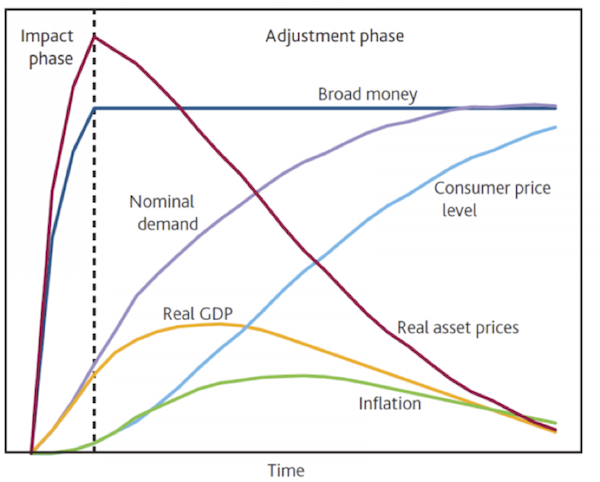
Then, from Jolly Olde London, comes one Toby Nangle, of Threadneedle Investments (you gotta love that name), who found the following chart, created a few years ago at the Bank of England. At least when Mervyn King was there they knew what they were doing. In looking at the chart, pay attention to the red line, which depicts real asset prices. As in they know they are creating a bubble in asset prices and are very aware of how it ends and proceed full speed ahead anyway. Damn those pesky torpedoes.
Toby remarks:
This is the only chart that I’ve found that outlines how an instigator of QE believes QE’s end will impact asset prices. The Bank of England published it in Q3 2011, and it tells the story of their expectation that while QE was in operation there would be a massive rise in real asset prices, but that this would dissipate and unwind over time, starting at the point at which the asset purchases were complete.
Oh, dear gods. Really? I can see my friends Nouriel Roubini or Marc Faber doing that chart, but the Bank of England? Really?!?
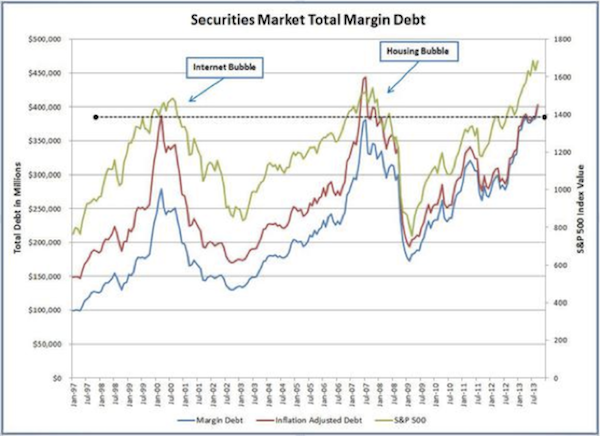
Then, continuing with our puckish thoughts, we look at stock market total margin debt (courtesy of those always puckish blokes at the Motley Fool). They wonder if, possibly, maybe, conceivably, perchance this is a warning sign?
And we won’t even go into the long list of stocks that are selling for large multiples, not of earnings but of SALES. As in dotcom-era valuations.
We make the case in Code Red that central banks are inflating bubbles everywhere, and that even though bubbles are unpredictable almost by definition, there are ways to benefit from them. So, without further ado, let’s look at what co-author Jonathan Tepper and I have to say about bubbles in Chapter 9.
Easy Money Will Lead to Bubbles and How to Profit from Them
Every year, the Darwin Awards are given out to honor fools who kill themselves accidentally and remove themselves from the human gene pool. The 2009 Award went to two bank robbers. The robbers figured they would use dynamite to get into a bank. They packed large quantities of dynamite by the ATM machine at a bank in Dinant, Belgium. Unhappy with merely putting dynamite in the ATM, they pumped lots of gas through the letterbox to make the explosion bigger. And then they detonated the explosives. Unfortunately for them, they were standing right next to the bank. The entire bank was blown to pieces. When police arrived, they found one robber with severe injuries. They took him to the hospital, but he died quickly. After they searched through the rubble, they found his accomplice. It reminds you a bit of the immortal line from the film The Italian Jobwhere robbers led by Sir Michael Caine, after totally demolishing a van in a spectacular explosion, shouted at th em, “You’re only supposed to blow the bloody doors off!”
Central banks are trying to make stock prices and house prices go up, but much like the winners of the 2009 Darwin Awards, they will likely get a lot more bang for their buck than they bargained for. All Code Red tools are intended to generate spillovers to other financial markets. For example, quantitative easing (QE) and large-scale asset purchases (LSAPs) are meant to boost stock prices and weaken the dollar, lower bonds yields, and chase investors into higher-risk assets. Central bankers hope they can find the right amount of dynamite to blow open the bank doors, but it is highly unlikely that they’ll be able to find just the right amount of money printing, interest rate manipulation, and currency debasement to not damage anything but the doors. We’ll likely see more booms and busts in all sorts of markets because of the Code Red policies of central banks, just as we have in the past. They don’t seem to learn the right lessons.
Targeting stock prices is par for the course in a Code Red world. Officially, the Fed receives its marching orders from Congress and has a dual mandate: stable prices and high employment. But in the past few years, by embarking on Code Red policies, Bernanke and his colleagues have unilaterally added a third mandate: higher stock prices. The chairman himself pointed out that stock markets had risen strongly since he signaled the Fed would likely do more QE during a speech in Jackson Hole, Wyoming, in 2010. “I do think that our policies have contributed to a stronger stock market, just as they did in March of 2009, when we did the last iteration [of QE]. The S&P 500 is up about 20 percent plus and the Russell 2000 is up 30 percent plus.” It is not hard to see why stock markets rally when investors believe the most powerful central banker in the world wants to print money and see stock markets go up.
Investors are thrilled. As Mohamed El-Erian, chief executive officer at Pacific Investment Management Company, said, “Central banks are our best friends not because they like markets, but because they can only get to their macro objectives by going through the markets.”
Properly reflected on, this is staggering in its implications. A supposedly neutral central bank has decided that it can engineer a recovery by inflating asset prices. The objective is to create a “wealth effect” that will make those who invest in stocks feel wealthier and then decide to spend money and invest in new projects. This will eventually be felt throughout the economy. This “trickle-down” monetary policy has been successful in creating wealth for those who were already rich (and for the banks and investment management firms who service them) but has been spectacularly a failure in creating good jobs and a high-growth economy. The latest quarter as we write this letter will be in the 1 percent gross domestic product (GDP) range.
And to listen to the speeches from the majority of members of the Federal Reserve Open Market Committee, their prescription is more of the same. Indeed, when Bernanke merely hinted this summer that QE might end at some point, something that everyone already knows, the market swooned and a half-a-dozen of his fellow committee members felt compelled to issue statements and speeches the next week, saying, “Not really, guys, we really are going to keep it up for a bit longer.”
We’ve seen this movie before. In the book When Money Dies, Adam Fergusson quotes from the diary of Anna Eisenmenger, an Austrian widow. In early 1920 Eisenmenger wrote, “Speculation on the stock exchange has spread to all ranks of the population and shares rise like air balloons to limitless heights. … My banker congratulates me on every new rise, but he does not dispel the secret uneasiness which my growing wealth arouses in me … it already amounts to millions.” Much like after the initial Nixon Shock in the 1970s, stock prices rise rapidly when a currency weakens and money supply grows. Not surprisingly, the 1970s led to bubbles in commodities.
This chapter will show how to spot bubbles when they form, how to profit from them, and how to avoid the dire consequences when they burst.
Excess Liquidity Creating Bubbles
As we write Code Red, stock prices are roaring ahead. In fact, many asset classes are looking like bubbles from our cheap seats. (While we expect a correction at some point, when the Fed or the Bank of Japan creates money, it has to go somewhere.)
One area that stands out as particularly bubbly is the corporate bond market. Investors are barely being compensated for the risks they’re taking. In 2007, a three-month certificate of deposit yielded more than junk bonds do today. Average yields on investment-grade debt worldwide dropped to a record low 2.45 percent as we write this from 3.4 percent a year ago, according to Bank of America Merrill Lynch’s Global Corporate Index. Veteran investors in high-yield bonds and bank debt see a bubble forming. Wilbur L. Ross Jr., chairman and CEO of WL Ross & Co. has pointed to a “ticking time bomb” in the debt markets. Ross noted that one third of first-time issuers had CCC or lower credit ratings and in the past year more than 60 percent of the high-yield bonds were refinancings. None of the capital was to be used for expansion or working capital, just refinancing balance sheets. Some people think it is good there is no new leveraging, but it is much worse. This means that many companies had no cash on hand to pay off old debt and had to refinance.
One day, all the debt will come due, and it will end with a bang. “We are building a bigger time bomb” with $500 billion a year in debt coming due between 2018 and 2020, at a point in time when the bonds might not be able to be refinanced as easily as they are today, Mr. Ross said. Government bonds are not even safe because if they revert to the average yield seen between 2000 and 2010, ten year treasuries would be down 23 percent. “If there is so much downside risk in normal treasuries,” riskier high yield is even more mispriced, Mr. Ross said. “We may look back and say the real bubble is debt.”

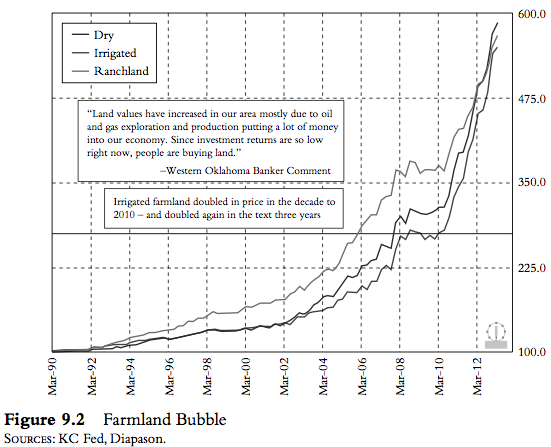
Another bubble that is forming and will pop is agricultural land in many places in the United States (although agriculture in other countries can be found at compelling values). The bubble really started going once the Fed started its Code Red policies. Land prices in the heart of the Corn Belt have increased at a double-digit rate in six of the past seven years. According to Federal Reserve studies, farmland prices were up 15 percent last year in the most productive part of the Corn Belt, and 26 percent in the western Corn Belt and high plains. Iowa land selling for $2,275 per acre a decade ago is now at $8,700 per acre. As you can see from Figure 9.2, the increase in farmland prices beats almost anything the United States saw during the housing bubble. A lot of banks in the Midwest will have problem with their lending.
Why are we seeing so many bubbles right now? One reason is that the economy is weak and inflation is low. The growth in the money supply doesn’t go to driving up prices for goods like toothpaste, haircuts, or cars. It goes to drive up prices of real estate, bonds, and stocks.
Excess liquidity is money created beyond what the real economy needs. In technical terms, Marshallian K is the difference between growth in the money supply and nominal GDP. The measure is the surplus of money that is not absorbed by the real economy. The term is named after the great English economist Alfred Marshall. When the money supply is growing faster than nominal GDP, then excess liquidity tends to flow to financial assets. However, if the money supply is growing more slowly than nominal GDP, then the real economy absorbs more available liquidity. That’s one reason why stocks go up so much when the economy is weak but the money supply is rising.
It is also why stock markets are so sensitive to any hint that the Fed might ease off on QE. Real players know how the game is played. You can listen to the business media or read the papers and find hundreds of “experts” saying that stock prices are rising based on fundamentals. You can take their talking points and change the dates and find they are essentially the same as 1999 and 2006–2007. (More on the implications of this in Part II when we talk about investing.)
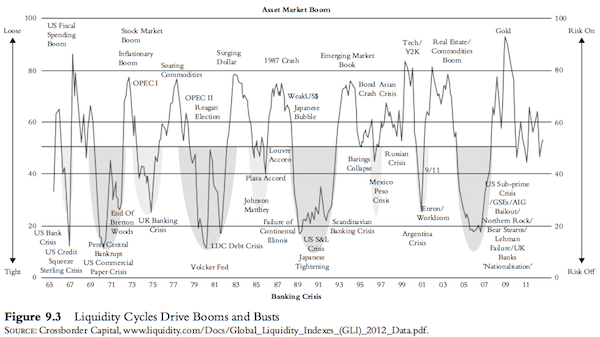
The rise in real estate, bonds, and stocks does not count toward any inflation measures. On the desk in his office at Princeton, Einstein once had the words “not everything which can be measured counts, and not everything which counts can be measured.” Inflation happens to be one of the things that counts but can’t be measured (except in very narrow terms). Excess liquidity flows from asset class to asset class. As you can see from Figure 9.3, booms and busts around the world happen whenever central banks tighten or loosen monetary policy.
Humans Never Learn
Financial bubbles happen frequently. In the 1970s, gold went from $35 to $850 before crashing. In the 1980s, the Japanese Nikkei went from 8,000 to 40,000 before losing 80 percent of its value. In the 1990s, the Nasdaq experienced the dot-com bubble and stocks went from 440 to 5,000 before crashing spectacularly in 2000. The Nasdaq lost 80 percent of its value in less than two years. Many housing bubbles over the past decade in the United Kingdom, United States, Ireland, Spain, and Iceland saw house prices go up 200 and even 500 percent and then lose over half their value in real terms.
The U.S. market has had frequent crashes: 1929, 1962, 1987, 1998, 2000, and 2008. Every time, the bubble was driven by different sectors. In 1929, radio stocks were the Internet stocks of their day. In 1962, the electronic sector crashed. The previous year, most electronic stocks had risen 27 percent, with leading technology stocks like Texas Instruments and Polaroid trading at up a crazy 115 times earnings. In 1987, the S&P had risen more than 40 percent in less than a year and over 60 percent in less than two years. In 1998, it was strong expectation on investment opportunities in Russia that collapsed. In 2000, the Internet bubble was so crazy that companies with no earnings and often no real revenues were able to go public, skyrocket, and then crash. Eventually, in all bubbles fundamental values re-assert themselves and markets crash.
Economists and investors have spilled a lot of ink describing bubbles, yet central bankers and investors never seem to learn and people get caught up in them. Peter Bernstein inAgainst the Gods states that the evidence “reveals repeated patterns of irrationality, inconsistency, and incompetence in the ways human beings arrive at decisions and choices when faced with uncertainty.”
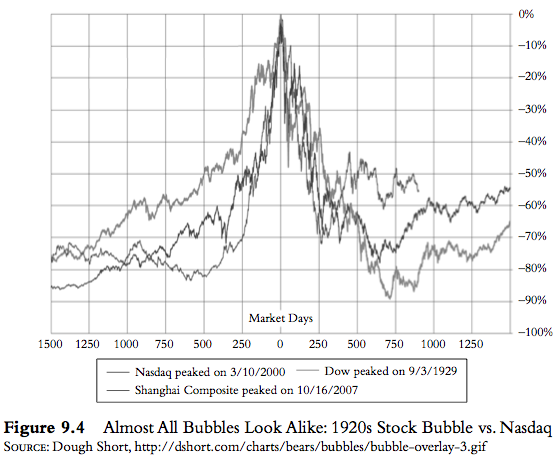
What is extraordinary is how much bubbles all look alike. The situations were similar in many ways. In the 1920s, the financial boom was fueled by new technologies such as the radio that supposedly would change the world. In the 1990s, the stock market rose on the rapid adoption of the Internet. Both technologies were going to fundamentally change the world. Stocks like RCA in the 1920s and Yahoo in the 1990s were darlings that went up like rockets. Figure 9.4 plots the two charts against each other. The similarities and timing of market moves are uncanny.
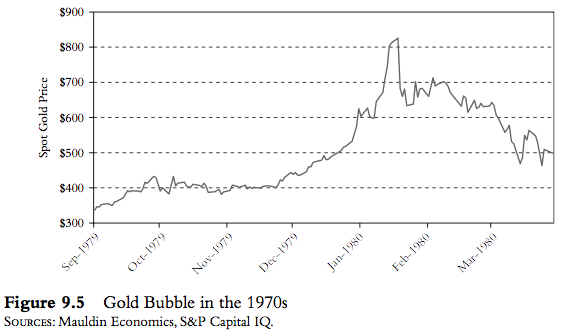
If you look at Figure 9.5, you can see the gold bubble in the 1970s. (Some academics have noted that the surge in gold prices closely followed the increase in inflation in the late 1970s, reflecting its value as a hedge against inflation. When inflation fell in the 1980s, gold prices followed. So it is an open question whether gold in the 1970s should be considered a bubble.)
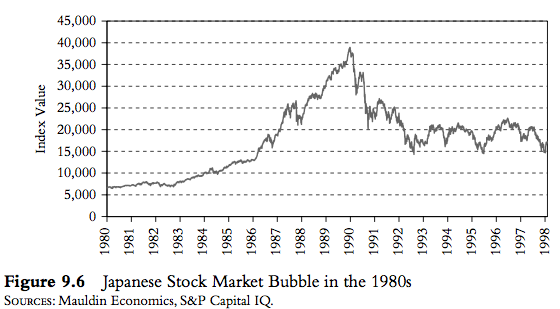
Fast-forward 10 years, and you can see from Figure 9.6 that the bubble in the Japanese Nikkei looked almost exactly the same.
Bubbles happen again and again. The same basic ingredients are found every time: fueled initially by well-founded economic fundamentals, investors develop a self-fulfilling optimism by herding that leads to an unsustainable accelerating increase in prices. And each time people are surprised that a bubble has happened. As billionaire investor George Soros once said about financial cycles: “The only surprise is that we are always surprised.”
For example, the corporate bond market appears to be in another bubble. “We have a hyper-robust bond market right now,” Dallas Fed President Richard Fisher, a former investment manager, said in an interview. These robust markets are part of the Fed’s policy intent, he said, but the credit market jump has put him on guard for a new destabilizing credit boom. “You don’t sit on a hot stove twice.”
Economists and investors, though, repeatedly sit on hot stoves. Economic researchers have managed to create bubbles in laboratories. Economist Reshmaan N. Hussam and his colleagues not only managed to create bubbles once, they managed to bring the same subjects back in for the same experiment and still managed to reproduce bubbles. It didn’t matter if people were given fundamental information regarding what was available or not. It didn’t matter how financially sophisticated the participants were either: corporate managers, independent small business people, or professional stock traders. No one was immune from re-creating bubbles.
It seems that everyone is born a sucker. As humans, we developed our instincts dodging lions and chasing antelopes on the African savannah over hundreds of thousands of years. Now it seems we chase asset prices. It is as if we are hard-wired to respond to movement in what market we are following. The conclusion from repeated experiments shows that it doesn’t matter if people live through one bubble or even two, they’ll likely fall for bubbles again. The smarter people learn from bubbles. But they don’t learn to avoid them; they participate again and simply think they’re smart enough to know when to get out. This has been showed many times in trading experiments conducted by Vernon Smith, a professor at George Mason University who shared in the 2002 Nobel Prize in Economics. As Smith said, “The subjects are very optimistic that they’ll be able to smell the turning point. They always report that they’re surprised by how quickly it turns and how hard it is to get out at anything like a favorable price.”
Anatomy of Bubbles and Crashes
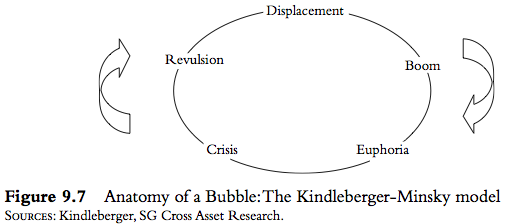
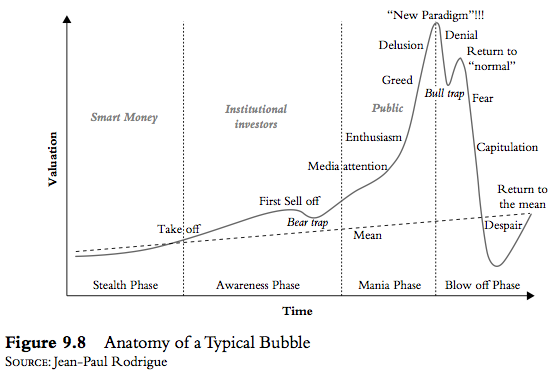
There is no standard definition of a bubble, but all bubbles look alike because they all go through similar phases. The bible on bubbles is Manias, Panics and Crashes, by Charles Kindleberger. In the book, Kindleberger outlined the five phases of a bubble. He borrowed heavily from the work of the great economist Hyman Minsky. If you look at Figures 9.7 and 9.8 (below), you can see the classic bubble pattern.
(As an aside, all you need to know about the Nobel Prize in Economics is that Minsky, Kindleberger, and Schumpeter did not get one and that Paul Krugman did.)
Stage 1: Displacement
All bubbles start with some basis in reality. Often, it is a new disruptive technology that gets everyone excited, although Kindleberger says it doesn’t need to involve technological progress. It could come through a fundamental change in an economy; for example, the opening up of Russia in the 1990s led to the 1998 bubble or in the 2000s interest rates were low and mortgage lenders were able to fund themselves cheaply. In this displacement phase, smart investors notice the changes that are happening and start investing in the industry or country.
Stage 2: Boom
Once a bubble starts, a convincing narrative gains traction and the narrative becomes self-reinforcing. As George Soros observed, fundamental analysis seeks to establish how underlying values are reflected in stock prices, whereas the theory of reflexivity shows how stock prices can influence underlying values. For example, in the 1920s people believed that technology like refrigerators, cars, planes, and the radio would change the world (and they did!). In the 1990s, it was the Internet. One of the keys to any bubble is usually loose credit and lending. To finance all the new consumer goods, in the 1920s installment lending was widely adopted, allowing people to buy more than they would have previously. In the 1990s, Internet companies resorted to vendor financing with cheap money that financial markets were throwing at Internet companies. In the housing boom in the 2000s, rising house prices and looser credit allowed more and more people access to credit. And a new financial innovation called securitization developed in the 1990s as a good way to allocate risk and share good returns was perversely twisted into making subprime mortgages acceptable as safe AAA investments.
Stage 3: Euphoria
In the euphoria phase, everyone becomes aware that they can make money by buying stocks in a certain industry or buying houses in certain places. The early investors have made a lot of money, and, in the words of Kindleberger, “there is nothing so disturbing to one’s well-being and judgment as to see a friend get rich.” Even people who had been on the sidelines start speculating. Shoeshine boys in the 1920s were buying stocks. In the 1990s, doctors and lawyers were day-trading Internet stocks between appointments. In the subprime boom, dozens of channels had programs about people who became house flippers. At the height of the tech bubble, Internet stocks changed hands three times as frequently as other shares.
The euphoria phase of a bubble tends to be steep but so brief that it gives investors almost no chance get out of their positions. As prices rise exponentially, the lopsided speculation leads to a frantic effort of speculators to all sell at the same time.
We know of one hedge fund in 1999 that had made fortunes for its clients investing in legitimate tech stocks. They decided it was a bubble and elected to close down the fund and return the money in the latter part of 1999. It took a year of concerted effort to close all their positions out. While their investors had fabulous returns, this just illustrates that exiting a bubble can be hard even for professionals. And in illiquid markets? Forget about it.
Stage 4: Crisis
In the crisis phase, the insiders originally involved start to sell. For example, loads of dot-com insiders dumped their stocks while retail investors piled into companies that went bust. In the subprime bubble, CEOs of homebuilding companies, executives of mortgage lenders like Angelo Mozillo, and CEOs of Lehman Brothers like Dick Fuld dumped hundreds of millions of dollars of stock. The selling starts to gain momentum, as speculators realize that they need to sell, too. However, once prices start to fall, the stocks or house prices start to crash. The only way to sell is to offer prices at a much lower level. The bubble bursts, and euphoric buying is replaced by panic selling. The panic selling in a bubble is like the Roadrunner cartoons. The coyote runs over a cliff, keeps running, and suddenly finds that there is nothing under his feet. Crashes are always a reflection of illiquidity in two-sided trading—the inability of sellers to find eager buyers at nearby prices.
Stage 5: Revulsion
Just as prices became wildly out of line during the early stages of a bubble, in the final stage of revulsion, prices overshoot their fundamental values. Where the press used to write only positive stories about the bubble, suddenly journalists uncover fraud, embezzlement, and abuse. Investors who have lost money look for scapegoats and blame others rather than themselves for participating in bubbles. (Who didn’t speculate with Internet stocks or houses?) As investors stay away from the bubble, prices can fall to irrationally low levels.
A Few Good Central Bankers
Space suggests we need to cut it off there, but as I promised at the beginning of the letter, here is a link to a short clip of Jack Nicholson as he might play a central banker on the witness stand when asked about his Code Red monetary policies. You can follow along with the testimony in the transcript below.
You want the truth? You can’t handle the truth! Son, we live in a world that has unfathomably intricate economies, and those economies and the banks that are at their center have to be guarded by men with complex models and printing presses. Who’s gonna do it? You? You, Lieutenant Mauldin? Can you even begin to grasp the resources we have to use in order to maintain balance in a system on the brink?
I have a greater responsibility than you can possibly fathom! You weep for Savers and creditors, and you curse the central bankers and quantitative easing. You have that luxury. You have the luxury of not knowing what I know: that the destruction of savers with inflation and low rates, while tragic, probably saved lives. And my existence, while grotesque and incomprehensible to you, saves jobs and banks and businesses and whole economies!
You don’t want the truth, because deep down in places you don’t talk about at parties, you want me on that central bank! You need me on that Committee! Without our willingness to silently serve, deflation would come storming over our economic walls and wreak far worse havoc on an entire nation and the world. I will not let the 1930s and that devastating unemployment and loss of lives repeat themselves on my watch.
We use words like “full employment,” “inflation,” “stability.” We use these words as the backbone of a life spent defending something. You use them as a punchline!
I have neither the time nor the inclination to explain myself to a man who rises and sleeps under the blanket of the very prosperity that I provide, and then questions the manner in which I provide it! I would rather you just say “Thank you,” and go on your way.
Yes, a blatant plug for the book, but a fun one. I invite you to visit the Code Red website to get the book.
Cleveland, New York, Geneva, and Saudi Arabia
I fly to Cleveland tomorrow for my annual checkup with my doctor, Mike Roizen, who tempted me to go ahead and get it over with by offering a seat at a small dinner with Frankie Valli (of Four Seasons and Jersey Boys fame, for you young kids). I grew up singing and would dream of being able to float into the vocal stratosphere as easily as Frankie did. (I actually did sing as a first tenor with the Fort Worth Opera chorus, and was on stage with both Beverly Sills and some new guy called Placido Domingo.) Listening to those ’50s oldies still gives me a thrill and stirs up wonderful memories; but truth be told, I could never hit the high C, let alone the regions that Frankie could so effortlessly explore. But we all have our dreams.
Post-Thanksgiving I’ll make a quick trip to New York (more on that later), and then I’m home for three whole weeks before another longer NYC trip and then Geneva in mid-December and Saudi Arabia at the beginning of the year. And there will be a day in Seattle wedged in there, with my partners at Altegris.
I have to admit to getting seriously overwhelmed. That is a different feeling from being stressed. My life is just too much fun these days for me to use the word stress. But perhaps a tad behind in my workload? The reading pile just keeps getting bigger, with ever more “must-read” items hitting the inbox. And the inbox has somehow exploded of late to 300 emails, which I must do something with. (If I owe you a response, I apologize. I will get my house in order.) And there are business meetings and the really important things, like friends and kids and grandkids and the gym.
The older I get the more I realize I have to hit the gym if I am going to keep going. I have started something that I am told is yoga, although it seems more like remedial stretching as practiced by Torquemada, masquerading as an otherwise pleasant lady named Kay Harris, whose body bends in a totally incomprehensible fashion, which I am assured is normal for people who take care of themselves. I am completely comfortable with pumping iron, and I enjoy it. I did 150 pushups in my workout this morning. But holding completely still in some silly posture for 30 seconds can be excruciatingly painful. It is one thing to be in a class and pretend and another thing altogether to have someone pushing you into proper form. Yoga is not for sissies.
It is time to hit the send button. Shadow Wong in Hong Kong is asking me for something she can start translating for the Hong Kong Economic Journal.
I hope you had time to go out with the kids or grandkids on Halloween. Granddaughter Lively, almost 5, went to a door and brought back a piece of candy and said, “Here, Papa John! You can have this!” It was a bite-sized Snickers, my favorite. I deemed that a sign from the Halloween gods and ate it. I hope you got your favorite as well.
Your watching a serious bubble in candy analyst
(can this seriously be a good thing?),
John Mauldin
subscribers@MauldinEconomics.com


 Now that the federal debt and spending cans have been kicked down the road until after the first of the year, a number of people have contacted me to see if the recent showdown will be repeated when the next days of reckoning occur.